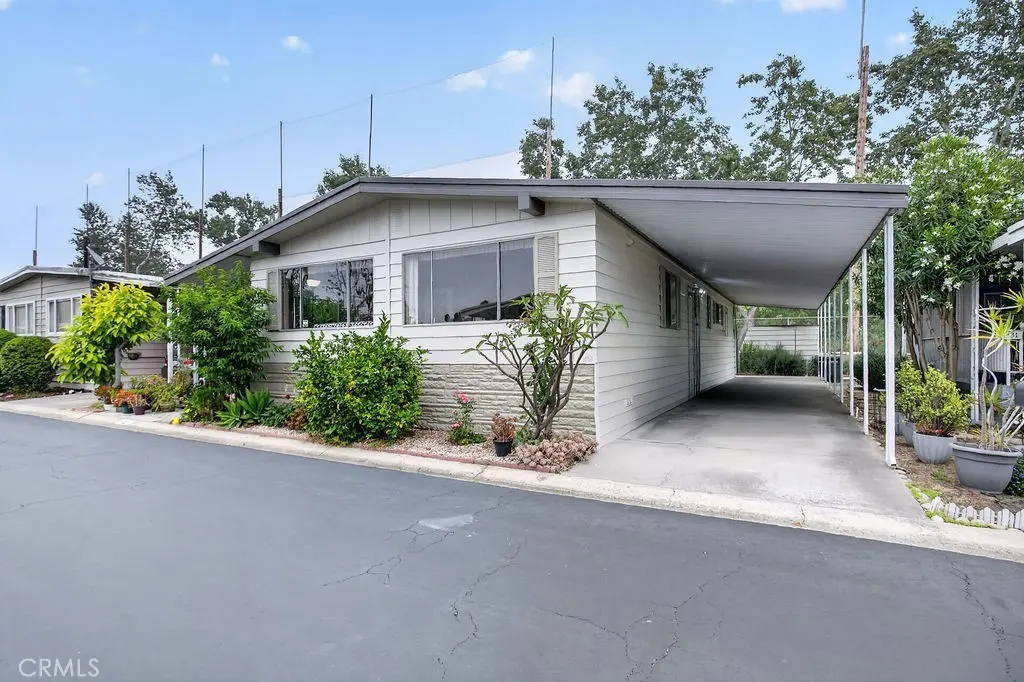
24921 Muirlands Blvd #32 · Lake Forest, CA
Flood risk 1/10 · Minimal
- FEMA flood zone
- X (unshaded)
- Chance of flooding over 30 yrs
- 0.0%
- Est. flood insurance / yr
- $507 – $1,088
Fire risk 1/10 · Minimal
- Est. fire insurance / yr
- $659 – $1,223
Heat risk 5/10 · Moderate
- Hot days now (above 91°F)
- 7 days/yr
- Hot days in 30 yrs
- 22 days/yr
Wind risk 1/10 · Minimal
- Chance of severe wind over 30 yrs
- —
Air-quality risk 4/10 · Minor
- Unhealthy air days now
- 4 days/yr
- Unhealthy air days in 30 yrs
- 5 days/yr
Risk factors via First Street. Map © Google.
Why this score? — see what drove the B+ grade
The composite is a weighted blend of 9 inputs, each scored 0–100. Each bar is that input's sub-score; the figure is the points it added to the 100-point composite (weight × sub-score).
- Cash flow +30.0/30.0
- ARV discount +13.0/15.0
- 1% rule +10.0/10.0
- DSCR +10.0/10.0
- Schools +5.6/10.0
- Livability +3.2/5.0
- Rent growth +3.1/5.0
- Condition / age +2.5/5.0
- Appreciation +0.0/10.0
$199,000
🖨 Deal sheet 📄 Offer letter ✓ Due diligence
Listing remarks MLS
Tropical Dream On Golf Course 2 Bed 2 Bath Living And Family Room Tub And Shower In Master Big Open Kitchen With Breakfast Bar Gas Cooking Appliances Included-Disability Access:None (N)
Key facts
- Large spa
- Golf course view
- Exercise room
Tags
Property features AI
Finance
- Other: Living area source: seller; Located south of El Toro; Latitude 33.620835, Longitude -117.693072
- Financial info: Monthly land lease: $1,709 (seller provided)
- HOA & community: Senior community; Land lease community (El Toro Mobile Estates)
Exterior
- Parking: 3 parking spaces; 3 carport spaces
- Utilities: Public sewer; District/public water
- Home design: Single-story mobile home (24' x 60'); Mobile home remains on site
- Construction: Double-wide mobile home; Total of 1 story
- Exterior features: Front yard; Street lighting and sidewalks (community)
Interior
- Bathrooms: 2 full bathrooms
- Heating & cooling: Has cooling (details: see remarks)
- Interior features: One-level home; Entry at main level; Community spa; Community pool
- Laundry & utility: Laundry inside the home
Neighborhood map
What this means for you Summary
Snapshot
- This is a 2-bed/2.0-bath manufactured listed at $199k.
Deal economics
- At list price, monthly cash flow is $1k ($15k/yr) — positive.
- The deal already cash-flows at list — no discount required.
- Meets the 1% rule at list price ($3k rent vs $199k).
- Recommended offer: $193k (3.0% below list) — sets the bar for market timing.
- Cap rate 13.9% vs local median 2.1% in Lake Forest — top-decile yield for the area; either an underpriced asset or a hidden risk that comps aren't pricing in. Stress-test before assuming the spread holds.
Location & tenants
- Location reads 65/100 on livability (#387 in CA) — a middle-class / working-renter tenant base. Strengths: crime A+, employment A+, housing B; Watch: commute C-, amenities F, cost of living F.
- Saddleback Valley Unified (suburban): math 51% / reading 73% proficiency, ranked #67 of 517 in CA (top 13%) — acceptable for families but not a draw, mixed tenant base, ~2y average lease.
- Market conditions: Rents rising (+2.5%/yr); 205 active listings in the ZIP; 38 comparable units currently listed for rent nearby; rentals at typical pace (median 25d on market — plan ~3-4 weeks tenant-placement turnaround); high-income renter base; 6,974 units permitted in Orange County in 2024 (3,839 in 5+ unit buildings).
- This rent runs 32% of the median local income ($126k/yr) — at the standard rent-burdened threshold; future hikes will face affordability resistance.
Forward outlook
- Local home prices are declining (-3.0%/yr); year-one equity from $1k of loan paydown is wiped out by about $6k of value loss. Plan a longer hold.
- Orange County population projected at +14% by 2050 — modest demand growth; plan on rents tracking national, not racing it.
- At projected returns (-3.0% appreciation + 2.5% rent growth), your $56k cash investment doubles in ~5 years — after that, you're playing with house money.
Negotiation context
- It's been on market 43 days — a 3% lower offer ($193k) is reasonable based on typical stale-listing flexibility.
- 4 sale attempts since 17y ago with the ask held roughly flat each time — persistent listings suggest the price (not the market) is what's stuck; bring a comps-based counter.
- Current owner paid $46k; list at $199k implies a 333% gain — meaningful room to come down on a strong offer.
Risks & watch-outs
- Climate carrying-cost: extreme-heat days projected 7→22/yr by 2055 (HVAC capex compounding) — expect insurance premiums to compound above CPI over the hold.
Questions for the listing agent
- It's been on market 43 days. Have you received any prior offers? Is the seller open to a 3% concession, seller financing, or rate buy-down credit?
- Built in 1974 — when were the roof, HVAC, electrical panel, plumbing, and water heater last replaced?
- Is there a deadline driving the sale (1031 exchange, divorce, estate, relocation)? That informs how much negotiation room exists.
- Schools are B-rated — typically a magnet for longer-tenancy family renters. What's the average tenant stay here, and is there a school-zone premium baked into asking?
- What's the average days-on-market for RENTAL listings here right now (not sales)? A rising rental-DOM trend means longer vacancies and softer asking-rent achievability than the comps imply.
- What's the recent tenant-quality profile in this submarket — average credit score on applications, eviction rate, late-payment / NSF rate, and stable-employment percentage? A property-management company in the area should have these aggregated.
- How much new for-sale + rental construction is in the pipeline within 1–3 miles? Heavy new supply typically softens prices + rents 12–24 months out; constrained supply supports both.
Investment metrics
- 1% rule
- 1.68% ✓
- Cap rate
- 13.91%
- Cash-on-cash
- 27.21%
- DSCR
- 2.21
- GRM
- 5.0
CMA / ARV
- ARV (median comp)
- $226,598
- List price
- $199,000
- Delta
- -12.18%
- Verdict
- UNDERPRICED
- Comps
- 20 within 1.0 mi
Show comp detail 12 sales within ~0.75 mi
| Address | Dist | Beds/Ba | Sqft | Sold | Price | $/sf | Match |
|---|---|---|---|---|---|---|---|
| 24921 Muirlands Blvd #209 | 0.00mi | 2/2.0 | 1,440 (0%) | 1mo | $152,500 | $106 | 99 |
| 24921 Muirlands Blvd #265 | 0.00mi | 2/2.0 | 1,440 (0%) | 2mo | $185,000 | $128 | 98 |
| 24921 Muirlands Blvd #28 | 0.07mi | 2/2.0 | 1,440 (0%) | 1mo | $170,000 | $118 | 96 |
| 24921 Muirlands #13 | 0.14mi | 2/2.0 | 1,440 (0%) | 4mo | $175,000 | $122 | 90 |
| 24921 Muirlands Blvd #303 | 0.00mi | 2/2.0 | 1,440 (0%) | 12mo | $240,000 | $167 | 90 |
| 24921 Muirlands Blvd Spc 114 | 0.07mi | 2/2.0 | 1,440 (0%) | 10mo | $207,000 | $144 | 88 |
| 24921 Muirlands Blvd #23 | 0.14mi | 2/2.0 | 1,488 (+3%) | 2mo | $199,000 | $134 | 86 |
| 24921 Muirlands Blvd #113 | 0.07mi | 2/2.0 | 1,440 (0%) | 13mo | $205,000 | $142 | 86 |
| 24921 Muirlands blvd #78 | 0.07mi | 2/2.0 | 1,570 (+9%) | 3mo | $224,000 | $143 | 79 |
| 24701 Raymond Way #39 | 0.54mi | 2/2.0 | 1,440 (0%) | 5mo | $202,500 | $141 | 71 |
| 24921 Muirlands Blvd #188 | 0.14mi | 2/2.0 | 1,600 (+11%) | 13mo | $299,000 | $187 | 64 |
| 24701 Raymond Ave #120 | 0.42mi | 3/2.0 (+1) | 1,608 (+12%) | 2mo | $375,000 | $233 | 55 |
Match score weights: distance 35% · size 25% · config 20% · recency 20%. Top-matched comps best support the ARV.
Projected returns pro-forma
-3.0% appreciation · 2.51% rent growth · sell at horizon
- IRR
- 20.7%
- Equity multiple
- 1.84×
- Total profit
- $46,645
- Equity at exit
- $29,672
- IRR
- 28.5%
- Equity multiple
- 3.47×
- Total profit
- $137,795
- Equity at exit
- $17,206
Cash invested: $55,720 (down + closing). Projections, not guarantees.
Landlord ↔ Tenant lean methodology
- Overall (STATE)
- 18 Strongly Tenant-Friendly
- State California
- 18 Strongly Tenant-Friendly · D+13
- County
- — inherits STATE
- City
- — inherits STATE
ZIP-level market 92630
- Rents YoY
- 2.5%
- Active inventory
- 205
- Price-to-rent
- 5.0×
Monthly cashflow live
- Estimated rent
- $3,340 high interval (Pro) →
- Mortgage (P&I)
- −$1,044
- Tax est. 1.5%
- −$249 /mo · $2,985/yr
- Insurance
- −$83
- HOA
- −$0
- Vacancy / Maint / Mgmt
- −$701
- Net cashflow
- $1,264
Break-even live
UW: 25.0% down · 7.5% · 30yr · 1.5% tax · 5.0% vac · 8.0% maint · 8.0% mgmt
Financing live
Cash to close
- Down payment
- $49,750
- Closing costs
- $5,970
- Reserves months
- —
- Total cash needed
- —
Loan-product check · same deal, 3 products live
Conventional
25% down · 7.5% · 30yr
- Down + closing
- —
- Monthly P&I
- —
- Monthly cashflow
- —
- DSCR
- —
- Eligible?
- —
Personal DTI + credit; lowest rate.
DSCR
20% down · 8.5% · 30yr
- Down + closing
- —
- Monthly P&I
- —
- Monthly cashflow
- —
- DSCR
- —
- Eligible?
- —
No personal income docs; deal must DSCR.
Hard money
10% down · 12.0% · 12mo
- Down + closing
- —
- Monthly P&I
- —
- Monthly cashflow
- —
- DSCR
- —
- Eligible?
- —
Short-term bridge; refi at stabilization.
Rent comps 38 comps
| Address | Beds | Baths | Sqft | Rent | $/sqft | DOM | Units | Dist |
|---|---|---|---|---|---|---|---|---|
| 23250 Orange Ave Lake Forest, CA | 2.0 | 2.0 | 947 | $2,995 | $3.16 | 24d | 1 | 0.16mi |
| 25092 Farthing St Lake Forest, CA | 1.0–2.0 | 1.0–2.0 | 881 | $3,303 | $3.75 | 3d | 5 | 0.47mi |
| 6 Quinn Way Mission Viejo, CA | 3.0 | 3.5 | 1716 | $4,100 | $2.39 | 20d | 1 | 0.61mi |
| 62 Aliso Ridge Loop Mission Viejo, CA | 2.0 | 2.5 | 1560 | $3,795 | $2.43 | 24d | 1 | 0.62mi |
| 23151 Los Alisos Blvd Mission Viejo, CA | 1.0–3.0 | 1.0–2.0 | 1091 | $2,654 | $2.43 | 2d | 1 | 0.74mi |
| 24621 Overlake Dr Lake Forest, CA | 3.0 | 2.0 | 1677 | $4,350 | $2.59 | 24d | 1 | 0.84mi |
| 22835 Islamare Ln Lake Forest, CA | 3.0 | 2.5 | 1860 | $6,600 | $3.55 | 12d | 1 | 1.01mi |
| 26075 Las Flores Unit b Mission Viejo, CA | 2.0 | 1.5 | 989 | $3,200 | $3.24 | 15d | 1 | 1.03mi |
| 24241 Swiftriver Ct Lake Forest, CA | 1.0 | 1.5 | 905 | $2,850 | $3.15 | 43d | 1 | 1.05mi |
| 24246 Swiftriver Ct Lake Forest, CA | 1.0 | 1.5 | 905 | $2,750 | $3.04 | 24d | 1 | 1.05mi |
| 26037 Via Pera Unit K4 Mission Viejo, CA | 2.0 | 1.0 | 932 | $3,387 | $3.63 | 43d | 1 | 1.06mi |
| 24391 Avenida de la Carlota Laguna Hills, CA | 1.0–2.0 | 1.0–2.0 | 957 | $3,965 | $4.14 | 1d | 18 | 1.10mi |
| 22602 Cottonwood Cir Lake Forest, CA | 3.0 | 2.0 | 1301 | $4,250 | $3.27 | 43d | 1 | 1.10mi |
| 22892 Plainview Cir Lake Forest, CA | 3.0 | 2.0 | 1836 | $5,400 | $2.94 | 43d | 1 | 1.11mi |
| 26191 Sanz Unit D Mission Viejo, CA | 2.0 | 2.5 | 1000 | $3,250 | $3.25 | 20d | 1 | 1.17mi |
| 23333 Ridge Route Dr Lake Forest, CA | 1.0–2.0 | 1.0–2.0 | 892 | $3,100 | $3.47 | 2d | 9 | 1.23mi |
| 24555 Los Alisos Blvd Laguna Hills, CA | 2.0 | 2.0 | 1014 | $3,250 | $3.21 | 15d | 1 | 1.26mi |
| 24555 Los Alisos Blvd Laguna Hills, CA | 2.0 | 2.0 | 1007 | $3,356 | $3.33 | 43d | 1 | 1.26mi |
| 22700 Lake Forest Dr Lake Forest, CA | 1.0–3.0 | 1.0–2.0 | 1008 | $3,248 | $3.22 | 4d | 1 | 1.27mi |
| 25885 Trabuco Rd #98 Lake Forest, CA | 2.0 | 1.5 | 1190 | $3,300 | $2.77 | 11d | 1 | 1.33mi |
| 132 Avenida Majorca Unit B Laguna Woods, CA | 2.0 | 1.0 | 995 | $2,400 | $2.41 | 6d | 1 | 1.34mi |
| 24151 El Tiradore Cir Mission Viejo, CA | 1.0 | 1.0 | 1050 | $2,550 | $2.43 | 4d | 1 | 1.36mi |
| 158 Avenida Majorca Unit D Laguna Woods, CA | 2.0 | 1.0 | 1300 | $3,200 | $2.46 | 43d | 1 | 1.37mi |
| 25885 Trabuco Rd #235 Lake Forest, CA | 2.0 | 1.5 | 1190 | $2,980 | $2.50 | 24d | 1 | 1.41mi |
| 169 Avenida Majorca Unit B Laguna Woods, CA | 3.0 | 1.0 | 1200 | $1,400 | $1.17 | 43d | 1 | 1.43mi |
| 22159 Rimhurst Dr Lake Forest, CA | 1.0–2.0 | 1.0–2.0 | 820 | $2,880 | $3.51 | 1d | 2 | 1.43mi |
| 170 Avenida Majorca Unit D Laguna Woods, CA | 2.0 | 1.0 | 1000 | $2,500 | $2.50 | 24d | 1 | 1.43mi |
| 24299 Paseo De Valencia Laguna Woods, CA | 2.0 | 2.0 | 1347 | $3,770 | $2.80 | 22d | 7 | 1.45mi |
| 2022 Via Mariposa E Unit B Laguna Woods, CA | 2.0 | 2.0 | 1325 | $3,200 | $2.42 | 18d | 1 | 1.45mi |
| 2369 Via Mariposa E Unit 3H Laguna Woods, CA | 3.0 | 3.0 | 1663 | $3,750 | $2.25 | 43d | 1 | 1.45mi |
| 2369 Via Mariposa E Unit 1B Laguna Woods, CA | 2.0 | 2.0 | 1340 | $2,950 | $2.20 | 43d | 1 | 1.45mi |
| 2269 Via Puerta Unit N Laguna Woods, CA | 2.0 | 2.0 | 1057 | $2,700 | $2.55 | 18d | 1 | 1.46mi |
| 254 Calle Aragon Unit D Laguna Woods, CA | 2.0 | 2.0 | 1009 | $3,000 | $2.97 | 17d | 1 | 1.47mi |
| 205 Avenida Majorca Unit A Laguna Woods, CA | 2.0 | 2.0 | 1278 | $3,600 | $2.82 | 43d | 1 | 1.48mi |
| 2293 Via Puerta Unit O Laguna Woods, CA | 2.0 | 2.0 | 1057 | $3,100 | $2.93 | 18d | 1 | 1.49mi |
| 74 Calle Aragon Unit A Laguna Woods, CA | 2.0 | 1.0 | 950 | $2,700 | $2.84 | 24d | 1 | 1.49mi |
| 969 Calle Aragon Unit 1B Laguna Woods, CA | 2.0 | 2.0 | 1195 | $2,900 | $2.43 | 24d | 1 | 1.50mi |
| 2022 Via Mariposa E Unit D Laguna Woods, CA | 2.0 | 2.0 | 1305 | $4,000 | $3.07 | 43d | 1 | 1.50mi |
Listing history 21 events
-
2026-06-18days on market $199,000 Active 43 DOM
-
2026-06-17days on market $199,000 Active 42 DOM
-
2026-06-16days on market $199,000 Active 41 DOM
-
2026-06-15days on market $199,000 Active 40 DOM
-
2026-06-13days on market $199,000 Active 38 DOM
-
2026-06-13days on market $199,000 Active 37 DOM
-
2026-06-09days on market $199,000 Active 34 DOM
-
2026-06-08days on market $199,000 Active 33 DOM
-
2026-06-07days on market $199,000 Active 32 DOM
-
2026-06-04days on market $199,000 Active 29 DOM
-
2026-06-03days on market $199,000 Active 28 DOM
-
2026-06-02days on market $199,000 Active 27 DOM
-
2026-06-01days on market $199,000 Active 26 DOM
-
2026-05-31days on market $199,000 Active 25 DOM
-
2026-05-14status Active 782-char remark
-
2026-05-10status Active Under Contract 782-char remark
-
2026-05-04$199,000 Active 782-char remark
-
2009-07-02soldstatus $46,000 Closed Sale 187-char remark
Show marketing remark (187 chars)
Tropical Dream On Golf Course 2 Bed 2 Bath Living And Family Room Tub And Shower In Master Big Open Kitchen With Breakfast Bar Gas Cooking Appliances Included-Disability Access:None (N)
-
2009-06-09historical 187-char remark
Show marketing remark (187 chars)
Tropical Dream On Golf Course 2 Bed 2 Bath Living And Family Room Tub And Shower In Master Big Open Kitchen With Breakfast Bar Gas Cooking Appliances Included-Disability Access:None (N)
-
2009-06-01price $49,000 187-char remark
Show marketing remark (187 chars)
Tropical Dream On Golf Course 2 Bed 2 Bath Living And Family Room Tub And Shower In Master Big Open Kitchen With Breakfast Bar Gas Cooking Appliances Included-Disability Access:None (N)
-
2009-02-13$56,000 187-char remark
Show marketing remark (187 chars)
Tropical Dream On Golf Course 2 Bed 2 Bath Living And Family Room Tub And Shower In Master Big Open Kitchen With Breakfast Bar Gas Cooking Appliances Included-Disability Access:None (N)
ⓘ Source: listings_history table (triggers on properties + properties_extension) + one-shot
backfill from property_details.listing_events for pre-trigger history.
Climate risk First Street
- Flood 1/10 Low FEMA zone X (unshaded) · 0% chance over 30 yrs
- Wildfire 1/10 Low
- Heat 5/10 Major 7 d/yr ≥91°F today · 22 d/yr by 30 yrs out
- Wind 1/10 Low
- Air quality 4/10 Moderate 4 unhealthy d/yr today · 5 by 30 yrs out
Nearby sold comps map
Loading sold comps map…
Walkable amenities ~0.75 mi
Loading nearby amenities…
Taxation est. · year 1
- Rental income
- $40,084
- − Mortgage interest
- −$11,147
- − Property taxes
- −$2,985
- − Insurance
- −$995
- − Repairs & maintenance
- −$3,207
- − Management
- −$3,207
- − Depreciation
- −$5,789
- Taxable income
- $12,754
- Est. tax owed @ 24.0%
- −$3,061
- After-tax cash flow
- $12,102/yr
For passive investors: Depreciation is non-cash, so a rental often shows a tax loss while cash-flowing — sheltering income. Rental losses are passive: they offset passive income freely, and up to $25,000/yr can offset ordinary (W-2) income if you actively participate and your MAGI is under $100k (phasing out to $0 by $150k); unused losses carry forward. On sale, claimed depreciation is recaptured at up to 25%, and gains may owe capital-gains tax (a 1031 exchange can defer both). Figures are a year-1 estimate at your 24.0% rate — not tax advice; consult a CPA.
Schools (NCES district)
- District
- Saddleback Valley Unified
- NCES district ID
- 0633860
- Math proficiency
- 51% ▼ -2.00%
- Reading proficiency
- 73% ▲ 9.00%
- Median HH income
- $85,577
- Composite
- 56.05/100
- National rank
- #1185
- State rank
- #67 of 517 in CA
Livability — Lake Forest
- Score
- 65/100
- State rank
- #387
- US rank
- #13130
Category grades
Schools grade is shown separately in the Schools card above.
Census & demographics
- Census place
- Lake Forest, CA
- County
- Orange County · 3,096,323 people
- City population
- 80,019
- Metro
- Los Angeles-Long Beach-Anaheim, CA
- Population (ZIP)
- 67,152
- Household income
- $125,853
- Rent vs Own
- Severe rent burden
- 2412.0
Population outlook (Orange County) Hauer SSP2
- Today (2025)
- 3,477,456 people
- By 2030
- 3,613,117 · +3.9%
- By 2040
- 3,835,945 · +10.3%
- By 2050
- 3,968,736 · +14.1%
- By 2075
- 4,097,053 · +17.8%
- By 2100
- 3,903,633 · +12.3%
Race, ethnicity, and origin ACS 2023
- Neighborhood character
- Diverse neighborhood (Simpson 0.67)
- Race & ethnicity
- White 47% Hispanic / Latino 27% Asian 19% Two or more races 16% Black 2% Native American 1%
- Hispanic origin (detail)
- Mexican 21%
- Common ancestry
- Slovak 2% Lithuanian 2% Romanian 2%
- Foreign-born
- 28% · Canada, China, Vietnam
- Languages at home
- 62% English-only · Spanish 18% Chinese 4% Other Indo-European 4%
Political lean MEDSL · Orange
- 2024 margin
- Toss-up / Even · D 49.7% · R 47.1% · Other 3.2%
- 2008→2024 swing
- +5.2pp toward D · 2008: -2.6pp · 2024: 2.6pp
- All cycles
- 2024: D+2.6 2020: D+9.0 2016: D+7.7 2012: R+8.3 2008: R+2.6
Not yet ingested
- Civics
- —
Market trends
- HPI YoY
- ▼ -866.99%
- Current HPI
- 436.6189
- Rent YoY
- ▲ 2.51%
- Metro
- Los Angeles-Long Beach-Anaheim, CA
- State GDP YoY
- ▲ 3.21%
- F500 in state
- 116
Industry mix (Fortune 500 HQ in CA)
| Industry | F500 HQs | Revenue |
|---|---|---|
| Technology | 27 | $1,492B |
|
||
| Financial Services | 3 | $174B |
|
||
| Retail | 3 | $44B |
|
||
| Insurance | 3 | $26B |
|
||
| Media / Entertainment | 2 | $115B |
|
||
| Pharmaceuticals / Biotech | 2 | $62B |
|
||
Price history
+255.4% since first listed7 events — show timeline
- 2026-05-14 Relisted — CRMLS
- 2026-05-10 Relisted — CRMLS
- 2026-05-04 Listed $199,000 CRMLS
- 2009-07-02 Sold (MLS) $46,000 CRMLS
- 2009-06-09 Listing Removed — CRMLS
- 2009-06-01 Price Changed $49,000 CRMLS
- 2009-02-13 Listed $56,000 CRMLS
Property tax history
-6.1%/yrLatest (2025): $17 · -0.1% YoY. Source: county tax records.
Cash-flow waterfall
monthlySold comps — $/sqft
last 12 mo · ≤1 miLoading sold comps…