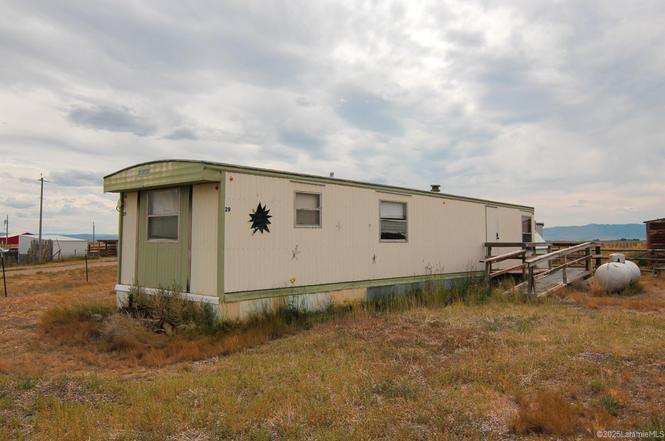
29 Star Struck Ln · Laramie, WY
Flood risk 1/10 · Minimal
- FEMA flood zone
- X (unshaded)
- Chance of flooding over 30 yrs
- 0.0%
- Est. flood insurance / yr
- $507 – $1,088
Fire risk 7/10 · Major
- Est. fire insurance / yr
- $564 – $1,046
Heat risk 1/10 · Minimal
- Hot days now (above 84°F)
- 7 days/yr
- Hot days in 30 yrs
- 17 days/yr
Wind risk 1/10 · Minimal
- Chance of severe wind over 30 yrs
- —
Air-quality risk 5/10 · Moderate
- Unhealthy air days now
- 7 days/yr
- Unhealthy air days in 30 yrs
- 9 days/yr
Risk factors via First Street. Map © Google.
Why this score? — see what drove the D+ grade
The composite is a weighted blend of 9 inputs, each scored 0–100. Each bar is that input's sub-score; the figure is the points it added to the 100-point composite (weight × sub-score).
- Cash flow +15.0/30.0
- ARV discount +7.5/15.0
- 1% rule +5.0/10.0
- DSCR +5.0/10.0
- Schools +4.6/10.0
- Livability +3.7/5.0
- Rent growth +3.1/5.0
- Condition / age +2.5/5.0
- Appreciation +0.0/10.0
$8,500
🖨 Deal sheet 📄 Offer letter ✓ Due diligence
Key facts
- New water heater
- Built 1973
- Listed 323 days
Tags
Property features AI
Exterior
- Utilities: Natural gas available
- Home design: Residential mobile home; Zoned for limited multi-family with manufactured homes
- Construction: Metal siding
- Exterior features: Metal roof
Interior
- Kitchen: Gas range; Microwave; Refrigerator; Water purifier
- Heating & cooling: Forced air heating; Has heating
- Interior features: Eat-in kitchen
- Laundry & utility: Electric dryer hookup
Neighborhood map
What this means for you Summary
Snapshot
- This is a 2-bed/1.0-bath manufactured listed at $8k.
Deal economics
- At list price, monthly cash flow is $785 ($9k/yr) — positive.
- The deal already cash-flows at list — no discount required.
- Meets the 1% rule at list price ($1k rent vs $8k).
- Recommended offer: $7k (12.0% below list) — sets the bar for market timing.
- Cap rate 117.2% vs local median 2.3% in Laramie — top-decile yield for the area; either an underpriced asset or a hidden risk that comps aren't pricing in. Stress-test before assuming the spread holds.
Location & tenants
- Location reads 73/100 on livability (#23 in WY) — a middle-class / working-renter tenant base. Strengths: cost of living A+, crime A, amenities A-; Watch: employment D+, commute F.
- Albany County School District #1 (town): math 51% / reading 59% proficiency, ranked #19 of 41 in WY (top 46%) — acceptable for families but not a draw, mixed tenant base, ~2y average lease.
- Market conditions: Rents rising (+2.2%/yr); 275 active listings in the ZIP; 99 units permitted in Albany County in 2024 (0 in 5+ unit buildings).
Forward outlook
- Local home prices are declining (-3.0%/yr); year-one equity from $59 of loan paydown is wiped out by about $255 of value loss. Plan a longer hold.
- Albany County population projected at +39% by 2050 — long-run rental-demand tailwind backs the buy-and-hold thesis.
- At projected returns (-3.0% appreciation + 2.2% rent growth), your $2k cash investment doubles in ~1 year — after that, you're playing with house money.
Negotiation context
- It's been on market 324 days — a 12% lower offer ($7k) is reasonable based on typical stale-listing flexibility.
Risks & watch-outs
- Climate carrying-cost: major wildfire risk — expect insurance premiums to compound above CPI over the hold.
Questions for the listing agent
- It's been on market 324 days. Have you received any prior offers? Is the seller open to a 12% concession, seller financing, or rate buy-down credit?
- Built in 1973 — when were the roof, HVAC, electrical panel, plumbing, and water heater last replaced?
- Why hasn't it sold? Are there any deal-killer items the seller is aware of (foundation, flood, title, zoning, code violations)?
- Is there a deadline driving the sale (1031 exchange, divorce, estate, relocation)? That informs how much negotiation room exists.
- Schools are B-rated — typically a magnet for longer-tenancy family renters. What's the average tenant stay here, and is there a school-zone premium baked into asking?
- The area grade is low — what's the realistic commute time and amenity access for the typical tenant pool here? Any planned neighborhood developments (good or bad) we should know about?
- What's the average days-on-market for RENTAL listings here right now (not sales)? A rising rental-DOM trend means longer vacancies and softer asking-rent achievability than the comps imply.
- What's the recent tenant-quality profile in this submarket — average credit score on applications, eviction rate, late-payment / NSF rate, and stable-employment percentage? A property-management company in the area should have these aggregated.
- How much new for-sale + rental construction is in the pipeline within 1–3 miles? Heavy new supply typically softens prices + rents 12–24 months out; constrained supply supports both.
Investment metrics
- 1% rule
- 12.57% ✓
- Cap rate
- 117.16%
- Cash-on-cash
- 395.97%
- DSCR
- 18.62
- GRM
- 0.7
CMA / ARV
No comps found within radius.
Projected returns pro-forma
-3.0% appreciation · 2.21% rent growth · sell at horizon
- IRR
- —
- Equity multiple
- 21.09×
- Total profit
- $47,815
- Equity at exit
- $1,267
- IRR
- —
- Equity multiple
- 44.15×
- Total profit
- $102,706
- Equity at exit
- $735
Cash invested: $2,380 (down + closing). Projections, not guarantees.
Landlord ↔ Tenant lean methodology
- Overall (STATE)
- 90 Strongly Landlord-Friendly
- State Wyoming
- 90 Strongly Landlord-Friendly · R+25
- County
- — inherits STATE
- City
- — inherits STATE
ZIP-level market 82070
- Rents YoY
- 2.2%
- Active inventory
- 275
- Price-to-rent
- 0.7×
Monthly cashflow live
- Estimated rent
- $1,068 medium interval (Pro) →
- Mortgage (P&I)
- −$45
- Tax est. 1.5%
- −$11 /mo · $128/yr
- Insurance
- −$4
- HOA
- −$0
- Vacancy / Maint / Mgmt
- −$224
- Net cashflow
- $785
Break-even live
UW: 25.0% down · 7.5% · 30yr · 1.5% tax · 5.0% vac · 8.0% maint · 8.0% mgmt
Financing live
Cash to close
- Down payment
- $2,125
- Closing costs
- $255
- Reserves months
- —
- Total cash needed
- —
Loan-product check · same deal, 3 products live
Conventional
25% down · 7.5% · 30yr
- Down + closing
- —
- Monthly P&I
- —
- Monthly cashflow
- —
- DSCR
- —
- Eligible?
- —
Personal DTI + credit; lowest rate.
DSCR
20% down · 8.5% · 30yr
- Down + closing
- —
- Monthly P&I
- —
- Monthly cashflow
- —
- DSCR
- —
- Eligible?
- —
No personal income docs; deal must DSCR.
Hard money
10% down · 12.0% · 12mo
- Down + closing
- —
- Monthly P&I
- —
- Monthly cashflow
- —
- DSCR
- —
- Eligible?
- —
Short-term bridge; refi at stabilization.
Listing history 17 events
-
2026-06-19days on market $8,500 Active 324 DOM
-
2026-06-18days on market $8,500 Active 323 DOM
-
2026-06-17days on market $8,500 Active 322 DOM
-
2026-06-16days on market $8,500 Active 321 DOM
-
2026-06-15days on market $8,500 Active 320 DOM
-
2026-06-14days on market $8,500 Active 318 DOM
-
2026-06-12days on market $8,500 Active 317 DOM
-
2026-06-09days on market $8,500 Active 314 DOM
-
2026-06-08days on market $8,500 Active 313 DOM
-
2026-06-07days on market $8,500 Active 312 DOM
-
2026-06-05days on market $8,500 Active 309 DOM
-
2026-06-03days on market $8,500 Active 308 DOM
-
2026-06-02days on market $8,500 Active 307 DOM
-
2026-06-01days on market $8,500 Active 306 DOM
-
2026-05-31days on market $8,500 Active 305 DOM
-
2026-05-30days on market $8,500 Active 304 DOM
-
2025-07-30$8,500 Active
ⓘ Source: listings_history table (triggers on properties + properties_extension) + one-shot
backfill from property_details.listing_events for pre-trigger history.
Climate risk First Street
- Flood 1/10 Low FEMA zone X (unshaded) · 0% chance over 30 yrs
- Wildfire 7/10 Severe
- Heat 1/10 Low 7 d/yr ≥84°F today · 17 d/yr by 30 yrs out
- Wind 1/10 Low
- Air quality 5/10 Major 7 unhealthy d/yr today · 9 by 30 yrs out
Nearby sold comps map
Loading sold comps map…
Walkable amenities ~0.75 mi
Loading nearby amenities…
Taxation est. · year 1
- Rental income
- $12,822
- − Mortgage interest
- −$476
- − Property taxes
- −$128
- − Insurance
- −$42
- − Repairs & maintenance
- −$1,026
- − Management
- −$1,026
- − Depreciation
- −$247
- Taxable income
- $9,877
- Est. tax owed @ 24.0%
- −$2,370
- After-tax cash flow
- $7,054/yr
For passive investors: Depreciation is non-cash, so a rental often shows a tax loss while cash-flowing — sheltering income. Rental losses are passive: they offset passive income freely, and up to $25,000/yr can offset ordinary (W-2) income if you actively participate and your MAGI is under $100k (phasing out to $0 by $150k); unused losses carry forward. On sale, claimed depreciation is recaptured at up to 25%, and gains may owe capital-gains tax (a 1031 exchange can defer both). Figures are a year-1 estimate at your 24.0% rate — not tax advice; consult a CPA.
Schools (NCES district)
- District
- Albany County School District #1
- NCES district ID
- 5600730
- Math proficiency
- 51% ▼ -11.00%
- Reading proficiency
- 59% ▼ -4.00%
- Median HH income
- $43,169
- Composite
- 46.25/100
- National rank
- #2485
- State rank
- #19 of 41 in WY
Livability — Laramie
- Score
- 73/100
- State rank
- #23
- US rank
- #5539
Category grades
Schools grade is shown separately in the Schools card above.
Census & demographics
- Census place
- Laramie, WY
- County
- Albany County · 37,075 people
- City population
- 37,075
- Metro
- Laramie, WY
- Population (ZIP)
- 20,144
- Household income
- $69,095
- Rent vs Own
- Severe rent burden
- 974.0
Population outlook (Albany County) Hauer SSP2
- Today (2025)
- 43,687 people
- By 2030
- 46,862 · +7.3%
- By 2040
- 53,248 · +21.9%
- By 2050
- 60,547 · +38.6%
- By 2075
- 82,326 · +88.4%
- By 2100
- 102,008 · +133.5%
Race, ethnicity, and origin ACS 2023
- Neighborhood character
- Predominantly White (80%)
- Race & ethnicity
- White 80% Hispanic / Latino 11% Two or more races 7% Asian 2% Native American 2% Black 1%
- Hispanic origin (detail)
- Mexican 6% Puerto Rican 1%
- Common ancestry
- Portuguese 6% Slovak 4% Lithuanian 2%
- Foreign-born
- 6% · Canada, China
- Languages at home
- 90% English-only · Spanish 4% Russian/Polish/Slavic 2% Other Asian/Pacific 1%
Political lean MEDSL · Albany
- 2024 margin
- Toss-up / Even · D 47.5% · R 50.6% · Other 1.9%
- 2008→2024 swing
- -7.3pp toward R · 2008: 4.1pp · 2024: -3.2pp
- All cycles
- 2024: R+3.2 2020: D+2.8 2016: R+4.3 2012: R+2.5 2008: D+4.1
Not yet ingested
- Civics
- —
Market trends
- HPI YoY
- ▼ -396.34%
- Current HPI
- 193.777
- Rent YoY
- ▲ 2.21%
- Metro
- Laramie, WY
- State GDP YoY
- —
- F500 in state
- 0
Price history
1 event — show timeline
- 2025-07-30 Listed $8,500 LBOR
Cash-flow waterfall
monthlySold comps — $/sqft
last 12 mo · ≤1 miLoading sold comps…