3733 Noah St · Houston, TX
Flood risk 4/10 · Minor
- FEMA flood zone
- X (unshaded)
- Chance of flooding over 30 yrs
- 0.21%
- Est. flood insurance / yr
- $507 – $1,088
Fire risk 1/10 · Minimal
- Est. fire insurance / yr
- $1,222 – $2,270
Heat risk 9/10 · Severe
- Hot days now (above 109°F)
- 7 days/yr
- Hot days in 30 yrs
- 22 days/yr
Wind risk 9/10 · Severe
- Chance of severe wind over 30 yrs
- 99.0%
Air-quality risk 2/10 · Minimal
- Unhealthy air days now
- 2 days/yr
- Unhealthy air days in 30 yrs
- 2 days/yr
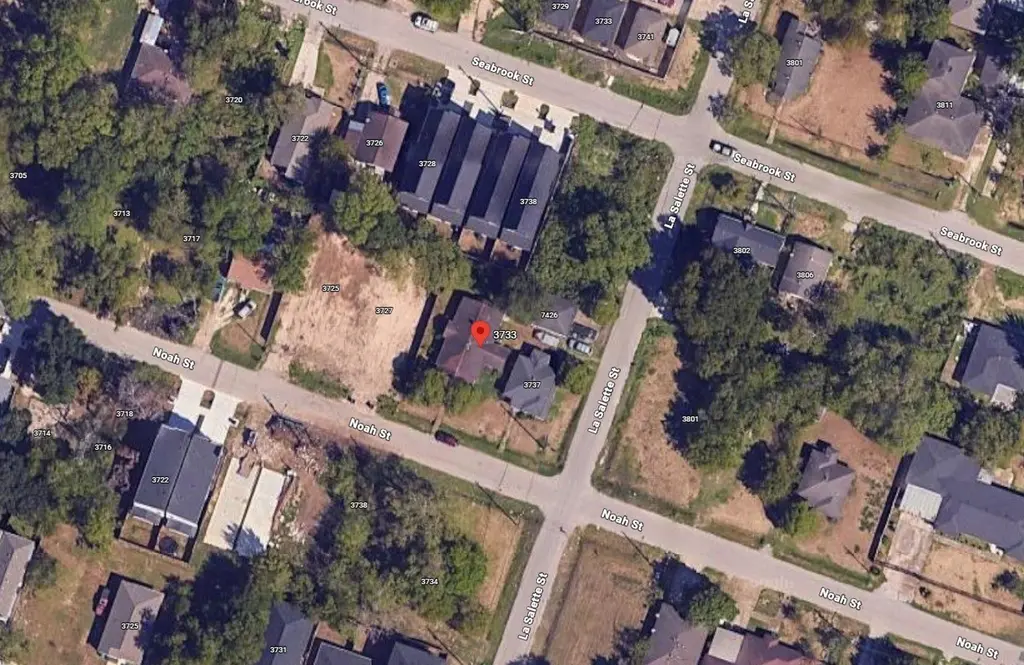
Risk factors via First Street. Map © Google.
Why this score? — see what drove the D grade
The composite is a weighted blend of 9 inputs, each scored 0–100. Each bar is that input's sub-score; the figure is the points it added to the 100-point composite (weight × sub-score).
- ARV discount +15.0/15.0
- Cash flow +8.3/30.0
- Livability +3.7/5.0
- 1% rule +3.4/10.0
- Rent growth +3.0/5.0
- Schools +2.7/10.0
- Condition / age +2.5/5.0
- DSCR +2.3/10.0
- Appreciation +0.0/10.0
$275,000
🖨 Deal sheet (PDF) 📄 Offer letter ✓ Due diligence
Listing remarks MLS
10,000 square foot corner lot ideal lot for new construction. The property contains two stuctures, 3733 & 3737 Noah, and is being sold for lot value. The neighborhood is established and brand new construction all around. Property is being sold as-is. Close proximity to Texas Medical Center Helix Park and Levit Green. Quick commute to NRG, Museum District and Downtown Houston.
Key facts
- Quick commute to nrg
- Two structures
- Corner lot
Tags
Neighborhood map
What this means for you Summary
Snapshot
- This is a 3-bed/1.5-bath single-family listed at $275k.
Deal economics
- At list price, monthly cash flow is $-250 ($-3k/yr) — negative.
- To cash-flow at today's rent, offer at most $231k (16.0% below list).
- To meet the 1% rule (rent ≥ 1% of price), the offer needs to be $232k (15.5% below list).
- Recommended offer: $231k (16.0% below list) — sets the bar for cash-flow.
- Cap rate 5.2% vs local median 3.2% in Houston — top-decile yield for the area; either an underpriced asset or a hidden risk that comps aren't pricing in. Stress-test before assuming the spread holds.
Location & tenants
- Location reads 74/100 on livability (#184 in TX, #4,771 nationally) — a middle-class / working-renter tenant base. Strengths: amenities A+, cost of living A+, housing A+; Watch: schools D, crime F.
- Houston ISD (urban): math 27% / reading 35% proficiency, ranked #593 of 826 in TX (top 72%) — families likely to look elsewhere, expect single-tenant / working-renter base with shorter leases; 71% free/reduced lunch — lower-income household profile, screen leases tightly.
- Market conditions: Rents rising (+2.2%/yr); 471 active listings in the ZIP; 40 comparable units currently listed for rent nearby; rentals at typical pace (median 22d on market — plan ~3-4 weeks tenant-placement turnaround); 29,883 units permitted in Harris County in 2024 (8,621 in 5+ unit buildings).
- At $2,324/mo this rent would consume 61% of the median local household income ($46k/yr) (locally 2532% of renters already pay >50% of income on rent) — very limited rent-growth headroom before tenants either downsize or default.
Forward outlook
- Local home prices are declining (-3.0%/yr); year-one equity from $2k of loan paydown is wiped out by about $8k of value loss. Plan a longer hold.
- Harris County population projected at +47% by 2050 — long-run rental-demand tailwind backs the buy-and-hold thesis.
Negotiation context
- It's been on market 240 days — a 12% lower offer ($242k) is reasonable based on typical stale-listing flexibility.
Risks & watch-outs
- Watch-outs: built in 1955 — expect roof / HVAC / electrical / plumbing capex.
- Climate carrying-cost: severe wind risk, 99% chance of damaging wind over 30y; extreme-heat days projected 7→22/yr by 2055 (HVAC capex compounding) — expect insurance premiums to compound above CPI over the hold.
Questions for the listing agent
- What do current leases actually rent for vs. the listed asking? Can we see a recent rent roll and the last 12 months of T-12 income?
- It's been on market 240 days. Have you received any prior offers? Is the seller open to a 16% concession, seller financing, or rate buy-down credit?
- Built in 1955 — when were the roof, HVAC, electrical panel, plumbing, and water heater last replaced?
- Why hasn't it sold? Are there any deal-killer items the seller is aware of (foundation, flood, title, zoning, code violations)?
- Is there a deadline driving the sale (1031 exchange, divorce, estate, relocation)? That informs how much negotiation room exists.
- Schools are D-rated, which usually means shorter tenancies and higher turnover. Who's the typical renter profile here, and what's been the actual vacancy rate?
- Crime grade is F in this area — have there been break-ins, vandalism, or insurance claims at this property in the last 3 years? What carrier currently insures it and at what premium?
- The area grade is low — what's the realistic commute time and amenity access for the typical tenant pool here? Any planned neighborhood developments (good or bad) we should know about?
- What's the average days-on-market for RENTAL listings here right now (not sales)? A rising rental-DOM trend means longer vacancies and softer asking-rent achievability than the comps imply.
- What's the recent tenant-quality profile in this submarket — average credit score on applications, eviction rate, late-payment / NSF rate, and stable-employment percentage? A property-management company in the area should have these aggregated.
- How much new for-sale + rental construction is in the pipeline within 1–3 miles? Heavy new supply typically softens prices + rents 12–24 months out; constrained supply supports both.
Investment metrics
- 1% rule
- 0.84% ✗
- Cap rate
- 5.20%
- Cash-on-cash
- -3.89%
- DSCR
- 0.83
- GRM
- 9.9
CMA / ARV
- ARV (median comp)
- $367,670
- List price
- $275,000
- Delta
- -25.20%
- Verdict
- UNDERPRICED
- Comps
- 20 within 1.0 mi
Show comp detail 12 sales within ~0.75 mi
| Address | Dist | Beds/Ba | Sqft | Sold | Price | $/sf | Match |
|---|---|---|---|---|---|---|---|
| 3802 Rebecca St | 0.23mi | 3/2.0 | 1,348 (-12%) | 4mo | $189,000 | $140 | 63 |
| 3515 Lydia St | 0.38mi | 3/2.0 | 1,390 (-10%) | 4mo | $220,000 | $158 | 61 |
| 4211 Faulkner St | 0.56mi | 3/2.5 | 1,610 (+5%) | 3mo | $274,900 | $171 | 60 |
| 6906 England St | 0.66mi | 3/2.5 | 1,600 (+4%) | 4mo | $309,900 | $194 | 55 |
| 6908 England St | 0.66mi | 3/2.5 | 1,600 (+4%) | 5mo | $309,900 | $194 | 54 |
| 3536 Rebecca St | 0.38mi | 3/2.5 | 1,332 (-14%) | 4mo | $240,000 | $180 | 53 |
| 7117 England St Unit C | 0.55mi | 3/2.5 | 1,700 (+10%) | 1mo | $340,000 | $200 | 52 |
| 6904 England St | 0.67mi | 3/2.5 | 1,600 (+4%) | 7mo | $329,900 | $206 | 52 |
| 7117 England St Unit B | 0.55mi | 3/2.5 | 1,700 (+10%) | 5mo | $359,900 | $212 | 48 |
| 7117 England St Unit A | 0.56mi | 3/2.5 | 1,700 (+10%) | 5mo | $359,900 | $212 | 48 |
| 7205 England St | 0.51mi | 4/2.5 (+1) | 1,689 (+10%) | 7mo | $320,000 | $189 | 45 |
| 7131 Eastwood St Unit C | 0.72mi | 3/2.5 | 1,700 (+10%) | 6mo | $320,000 | $188 | 40 |
Match score weights: distance 35% · size 25% · config 20% · recency 20%. Top-matched comps best support the ARV.
Projected returns pro-forma
-3.0% appreciation · 2.17% rent growth · sell at horizon
- IRR
- -23.8%
- Equity multiple
- 0.19×
- Total profit
- $-62,245
- Equity at exit
- $41,003
- IRR
- -21.3%
- Equity multiple
- -0.06×
- Total profit
- $-81,846
- Equity at exit
- $23,777
Cash invested: $77,000 (down + closing). Projections, not guarantees.
Landlord ↔ Tenant lean methodology
- Overall (STATE)
- 87 Strongly Landlord-Friendly
- State Texas
- 87 Strongly Landlord-Friendly · R+5
- County
- — inherits STATE
- City
- — inherits STATE
ZIP-level market 77021
- Home prices YoY
- -23.6%
- Rents YoY
- 2.2%
- Active inventory
- 471
- Price-to-rent
- 9.9×
Monthly cashflow live
- Estimated rent
- $2,324 high interval (Pro) →
- Mortgage (P&I)
- −$1,442
- Tax from tax record
- −$529 /mo · $6,344/yr
- Insurance
- −$115
- HOA
- −$0
- Vacancy / Maint / Mgmt
- −$488
- Net cashflow
- $-250
Break-even live
Sensitivity live
| Price | -10% $-94 | -5% $-172 | +0% $-250 | +5% $-328 | +10% $-405 |
|---|---|---|---|---|---|
| Rent | -10% $-433 | -5% $-342 | +0% $-250 | +5% $-158 | +10% $-66 |
| Rate | -1.0pp $-111 | -0.5pp $-180 | base $-250 | +0.5pp $-321 | +1.0pp $-394 |
UW: 25.0% down · 7.5% · 30yr · 1.5% tax · 5.0% vac · 8.0% maint · 8.0% mgmt
Financing live
Cash to close
- Down payment
- $68,750
- Closing costs
- $8,250
- Reserves months
- —
- Total cash needed
- —
Loan-product check · same deal, 3 products live
Conventional
25% down · 7.5% · 30yr
- Down + closing
- —
- Monthly P&I
- —
- Monthly cashflow
- —
- DSCR
- —
- Eligible?
- —
Personal DTI + credit; lowest rate.
DSCR
20% down · 8.5% · 30yr
- Down + closing
- —
- Monthly P&I
- —
- Monthly cashflow
- —
- DSCR
- —
- Eligible?
- —
No personal income docs; deal must DSCR.
Hard money
10% down · 12.0% · 12mo
- Down + closing
- —
- Monthly P&I
- —
- Monthly cashflow
- —
- DSCR
- —
- Eligible?
- —
Short-term bridge; refi at stabilization.
Rent comps 40 comps
| Address | Beds | Baths | Sqft | Rent | $/sqft | DOM | Units | Dist |
|---|---|---|---|---|---|---|---|---|
| 3732 Seabrook St Houston, TX | 3.0 | 2.5 | 1727 | $2,350 | $1.36 | 25d | 1 | 0.02mi |
| 3655 Seabrook St Unit 6 Houston, TX | 2.0 | 1.0 | 1600 | $1,000 | $0.62 | 45d | 1 | 0.08mi |
| 3846 Seabrook St Houston, TX | 3.0 | 3.5 | 1833 | $2,300 | $1.25 | 45d | 1 | 0.13mi |
| 3615 Dreyfus St Houston, TX | 3.0 | 3.0 | 2011 | $2,800 | $1.39 | 45d | 1 | 0.26mi |
| 7507 Springhill St Houston, TX | 3.0 | 3.5 | 2000 | $4,500 | $2.25 | 45d | 1 | 0.39mi |
| 7321 Conley St Unit A Houston, TX | 3.0 | 2.5 | 1869 | $2,025 | $1.08 | 22d | 1 | 0.43mi |
| 7321 Conley St Unit B Houston, TX | 3.0 | 2.0 | 1501 | $2,025 | $1.35 | 22d | 1 | 0.43mi |
| 7806 Comal St Unit B Houston, TX | 3.0 | 2.5 | 1800 | $2,200 | $1.22 | 45d | 1 | 0.52mi |
| 7032 Conley St Houston, TX | 3.0 | 2.0 | 1220 | $2,850 | $2.34 | 45d | 1 | 0.52mi |
| 3402 Nathaniel Brown St Unit B Houston, TX | 3.0 | 2.5 | 1885 | $2,025 | $1.07 | 45d | 1 | 0.57mi |
| 3360 Alice St Unit 3174 Houston, TX | 3.0 | 2.0 | 1154 | $1,121 | $0.97 | 0d | 1 | 0.68mi |
| 3360 Alice St Unit 510 Houston, TX | 3.0 | 2.0 | 1154 | $1,172 | $1.02 | 13d | 1 | 0.68mi |
| 6809 Conley St Houston, TX | 3.0 | 4.0 | 1921 | $2,600 | $1.35 | 45d | 1 | 0.68mi |
| 3360 Alice St Unit 3047 Houston, TX | 3.0 | 2.0 | 1154 | $1,172 | $1.02 | 12d | 1 | 0.69mi |
| 8010 Livingston St Houston, TX | 3.0 | 2.0 | 1400 | $1,800 | $1.29 | 45d | 1 | 0.72mi |
| 7373 Ardmore St Houston, TX | 1.0–3.0 | 1.0–2.0 | 1095 | $1,887 | $1.72 | 6d | 24 | 0.83mi |
| 3088 Holly Hall St Unit 1 Houston, TX | 2.0 | 2.5 | 1600 | $1,750 | $1.09 | 16d | 1 | 0.83mi |
| 7379 Ardmore St Unit 1303 Houston, TX | 3.0 | 2.0 | 1442 | $1,967 | $1.36 | 45d | 1 | 0.84mi |
| 7379 Ardmore St Unit 1303 Houston, TX | 3.0 | 2.0 | 1442 | $1,967 | $1.36 | 23d | 1 | 0.84mi |
| 2968 Holly Hall St Houston, TX | 2.0 | 3.0 | 1600 | $2,000 | $1.25 | 45d | 1 | 0.87mi |
| 4530 Mayflower St Houston, TX | 3.0 | 2.0 | 1302 | $1,800 | $1.38 | 45d | 1 | 0.87mi |
| 3620 Du Bois St Unit 1302349P Houston, TX | 3.0 | 2.5 | 1797 | $2,945 | $1.64 | 4d | 1 | 0.88mi |
| 2924 Holly Hall St Houston, TX | 2.0 | 3.0 | 1600 | $1,950 | $1.22 | 45d | 1 | 0.91mi |
| 6928 Paris St Houston, TX | 3.0 | 2.0 | 1276 | $1,900 | $1.49 | 0d | 1 | 0.95mi |
| 6926 Paris St Houston, TX | 3.0 | 2.0 | 1276 | $1,900 | $1.49 | 0d | 1 | 0.95mi |
| 3311 Daphne St Unit 1255369P Houston, TX | 3.0 | 3.5 | 1797 | $6,391 | $3.56 | 0d | 1 | 0.97mi |
| 3311 Daphne St Unit 3311 Houston, TX | 3.0 | 3.5 | 1800 | $7,500 | $4.17 | 45d | 1 | 0.97mi |
| 8181 El Mundo St Houston, TX | 1.0–3.0 | 1.0–2.0 | 1241 | $2,041 | $1.64 | 25d | 18 | 0.98mi |
| 8181 El Mundo St Houston, TX | 1.0–3.0 | 1.0–2.5 | 1356 | $2,262 | $1.67 | 0d | 48 | 0.98mi |
| 7110 Ardmore St Houston, TX | 2.0 | 1.0–2.0 | 831 | $2,390 | $2.87 | 0d | 17 | 0.98mi |
| 8328 Corinth St Unit B Houston, TX | 3.0 | 2.5 | 1500 | $2,800 | $1.87 | 21d | 1 | 0.99mi |
| 6737 Peerless St Unit A Houston, TX | 3.0 | 3.5 | 1732 | $2,649 | $1.53 | 18d | 1 | 1.00mi |
| 6735 Peerless St Unit CUNIT A Houston, TX | 3.0 | 3.5 | 1732 | $2,649 | $1.53 | 18d | 1 | 1.01mi |
| 6735c Peerless St Houston, TX | 3.0 | 3.5 | 1732 | $2,599 | $1.50 | 0d | 1 | 1.01mi |
| 4117 Shelby Cir Unit 1230900P Houston, TX | 4.0 | 2.0 | 1367 | $5,253 | $3.84 | 0d | 1 | 1.01mi |
| 3731 Alsace St Unit 1560804P Houston, TX | 3.0 | 2.0 | 2002 | $3,387 | $1.69 | 4d | 1 | 1.03mi |
| 6731 New York St Houston, TX | 3.0 | 3.0 | 2211 | $2,100 | $0.95 | 45d | 1 | 1.04mi |
| 4705 Idaho St Houston, TX | 3.0 | 2.5 | 1664 | $2,500 | $1.50 | 18d | 1 | 1.05mi |
| 4609 Bricker St Unit ABC Houston, TX | 3.0 | 2.5 | 1375 | $3,500 | $2.55 | 12d | 1 | 1.08mi |
| 4609 Bricker St Unit B Houston, TX | 3.0 | 2.5 | 1300 | $3,500 | $2.69 | 14d | 1 | 1.08mi |
Listing history 15 events
-
2026-06-21days on market $275,000 Active 240 DOM
-
2026-06-18days on market $275,000 Active 237 DOM
-
2026-06-17days on market $275,000 Active 236 DOM
-
2026-06-16days on market $275,000 Active 235 DOM
-
2026-06-15days on market $275,000 Active 234 DOM
-
2026-06-13days on market $275,000 Active 232 DOM
-
2026-06-10days on market $275,000 Active 228 DOM
-
2026-06-08days on market $275,000 Active 227 DOM
-
2026-06-07days on market $275,000 Active 226 DOM
-
2026-06-04days on market $275,000 Active 223 DOM
-
2026-06-01days on market $275,000 Active 220 DOM
-
2026-05-31days on market $275,000 Active 219 DOM
-
2026-02-28price $275,000 382-char remark
Show marketing remark (382 chars)
10,000 square foot corner lot ideal lot for new construction. The property contains two stuctures, 3733 & 3737 Noah, and is being sold for lot value. The neighborhood is established and brand new construction all around. Property is being sold as-is. Close proximity to Texas Medical Center Helix Park and Levit Green. Quick commute to NRG, Museum District and Downtown Houston.
-
2025-10-24$295,000 Active 382-char remark
Show marketing remark (382 chars)
10,000 square foot corner lot ideal lot for new construction. The property contains two stuctures, 3733 & 3737 Noah, and is being sold for lot value. The neighborhood is established and brand new construction all around. Property is being sold as-is. Close proximity to Texas Medical Center Helix Park and Levit Green. Quick commute to NRG, Museum District and Downtown Houston.
-
1995-12-15soldstatus
ⓘ Source: listings_history table (triggers on properties + properties_extension) + one-shot
backfill from property_details.listing_events for pre-trigger history.
Tax reassessment forecast TX · Resets to sale price
- Current annual tax
- $6,344 · $529/mo
- Projected year-2 tax
- $6,344 · $529/mo
- Expected delta
- $0/yr ($0/mo · 0.0%)
ⓘ Screening estimate from a state-policy table — verify with the county assessor before closing.
Climate risk First Street
- Flood 4/10 Moderate FEMA zone X (unshaded) · 21% chance over 30 yrs
- Wildfire 1/10 Low
- Heat 9/10 Extreme 7 d/yr ≥109°F today · 22 d/yr by 30 yrs out
- Wind 9/10 Extreme 99% chance of damaging wind over 30 yrs
- Air quality 2/10 Low 2 unhealthy d/yr today · 2 by 30 yrs out
Nearby sold comps map
Loading sold comps map…
Walkable amenities ~0.75 mi
Loading nearby amenities…
Taxation est. · year 1
- Rental income
- $27,883
- − Mortgage interest
- −$15,404
- − Property taxes
- −$6,344
- − Insurance
- −$1,375
- − Repairs & maintenance
- −$2,231
- − Management
- −$2,231
- − Depreciation
- −$8,000
- Taxable loss
- −$7,702
- Est. tax savings @ 24.0%
- +$1,848
- After-tax cash flow
- $-1,149/yr
For passive investors: Depreciation is non-cash, so a rental often shows a tax loss while cash-flowing — sheltering income. Rental losses are passive: they offset passive income freely, and up to $25,000/yr can offset ordinary (W-2) income if you actively participate and your MAGI is under $100k (phasing out to $0 by $150k); unused losses carry forward. On sale, claimed depreciation is recaptured at up to 25%, and gains may owe capital-gains tax (a 1031 exchange can defer both). Figures are a year-1 estimate at your 24.0% rate — not tax advice; consult a CPA.
Schools (NCES district)
- District
- Houston ISD
- NCES district ID
- 4823640
- Math proficiency
- 27% ▼ -18.00%
- Reading proficiency
- 35% ▼ -6.00%
- Median HH income
- $46,054
- Composite
- 26.63/100
- National rank
- #7173
- State rank
- #593 of 826 in TX
Livability — Houston
- Score
- 74/100
- State rank
- #184
- US rank
- #4771
Category grades
Schools grade is shown separately in the Schools card above.
Census & demographics
- Census place
- Houston, TX
- County
- Harris County · 4,702,590 people
- City population
- 3,226,434
- Metro
- Houston-The Woodlands-Sugar Land, TX
- Population (ZIP)
- 26,153
- Household income
- $45,574
- Rent vs Own
- Severe rent burden
- 2532.0
Population outlook (Harris County) Hauer SSP2
- Today (2025)
- 5,571,493 people
- By 2030
- 6,089,821 · +9.3%
- By 2040
- 7,142,806 · +28.2%
- By 2050
- 8,185,864 · +46.9%
- By 2075
- 10,574,329 · +89.8%
- By 2100
- 12,109,958 · +117.4%
Race, ethnicity, and origin ACS 2023
- Neighborhood character
- Diverse neighborhood (Simpson 0.55)
- Race & ethnicity
- Black 62% Hispanic / Latino 22% Two or more races 12% White 10% Asian 2%
- Hispanic origin (detail)
- Mexican 15%
- Common ancestry
- Italian 1% Romanian 1% Lithuanian 1%
- Foreign-born
- 11% · Canada
- Languages at home
- 77% English-only · Spanish 19% French/Haitian/Cajun 1% Other Indo-European 1%
Political lean MEDSL · Harris
- 2024 margin
- Lean D (+5.5) · D 52.0% · R 46.4% · Other 1.6%
- 2008→2024 swing
- +3.9pp toward D · 2008: 1.6pp · 2024: 5.5pp
- All cycles
- 2024: D+5.5 2020: D+13.3 2016: D+12.4 2012: D+0.1 2008: D+1.6
Not yet ingested
- Civics
- —
Market trends
- HPI YoY
- ▼ -71.22%
- Current HPI
- 230.2869
- Rent YoY
- ▲ 2.17%
- Metro
- Houston-The Woodlands-Sugar Land, TX
- State GDP YoY
- ▲ 3.95%
- F500 in state
- 110
Industry mix (Fortune 500 HQ in TX)
| Industry | F500 HQs | Revenue |
|---|---|---|
| Energy | 16 | $1,198B |
|
||
| Technology | 5 | $198B |
|
||
| Engineering / Construction | 4 | $72B |
|
||
| Energy Services | 3 | $60B |
|
||
| Utilities | 3 | $41B |
|
||
| Healthcare | 2 | $330B |
|
||
Price history
-6.8% since first listed3 events — show timeline
- 2026-02-28 Price Changed $275,000 HARMLS
- 2025-10-24 Listed $295,000 HARMLS
- 1995-12-15 Sold (Public Records) — Public Records
Property tax history
+9.1%/yrLatest (2025): $6,344 · +28.6% YoY. Source: county tax records.
Cash-flow waterfall
monthlySold comps — $/sqft
last 12 mo · ≤1 miLoading sold comps…