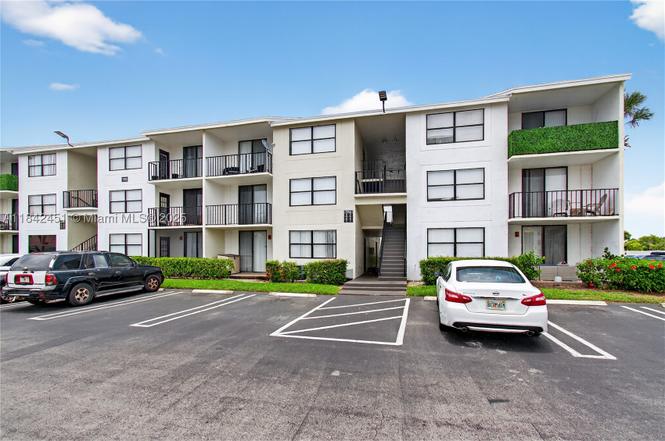
None · West Palm Beach, FL
Flood risk 1/10 · Minimal
- FEMA flood zone
- X (unshaded)
- Chance of flooding over 30 yrs
- 0.0%
- Est. flood insurance / yr
- $507 – $1,088
Fire risk 1/10 · Minimal
- Est. fire insurance / yr
- $947 – $1,759
Heat risk 10/10 · Severe
- Hot days now (above 105°F)
- 7 days/yr
- Hot days in 30 yrs
- 26 days/yr
Wind risk 10/10 · Severe
- Chance of severe wind over 30 yrs
- 99.0%
Air-quality risk 2/10 · Minimal
- Unhealthy air days now
- 1 days/yr
- Unhealthy air days in 30 yrs
- 1 days/yr
Risk factors via First Street. Map © Google.
Why this score? — see what drove the B grade
The composite is a weighted blend of 9 inputs, each scored 0–100. Each bar is that input's sub-score; the figure is the points it added to the 100-point composite (weight × sub-score).
- Cash flow +30.0/30.0
- 1% rule +10.0/10.0
- DSCR +10.0/10.0
- ARV discount +7.5/15.0
- Schools +4.3/10.0
- Livability +4.1/5.0
- Rent growth +3.8/5.0
- Condition / age +2.5/5.0
- Appreciation +0.0/10.0
$155,000
🖨 Deal sheet 📄 Offer letter ✓ Due diligence
Listing remarks
Bright & Spacious 1 bed 1 bath. Great for investors. Less than 1 mile from Palm Beach outlets. Biking/walking path along Clear Lake allows quick access to downtown Cityplace and Clematis street, excellent community in one of the hottest locations in WPB.
Key facts
- Biking walking path
- $507 HOA
- Parking
Tags
Property features AI
Finance
- Other: Association-managed pool
- Financial info: Pets allowed (yes) with size limit up to 20 lbs
- HOA & community: Monthly association fee; Association fee covers amenities, common areas, laundry, structure maintenance, pool(s), roof, sewer and water; Association amenities include laundry and pool
Exterior
- Parking: Assigned parking; Guest parking; One space assigned
- Utilities: Water included in association; Sewer included in association; Electric service available
- Home design: Attached property; 3-story building; Entry on level 2
- Construction: Block construction; Resale property
- Exterior features: Balcony; Open balcony/patio
Interior
- Kitchen: Dishwasher; Electric range; Refrigerator
- Flooring: Laminate
- Bathrooms: 1 full bathroom
- Heating & cooling: Central heating; Central air conditioning
- Interior features: Third floor entry; Laminate flooring
- Laundry & utility: Common area laundry
Neighborhood map
What this means for you Summary
Snapshot
- This is a 1-bed/1.0-bath condo listed at $155k.
Deal economics
- At list price, monthly cash flow is $989 ($12k/yr) — positive.
- The deal already cash-flows at list — no discount required.
- Meets the 1% rule at list price ($3k rent vs $155k).
- Recommended offer: $136k (12.0% below list) — sets the bar for market timing.
- Cap rate 13.9% vs local median 3.8% in West Palm Beach — top-decile yield for the area; either an underpriced asset or a hidden risk that comps aren't pricing in. Stress-test before assuming the spread holds.
Location & tenants
- Location reads 82/100 on livability (#75 in FL, #1,255 nationally) — a professional / high-income tenant draw. Strengths: commute A+, housing A+, health & safety A+; Watch: employment C-, crime F.
- Palm Beach (suburban): math 46% / reading 53% proficiency, ranked #34 of 73 in FL (top 47%) — families likely to look elsewhere, expect single-tenant / working-renter base with shorter leases.
- Market conditions: Rents rising fast (+5.2%/yr); 506 active listings in the ZIP; 16 comparable units currently listed for rent nearby; rentals leasing fast (median 3d on market — plan ~1-2 weeks tenant-placement turnaround); 3,974 units permitted in Palm Beach County in 2024 (1,012 in 5+ unit buildings).
- At $3,181/mo this rent would consume 56% of the median local household income ($68k/yr) (locally 2953% of renters already pay >50% of income on rent) — very limited rent-growth headroom before tenants either downsize or default.
Forward outlook
- Local home prices are declining (-3.0%/yr); year-one equity from $1k of loan paydown is wiped out by about $5k of value loss. Plan a longer hold.
- Palm Beach County population projected at +30% by 2050 — long-run rental-demand tailwind backs the buy-and-hold thesis.
- At projected returns (-3.0% appreciation + 5.2% rent growth), your $43k cash investment doubles in ~5 years — after that, you're playing with house money.
Negotiation context
- It's been on market 335 days — a 12% lower offer ($136k) is reasonable based on typical stale-listing flexibility.
- 2 sale attempts since 2y ago with the ask held roughly flat each time — persistent listings suggest the price (not the market) is what's stuck; bring a comps-based counter.
Risks & watch-outs
- Climate carrying-cost: severe wind risk, 99% chance of damaging wind over 30y; extreme-heat days projected 7→26/yr by 2055 (HVAC capex compounding) — expect insurance premiums to compound above CPI over the hold.
Questions for the listing agent
- It's been on market 335 days. Have you received any prior offers? Is the seller open to a 12% concession, seller financing, or rate buy-down credit?
- What does the HOA fee cover, when was the last increase, and are there any pending special assessments or reserve-fund shortfalls?
- Any open or pending special assessments — roof, HVAC, plumbing, elevator, façade? What's the per-unit balance and payoff schedule, and is the seller paying it off at close or rolling it to the buyer?
- Why hasn't it sold? Are there any deal-killer items the seller is aware of (foundation, flood, title, zoning, code violations)?
- Is there a deadline driving the sale (1031 exchange, divorce, estate, relocation)? That informs how much negotiation room exists.
- Crime grade is F in this area — have there been break-ins, vandalism, or insurance claims at this property in the last 3 years? What carrier currently insures it and at what premium?
- What's the average days-on-market for RENTAL listings here right now (not sales)? A rising rental-DOM trend means longer vacancies and softer asking-rent achievability than the comps imply.
- What's the recent tenant-quality profile in this submarket — average credit score on applications, eviction rate, late-payment / NSF rate, and stable-employment percentage? A property-management company in the area should have these aggregated.
- How much new apartment / multifamily construction is in the pipeline within 1–3 miles? Heavy new supply (>2% of stock underway) typically softens rents 12–24 months out; light construction supports rent growth.
Investment metrics
- 1% rule
- 2.05% ✓
- Cap rate
- 13.95%
- Cash-on-cash
- 27.34%
- DSCR
- 2.22
- GRM
- 4.1
CMA / ARV
No comps found within radius.
Projected returns pro-forma
-3.0% appreciation · 5.15% rent growth · sell at horizon
- IRR
- 24.4%
- Equity multiple
- 2.04×
- Total profit
- $45,226
- Equity at exit
- $23,111
- IRR
- 33.9%
- Equity multiple
- 4.50×
- Total profit
- $151,957
- Equity at exit
- $13,402
Cash invested: $43,400 (down + closing). Projections, not guarantees.
Landlord ↔ Tenant lean methodology
- Overall (STATE)
- 87 Strongly Landlord-Friendly
- State Florida
- 87 Strongly Landlord-Friendly · R+3
- County
- — inherits STATE
- City
- — inherits STATE
ZIP-level market 33401
- Rents YoY
- 5.2%
- Active inventory
- 506
- Price-to-rent
- 4.1×
Monthly cashflow live
- Estimated rent
- $3,181 high interval (Pro) →
- Mortgage (P&I)
- −$813
- Tax from tax record
- −$140 /mo · $1,679/yr
- Insurance
- −$65
- HOA
- −$507
- Vacancy / Maint / Mgmt
- −$668
- Net cashflow
- $989
Break-even live
UW: 25.0% down · 7.5% · 30yr · 1.5% tax · 5.0% vac · 8.0% maint · 8.0% mgmt
Financing live
Cash to close
- Down payment
- $38,750
- Closing costs
- $4,650
- Reserves months
- —
- Total cash needed
- —
Loan-product check · same deal, 3 products live
Conventional
25% down · 7.5% · 30yr
- Down + closing
- —
- Monthly P&I
- —
- Monthly cashflow
- —
- DSCR
- —
- Eligible?
- —
Personal DTI + credit; lowest rate.
DSCR
20% down · 8.5% · 30yr
- Down + closing
- —
- Monthly P&I
- —
- Monthly cashflow
- —
- DSCR
- —
- Eligible?
- —
No personal income docs; deal must DSCR.
Hard money
10% down · 12.0% · 12mo
- Down + closing
- —
- Monthly P&I
- —
- Monthly cashflow
- —
- DSCR
- —
- Eligible?
- —
Short-term bridge; refi at stabilization.
Rent comps 16 comps
| Address | Beds | Baths | Sqft | Rent | $/sqft | DOM | Units | Dist |
|---|---|---|---|---|---|---|---|---|
| 201 Clearwater Dr West Palm Beach, FL | 2.0 | 1.0–2.0 | 727 | $3,414 | $4.70 | 24d | 19 | 0.66mi |
| 201 Clearwater Dr West Palm Beach, FL | 2.0 | 1.0–2.0 | 731 | $4,365 | $5.97 | 10d | 16 | 0.66mi |
| 651 Okeechobee Blvd West Palm Beach, FL | 1.0–2.0 | 1.0–2.5 | 887 | $3,000 | $3.38 | 13d | 5 | 1.04mi |
| 591 Evernia St West Palm Beach, FL | 2.0 | 1.0–2.0 | 943 | $4,270 | $4.53 | 2d | 26 | 1.04mi |
| 1050 Blanche St West Palm Beach, FL | 2.0 | 1.0–2.0 | 740 | $2,838 | $3.83 | 2d | 8 | 1.09mi |
| 1500 Centrepark Blvd West Palm Beach, FL | 2.0 | 1.0–2.0 | 862 | $2,624 | $3.04 | 1d | 18 | 1.13mi |
| 480 Hibiscus St West Palm Beach, FL | 1.0–2.0 | 1.5–2.0 | 885 | $3,495 | $3.95 | 24d | 3 | 1.21mi |
| 480 Hibiscus St West Palm Beach, FL | 1.0–2.0 | 1.0–2.0 | 867 | $3,600 | $4.15 | 2d | 4 | 1.21mi |
| 499 Evernia St West Palm Beach, FL | 2.0 | 1.0–2.0 | 827 | $3,198 | $3.87 | 2d | 26 | 1.24mi |
| 333 Fern St West Palm Beach, FL | 2.0 | 1.0–2.0 | 1121 | $3,974 | $3.54 | 2d | 1 | 1.29mi |
| 1710 N Congress Ave West Palm Beach, FL | 1.0–3.0 | 1.0–2.0 | 1210 | $2,495 | $2.06 | 24d | 4 | 1.30mi |
| 345 Banyan Blvd West Palm Beach, FL | 3.0 | 1.0–2.0 | 1023 | $4,017 | $3.92 | 1d | 19 | 1.34mi |
| 255 Evernia St #1421 West Palm Beach, FL | 1.0 | 1.0 | 666 | $3,000 | $4.50 | 10d | 1 | 1.41mi |
| 290 N Olive Ave West Palm Beach, FL | 2.0 | 1.0–2.0 | 870 | $3,976 | $4.57 | 1d | 20 | 1.42mi |
| 740 N Dixie Hwy West Palm Beach, FL | 1.0 | 1.0 | 679 | $3,187 | $4.69 | 1d | 5 | 1.42mi |
| 805 N Olive Ave West Palm Beach, FL | 1.0–2.0 | 1.0–2.0 | 852 | $2,473 | $2.90 | 3d | 15 | 1.44mi |
HOA detail condo
- Monthly dues
- $507 · $6,084/yr
- Assessments
- None detected in remarks — confirm with the listing agent.
Listing history 15 events
-
2026-06-18days on market $155,000 Active 335 DOM
-
2026-06-17days on market $155,000 Active 334 DOM
-
2026-06-16days on market $155,000 Active 333 DOM
-
2026-06-15days on market $155,000 Active 332 DOM
-
2026-06-13days on market $155,000 Active 330 DOM
-
2026-06-09days on market $155,000 Active 326 DOM
-
2026-06-07days on market $155,000 Active 324 DOM
-
2026-06-04days on market $155,000 Active 321 DOM
-
2026-06-03days on market $155,000 Active 320 DOM
-
2026-06-01days on market $155,000 Active 318 DOM
-
2026-05-31days on market $155,000 Active 317 DOM
-
2025-07-17$155,000 Active
-
2025-01-27status Pending
-
2025-01-27historical
-
2024-10-11$159,900 Active
ⓘ Source: listings_history table (triggers on properties + properties_extension) + one-shot
backfill from property_details.listing_events for pre-trigger history.
Tax reassessment forecast FL · Resets to sale price
- Current annual tax
- $1,679 · $140/mo
- Projected year-2 tax
- $1,679 · $140/mo
- Expected delta
- $0/yr ($0/mo · 0.0%)
ⓘ Screening estimate from a state-policy table — verify with the county assessor before closing.
Climate risk First Street
- Flood 1/10 Low FEMA zone X (unshaded) · 0% chance over 30 yrs
- Wildfire 1/10 Low
- Heat 10/10 Extreme 7 d/yr ≥105°F today · 26 d/yr by 30 yrs out
- Wind 10/10 Extreme 99% chance of damaging wind over 30 yrs
- Air quality 2/10 Low 1 unhealthy d/yr today · 1 by 30 yrs out
Nearby sold comps map
Loading sold comps map…
Walkable amenities ~0.75 mi
Loading nearby amenities…
Taxation est. · year 1
- Rental income
- $38,176
- − Mortgage interest
- −$8,682
- − Property taxes
- −$1,679
- − Insurance
- −$775
- − Repairs & maintenance
- −$3,054
- − Management
- −$3,054
- − HOA
- −$6,084
- − Depreciation
- −$4,509
- Taxable income
- $10,339
- Est. tax owed @ 24.0%
- −$2,481
- After-tax cash flow
- $9,386/yr
For passive investors: Depreciation is non-cash, so a rental often shows a tax loss while cash-flowing — sheltering income. Rental losses are passive: they offset passive income freely, and up to $25,000/yr can offset ordinary (W-2) income if you actively participate and your MAGI is under $100k (phasing out to $0 by $150k); unused losses carry forward. On sale, claimed depreciation is recaptured at up to 25%, and gains may owe capital-gains tax (a 1031 exchange can defer both). Figures are a year-1 estimate at your 24.0% rate — not tax advice; consult a CPA.
Schools (NCES district)
- District
- Palm Beach
- NCES district ID
- 1201500
- Math proficiency
- 46% ▼ -16.00%
- Reading proficiency
- 53% ▼ -4.00%
- Median HH income
- $53,943
- Composite
- 42.72/100
- National rank
- #3160
- State rank
- #34 of 73 in FL
Livability — West Palm Beach
- Score
- 82/100
- State rank
- #75
- US rank
- #1255
Category grades
Schools grade is shown separately in the Schools card above.
Census & demographics
- Census place
- West Palm Beach, FL
- County
- Palm Beach County · 1,438,312 people
- City population
- 222,012
- Metro
- Miami-Fort Lauderdale-Pompano Beach, FL
- Population (ZIP)
- 33,698
- Household income
- $67,967
- Rent vs Own
- Severe rent burden
- 2953.0
Population outlook (Palm Beach County) Hauer SSP2
- Today (2025)
- 1,637,487 people
- By 2030
- 1,743,255 · +6.5%
- By 2040
- 1,948,712 · +19.0%
- By 2050
- 2,132,979 · +30.3%
- By 2075
- 2,530,027 · +54.5%
- By 2100
- 2,706,979 · +65.3%
Race, ethnicity, and origin ACS 2023
- Neighborhood character
- Diverse neighborhood (Simpson 0.68)
- Race & ethnicity
- White 43% Black 32% Hispanic / Latino 17% Two or more races 11% Asian 3%
- Hispanic origin (detail)
- Mexican 2% Puerto Rican 3% Cuban 3%
- Common ancestry
- Hispanic 6% Slovak 2% Romanian 2%
- Foreign-born
- 26% · Canada, Jamaica, China
- Languages at home
- 73% English-only · Spanish 13% French/Haitian/Cajun 7% Other Asian/Pacific 2%
Political lean MEDSL · Palm Beach
- 2024 margin
- Toss-up / Even · D 50.0% · R 49.2%
- 2008→2024 swing
- -22.1pp toward R · 2008: 22.9pp · 2024: 0.8pp
- All cycles
- 2024: D+0.8 2020: D+12.8 2016: D+15.3 2012: D+17.0 2008: D+22.9
Not yet ingested
- Civics
- —
Market trends
- HPI YoY
- ▼ -324.96%
- Current HPI
- 367.0978
- Rent YoY
- ▲ 5.15%
- Metro
- Miami-Fort Lauderdale-Pompano Beach, FL
- State GDP YoY
- ▲ 3.28%
- F500 in state
- 36
Industry mix (Fortune 500 HQ in FL)
| Industry | F500 HQs | Revenue |
|---|---|---|
| Industrial Technology | 2 | $29B |
|
||
| Insurance | 2 | $17B |
|
||
| Retail | 1 | $60B |
|
||
| Technology Distribution | 1 | $58B |
|
||
| Homebuilding | 1 | $35B |
|
||
| Technology Manufacturing | 1 | $35B |
|
||
Price history
-3.1% since first listed4 events — show timeline
- 2025-07-17 Listed $155,000 MARMLS
- 2025-01-27 Pending — Beaches MLS
- 2025-01-27 Listing Removed — Beaches MLS
- 2024-10-11 Listed $159,900 Beaches MLS
Property tax history
+9.7%/yrLatest (2025): $1,679 · +6.7% YoY. Source: county tax records.
Cash-flow waterfall
monthlySold comps — $/sqft
last 12 mo · ≤1 miLoading sold comps…