 🔨 Auction
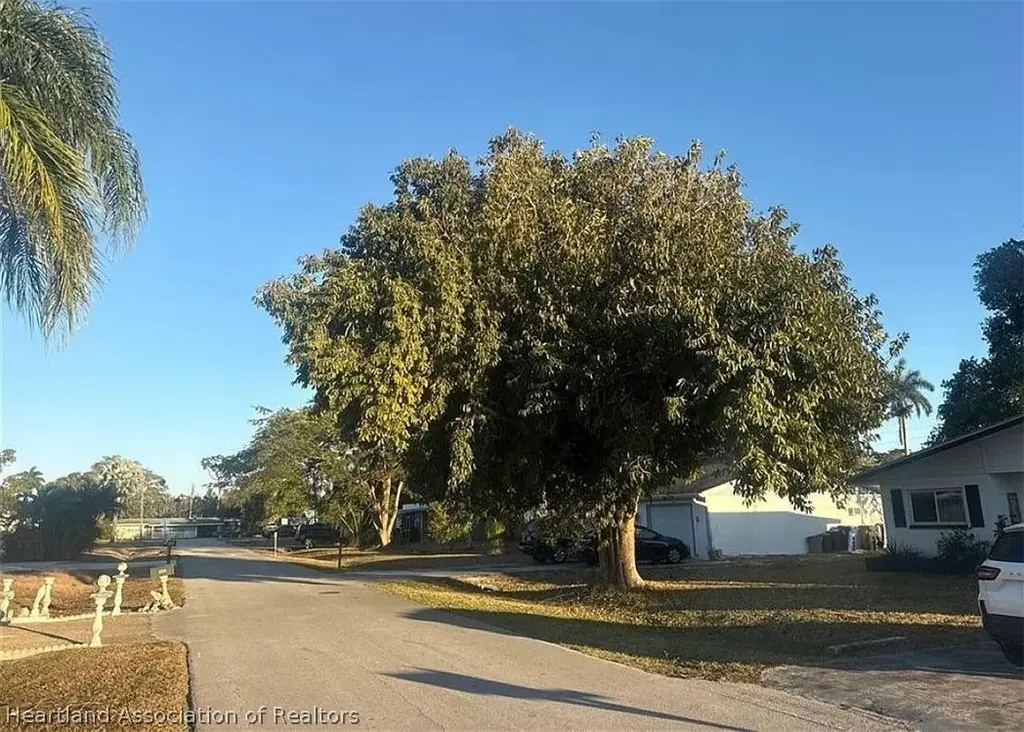
2131 Aldridge Ave · Villas, FL
Flood risk 6/10 · Moderate
- FEMA flood zone
- X (shaded)
- Chance of flooding over 30 yrs
- 0.59%
- Est. flood insurance / yr
- $507 – $1,088
Fire risk 1/10 · Minimal
- Est. fire insurance / yr
- $947 – $1,759
Heat risk 10/10 · Severe
- Hot days now (above 107°F)
- 7 days/yr
- Hot days in 30 yrs
- 32 days/yr
Wind risk 10/10 · Severe
- Chance of severe wind over 30 yrs
- 99.0%
Air-quality risk 2/10 · Minimal
- Unhealthy air days now
- 1 days/yr
- Unhealthy air days in 30 yrs
- 1 days/yr
Risk factors via First Street. Map © Google.
Why this score? — see what drove the F grade
The composite is a weighted blend of 9 inputs, each scored 0–100. Each bar is that input's sub-score; the figure is the points it added to the 100-point composite (weight × sub-score).
- ARV discount +7.5/15.0
- Cash flow +6.0/30.0
- Schools +4.1/10.0
- Livability +4.0/5.0
- Condition / age +2.5/5.0
- 1% rule +1.3/10.0
- DSCR +0.3/10.0
- Rent growth +0.1/5.0
- Appreciation +0.0/10.0
$5,000
🖨 Deal sheet 📄 Offer letter ✓ Due diligence
Listing remarks
Foreclosure Auction Ends June 11, 2026 at 9:00 AM EST. Explore this charming 2-bedroom, 1-bath residence set in a peaceful and well-located Fort Myers community. The list price is the opening bid for the online auction. Sold As-is. Explore more details and submit your bid through Federa Home App.
Key facts
- 8,712 sq ft lot
- Built 1957
- Listed 5 days
Property features AI
Finance
- Other: Zoning: RS-1
Exterior
- Parking: Driveway parking; On-street parking
- Utilities: Other water source; Other sewer
- Home design: Single-family residence; One story; Residential property
- Construction: Construction materials: see remarks; Other roof
- Exterior features: Front porch
Interior
- Flooring: Other
- Bathrooms: 1 full bathroom
- Heating & cooling: No heating; No cooling
- Interior features: Other flooring; One total room
Neighborhood map
What this means for you Summary
Snapshot
- This is a 2-bed/1.0-bath single-family listed at $5k.
Deal economics
- At list price, monthly cash flow is $-448 ($-5k/yr) — negative.
- The deal already cash-flows at list — no discount required.
- Meets the 1% rule at list price ($1k rent vs $5k).
- Cap rate 4.0% vs local median 1.3% in Villas — top-decile yield for the area; either an underpriced asset or a hidden risk that comps aren't pricing in. Stress-test before assuming the spread holds.
Location & tenants
- Location reads 81/100 on livability (#94 in FL, #1,462 nationally) — a professional / high-income tenant draw. Strengths: cost of living A+, housing A+, health & safety A+; Watch: commute C-, schools F, amenities D-.
- Lee (suburban): math 47% / reading 50% proficiency, ranked #42 of 73 in FL (top 58%) — families likely to look elsewhere, expect single-tenant / working-renter base with shorter leases.
- Market conditions: Rents falling (-9.7%/yr); 346 active listings in the ZIP; 40 comparable units currently listed for rent nearby; rentals at typical pace (median 19d on market — plan ~3-4 weeks tenant-placement turnaround); 15,411 units permitted in Lee County in 2024 (4,686 in 5+ unit buildings).
- This rent runs 34% of the median local income ($52k/yr) — at the standard rent-burdened threshold; future hikes will face affordability resistance.
Forward outlook
- Local home prices are declining (-3.0%/yr); year-one equity from $2k of loan paydown is wiped out by about $7k of value loss. Plan a longer hold.
- Lee County population projected at +44% by 2050 — long-run rental-demand tailwind backs the buy-and-hold thesis.
Negotiation context
- Only 6 days on market — expect competitive offers; lowballing is unlikely to land.
- 2 sale attempts with the ask held roughly flat each time — persistent listings suggest the price (not the market) is what's stuck; bring a comps-based counter.
Risks & watch-outs
- Watch-outs: property tax is 70.1% of price; built in 1957 — expect roof / HVAC / electrical / plumbing capex.
- Climate carrying-cost: major flood risk; severe wind risk, 99% chance of damaging wind over 30y; extreme-heat days projected 7→32/yr by 2055 (HVAC capex compounding) — expect insurance premiums to compound above CPI over the hold.
Questions for the listing agent
- What do current leases actually rent for vs. the listed asking? Can we see a recent rent roll and the last 12 months of T-12 income?
- Built in 1957 — when were the roof, HVAC, electrical panel, plumbing, and water heater last replaced?
- Property tax is high relative to price — has the assessment been appealed recently, and will the sale trigger a re-assessment?
- Is there a deadline driving the sale (1031 exchange, divorce, estate, relocation)? That informs how much negotiation room exists.
- Schools are F-rated, which usually means shorter tenancies and higher turnover. Who's the typical renter profile here, and what's been the actual vacancy rate?
- The area grade is low — what's the realistic commute time and amenity access for the typical tenant pool here? Any planned neighborhood developments (good or bad) we should know about?
- What's the average days-on-market for RENTAL listings here right now (not sales)? A rising rental-DOM trend means longer vacancies and softer asking-rent achievability than the comps imply.
- What's the recent tenant-quality profile in this submarket — average credit score on applications, eviction rate, late-payment / NSF rate, and stable-employment percentage? A property-management company in the area should have these aggregated.
- How much new for-sale + rental construction is in the pipeline within 1–3 miles? Heavy new supply typically softens prices + rents 12–24 months out; constrained supply supports both.
Investment metrics
- 1% rule
- 0.63% ✗
- Cap rate
- 3.99%
- Cash-on-cash
- -8.21%
- DSCR
- 0.63
- GRM
- 13.2
CMA / ARV
- ARV (on-the-fly)
- $233,700
- Comps found
- 4
Show comp detail 4 sales within ~0.75 mi
| Address | Dist | Beds/Ba | Sqft | Sold | Price | $/sf | Match |
|---|---|---|---|---|---|---|---|
| 2200 Coronet St | 0.67mi | 2/1.0 | 978 (-5%) | 17mo | $222,500 | $228 | 47 |
| 2196 Barry Dr | 0.62mi | 3/1.0 (+1) | 1,001 (-2%) | 19mo | $172,500 | $172 | 46 |
| 8760 Dartmouth St | 0.73mi | 2/2.0 | 1,164 (+14%) | 3mo | $250,000 | $215 | 37 |
| 2313 Gorham Ave | 0.55mi | 3/2.0 (+1) | 1,151 (+12%) | 17mo | $319,900 | $278 | 31 |
Match score weights: distance 35% · size 25% · config 20% · recency 20%. Top-matched comps best support the ARV.
Projected returns pro-forma
-3.0% appreciation · 0.0% rent growth · sell at horizon
- IRR
- -34.1%
- Equity multiple
- -0.08×
- Total profit
- $-70,690
- Equity at exit
- $34,845
- IRR
- -65.5%
- Equity multiple
- -0.76×
- Total profit
- $-114,915
- Equity at exit
- $20,206
Cash invested: $65,436 (down + closing). Projections, not guarantees.
Landlord ↔ Tenant lean methodology
- Overall (STATE)
- 87 Strongly Landlord-Friendly
- State Florida
- 87 Strongly Landlord-Friendly · R+3
- County
- — inherits STATE
- City
- — inherits STATE
ZIP-level market 33907
- Home prices YoY
- -26.8%
- Rents YoY
- -9.7%
- Active inventory
- 346
- Price-to-rent
- 0.3×
Monthly cashflow live
- Estimated rent
- $1,478 high interval (Pro) →
- Mortgage (P&I)
- −$1,226
- Tax est. 1.5%
- −$292 /mo · $3,506/yr
- Insurance
- −$97
- HOA
- −$0
- Vacancy / Maint / Mgmt
- −$310
- Net cashflow
- $-448
Break-even live
UW: 25.0% down · 7.5% · 30yr · 1.5% tax · 5.0% vac · 8.0% maint · 8.0% mgmt
Financing live
Cash to close
- Down payment
- $58,425
- Closing costs
- $7,011
- Reserves months
- —
- Total cash needed
- —
Loan-product check · same deal, 3 products live
Conventional
25% down · 7.5% · 30yr
- Down + closing
- —
- Monthly P&I
- —
- Monthly cashflow
- —
- DSCR
- —
- Eligible?
- —
Personal DTI + credit; lowest rate.
DSCR
20% down · 8.5% · 30yr
- Down + closing
- —
- Monthly P&I
- —
- Monthly cashflow
- —
- DSCR
- —
- Eligible?
- —
No personal income docs; deal must DSCR.
Hard money
10% down · 12.0% · 12mo
- Down + closing
- —
- Monthly P&I
- —
- Monthly cashflow
- —
- DSCR
- —
- Eligible?
- —
Short-term bridge; refi at stabilization.
Rent comps 40 comps
| Address | Beds | Baths | Sqft | Rent | $/sqft | DOM | Units | Dist |
|---|---|---|---|---|---|---|---|---|
| 2135 Crystal Dr #45 Fort Myers, FL | 2.0 | 2.0 | 984 | $1,400 | $1.42 | 23d | 1 | 0.10mi |
| 2135 Crystal Dr Fort Myers, FL | 2.0 | 2.0–2.5 | 1049 | $1,350 | $1.29 | 3d | 2 | 0.10mi |
| 2224 Aldridge Ave Fort Myers, FL | 2.0 | 1.0 | 1221 | $2,100 | $1.72 | 21d | 1 | 0.18mi |
| 5337 Glenlivet Rd Fort Myers, FL | 2.0 | 2.0 | 1033 | $1,350 | $1.31 | 14d | 1 | 0.24mi |
| 5337 Glenlivet Rd Fort Myers, FL | 2.0 | 2.0 | 1033 | $1,350 | $1.31 | 13d | 1 | 0.24mi |
| 5001 Palm Pointe Ct Fort Myers, FL | 1.0–3.0 | 1.0–2.0 | 990 | $2,150 | $2.17 | 2d | 35 | 0.44mi |
| 1830 Brantley Rd Fort Myers, FL | 2.0 | 2.0 | 1301 | $1,398 | $1.07 | 16d | 2 | 0.44mi |
| 1830 Brantley Rd Unit J-9 Fort Myers, FL | 2.0 | 2.0 | 1280 | $1,375 | $1.07 | 3d | 1 | 0.44mi |
| 12530 Equestrian Cir #409 Fort Myers, FL | 1.0 | 1.0 | 795 | $1,795 | $2.26 | 23d | 1 | 0.46mi |
| 12571 Equestrian Cir #903 Fort Myers, FL | 1.0 | 1.0 | 727 | $1,250 | $1.72 | 16d | 1 | 0.50mi |
| 2348 Burton Ave Fort Myers, FL | 2.0 | 1.0 | 1024 | $1,895 | $1.85 | 11d | 1 | 0.53mi |
| 12750 Equestrian Cir #3005 Fort Myers, FL | 3.0 | 2.0 | 1154 | $1,650 | $1.43 | 23d | 1 | 0.55mi |
| 7334-7371 Pinnacle Pines Dr Fort Myers, FL | 1.0–2.0 | 1.0–2.0 | 860 | $1,350 | $1.57 | 2d | 6 | 0.61mi |
| 5635 5th Ave Fort Myers, FL | 2.0 | 1.0 | 800 | $1,299 | $1.62 | 23d | 1 | 0.62mi |
| 12622 Kenwood Ln Unit B Fort Myers, FL | 2.0 | 2.0 | 1047 | $1,395 | $1.33 | 23d | 1 | 0.67mi |
| 5625 Trailwinds Dr #412 Fort Myers, FL | 3.0 | 2.0 | 1331 | $2,150 | $1.62 | 23d | 1 | 0.68mi |
| 8949 Chatham St Fort Myers, FL | 2.0 | 2.0 | 1294 | $1,800 | $1.39 | 21d | 1 | 0.68mi |
| 5551 Fifth Ave Fort Myers, FL | 2.0 | 1.0 | 910 | $1,050 | $1.15 | 3d | 1 | 0.68mi |
| 5551 Fifth Ave Fort Myers, FL | 2.0 | 1.0 | 910 | $1,100 | $1.21 | 19d | 1 | 0.68mi |
| 5551 Fifth Ave Fort Myers, FL | 2.0 | 1.0 | 910 | $1,150 | $1.26 | 2d | 1 | 0.68mi |
| 5510 Third Ave Unit 5510 Fort Myers, FL | 2.0 | 2.0 | 1200 | $1,250 | $1.04 | 23d | 1 | 0.69mi |
| 5710 Trailwinds Dr #525 Fort Myers, FL | 3.0 | 3.0 | 1171 | $1,700 | $1.45 | 2d | 1 | 0.69mi |
| 5710 Trailwinds Dr #525 Fort Myers, FL | 3.0 | 2.0 | 1435 | $1,950 | $1.36 | 19d | 1 | 0.69mi |
| 5510 Third Ave Unit 5504B Fort Myers, FL | 1.0 | 1.0 | 900 | $1,150 | $1.28 | 23d | 1 | 0.70mi |
| 5545 5th Ave Fort Myers, FL | 3.0 | 2.0 | 960 | $1,525 | $1.59 | 13d | 1 | 0.70mi |
| 12664 Kenwood Ln Unit C Fort Myers, FL | 2.0 | 2.0 | 1047 | $1,350 | $1.29 | 3d | 1 | 0.72mi |
| 5542 Malt Dr #2 Fort Myers, FL | 2.0 | 2.0 | 1260 | $2,400 | $1.90 | 23d | 1 | 0.72mi |
| 5572 Malt Dr #4 Fort Myers, FL | 2.0 | 2.0 | 1200 | $1,800 | $1.50 | 23d | 1 | 0.72mi |
| 12656 Kenwood Ln Unit A Fort Myers, FL | 2.0 | 2.0 | 1047 | $1,575 | $1.50 | 3d | 1 | 0.73mi |
| 12648 Kenwood Ln Unit B Fort Myers, FL | 2.0 | 2.0 | 1047 | $1,500 | $1.43 | 23d | 1 | 0.75mi |
| 1703 Palm Dr Fort Myers, FL | 2.0 | 1.0 | 800 | $1,200 | $1.50 | 23d | 1 | 0.76mi |
| 1703 Palm Dr Unit A Fort Myers, FL | 2.0 | 1.0 | 800 | $1,200 | $1.50 | 19d | 1 | 0.76mi |
| 1653 Park Meadows Dr Fort Myers, FL | 2.0 | 2.0 | 1260 | $1,499 | $1.19 | 21d | 1 | 0.76mi |
| 7400 College Pkwy Fort Myers, FL | 2.0 | 2.0 | 1095 | $1,825 | $1.67 | 3d | 3 | 0.77mi |
| 5850 Trailwinds Dr #713 Fort Myers, FL | 2.0 | 2.0 | 1370 | $1,800 | $1.31 | 23d | 1 | 0.80mi |
| 5529 7th Ave Fort Myers, FL | 2.0 | 1.0 | 770 | $1,000 | $1.30 | 3d | 1 | 0.80mi |
| 5413-5427 Third Ave Unit 5421 Fort Myers, FL | 2.0 | 1.0 | 818 | $1,400 | $1.71 | 23d | 1 | 0.81mi |
| 13212 Tall Pine Cir Fort Myers, FL | 2.0 | 2.0 | 1379 | $2,100 | $1.52 | 14d | 1 | 0.82mi |
| 8253 Beacon Blvd Fort Myers, FL | 2.0 | 1.0 | 1000 | $1,395 | $1.40 | 23d | 1 | 0.83mi |
| 5554 Eighth Ave Unit 5552 Fort Myers, FL | 2.0 | 1.0 | 780 | $1,200 | $1.54 | 3d | 1 | 0.83mi |
Listing history 5 events
-
2026-06-10days on market $5,000 Active 6 DOM
-
2026-06-09days on market $5,000 Active 5 DOM
-
2026-06-08days on market $5,000 Active 4 DOM
-
2026-06-07remarks 297-char remark
-
2026-06-07$5,000 Active 3 DOM
ⓘ Source: listings_history table (triggers on properties + properties_extension) + one-shot
backfill from property_details.listing_events for pre-trigger history.
Climate risk First Street
- Flood 6/10 Major FEMA zone X (shaded) · 59% chance over 30 yrs
- Wildfire 1/10 Low
- Heat 10/10 Extreme 7 d/yr ≥107°F today · 32 d/yr by 30 yrs out
- Wind 10/10 Extreme 99% chance of damaging wind over 30 yrs
- Air quality 2/10 Low 1 unhealthy d/yr today · 1 by 30 yrs out
Nearby sold comps map
Loading sold comps map…
Walkable amenities ~0.75 mi
Loading nearby amenities…
Taxation est. · year 1
- Rental income
- $17,732
- − Mortgage interest
- −$13,091
- − Property taxes
- −$3,506
- − Insurance
- −$1,168
- − Repairs & maintenance
- −$1,419
- − Management
- −$1,419
- − Depreciation
- −$6,799
- Taxable loss
- −$9,668
- Est. tax savings @ 24.0%
- +$2,320
- After-tax cash flow
- $-3,052/yr
For passive investors: Depreciation is non-cash, so a rental often shows a tax loss while cash-flowing — sheltering income. Rental losses are passive: they offset passive income freely, and up to $25,000/yr can offset ordinary (W-2) income if you actively participate and your MAGI is under $100k (phasing out to $0 by $150k); unused losses carry forward. On sale, claimed depreciation is recaptured at up to 25%, and gains may owe capital-gains tax (a 1031 exchange can defer both). Figures are a year-1 estimate at your 24.0% rate — not tax advice; consult a CPA.
Schools (NCES district)
- District
- Lee
- NCES district ID
- 1201080
- Math proficiency
- 47% ▼ -11.00%
- Reading proficiency
- 50% ▼ -4.00%
- Median HH income
- $49,518
- Composite
- 41.49/100
- National rank
- #3458
- State rank
- #42 of 73 in FL
Livability — Villas
- Score
- 81/100
- State rank
- #94
- US rank
- #1462
Category grades
Schools grade is shown separately in the Schools card above.
Census & demographics
- Census place
- Villas, FL
- County
- Lee County · 788,662 people
- City population
- 24,828
- Metro
- Cape Coral-Fort Myers, FL
- Population (ZIP)
- 25,033
- Household income
- $52,478
- Rent vs Own
- Severe rent burden
- 1960.0
Population outlook (Lee County) Hauer SSP2
- Today (2025)
- 871,946 people
- By 2030
- 955,468 · +9.6%
- By 2040
- 1,113,587 · +27.7%
- By 2050
- 1,256,891 · +44.1%
- By 2075
- 1,560,270 · +78.9%
- By 2100
- 1,726,848 · +98.0%
Race, ethnicity, and origin ACS 2023
- Neighborhood character
- Diverse neighborhood (Simpson 0.63)
- Race & ethnicity
- White 52% Hispanic / Latino 30% Two or more races 21% Black 10% Asian 2%
- Hispanic origin (detail)
- Mexican 10% Puerto Rican 6% Cuban 2% Dominican 1%
- Common ancestry
- Hispanic 2% Romanian 2% Lithuanian 2%
- Foreign-born
- 26% · Canada, Jamaica, Dominican Republic
- Languages at home
- 65% English-only · Spanish 25% Other Indo-European 4% French/Haitian/Cajun 2%
Political lean MEDSL · Lee
- 2024 margin
- Strong R (+28.4) · D 35.5% · R 63.9%
- 2008→2024 swing
- -18.0pp toward R · 2008: -10.4pp · 2024: -28.4pp
- All cycles
- 2024: R+28.4 2020: R+19.2 2016: R+20.4 2012: R+16.6 2008: R+10.4
Not yet ingested
- Civics
- —
Market trends
- HPI YoY
- ▼ -93.02%
- Current HPI
- 254.2264
- Rent YoY
- ▼ -9.68%
- Metro
- Cape Coral-Fort Myers, FL
- State GDP YoY
- ▲ 3.28%
- F500 in state
- 36
Industry mix (Fortune 500 HQ in FL)
| Industry | F500 HQs | Revenue |
|---|---|---|
| Industrial Technology | 2 | $29B |
|
||
| Insurance | 2 | $17B |
|
||
| Retail | 1 | $60B |
|
||
| Technology Distribution | 1 | $58B |
|
||
| Homebuilding | 1 | $35B |
|
||
| Technology Manufacturing | 1 | $35B |
|
||
Price history
-91.2% since first listed4 events — show timeline
- 2026-06-04 Listed $5,000 HAOR as distributed by MLS GRID
- 2026-04-15 Listed $5,000 NFMLS
- 1998-05-06 Sold (Public Records) $59,900 Public Records
- 1992-12-02 Sold (Public Records) $56,900 Public Records
Property tax history
+7.8%/yrLatest (2025): $2,743 · -3.2% YoY. Source: county tax records.
Cash-flow waterfall
monthlySold comps — $/sqft
last 12 mo · ≤1 miLoading sold comps…