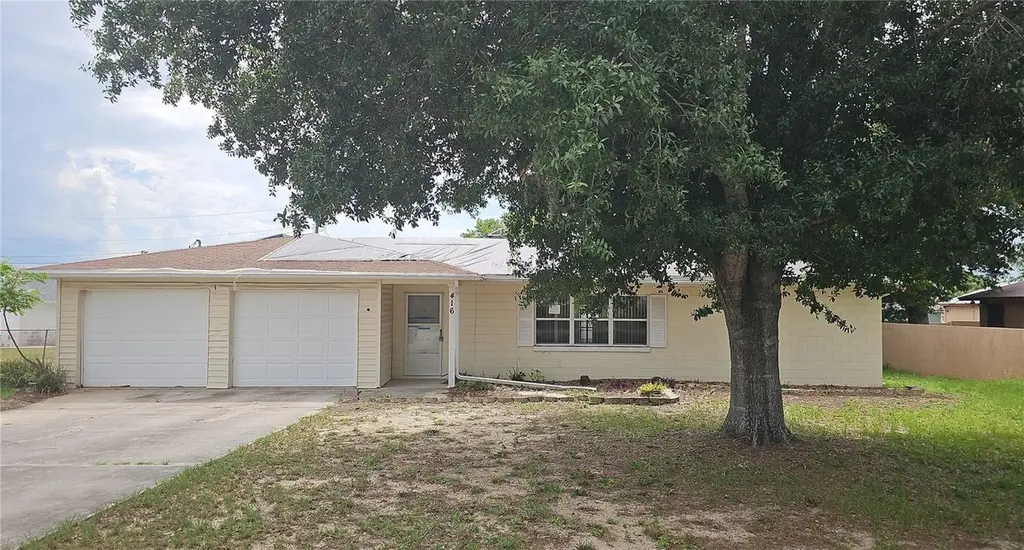
416 6th St S · Dundee, FL
Flood risk 1/10 · Minimal
- FEMA flood zone
- X (unshaded)
- Chance of flooding over 30 yrs
- 0.0%
- Est. flood insurance / yr
- $507 – $1,088
Fire risk 4/10 · Minor
- Est. fire insurance / yr
- $947 – $1,759
Heat risk 8/10 · Major
- Hot days now (above 108°F)
- 7 days/yr
- Hot days in 30 yrs
- 22 days/yr
Wind risk 9/10 · Severe
- Chance of severe wind over 30 yrs
- 99.0%
Air-quality risk 1/10 · Minimal
- Unhealthy air days now
- 0 days/yr
- Unhealthy air days in 30 yrs
- 0 days/yr
Risk factors via First Street. Map © Google.
Why this score? — see what drove the B grade
The composite is a weighted blend of 9 inputs, each scored 0–100. Each bar is that input's sub-score; the figure is the points it added to the 100-point composite (weight × sub-score).
- Cash flow +26.1/30.0
- Appreciation +10.0/10.0
- DSCR +8.8/10.0
- ARV discount +7.5/15.0
- 1% rule +5.9/10.0
- Schools +3.5/10.0
- Livability +3.2/5.0
- Rent growth +2.5/5.0
- Condition / age +2.5/5.0
$188,000
🖨 Deal sheet 📄 Offer letter ✓ Due diligence
Listing remarks
Ready for your personal touch! Check out this delightful 3 bedroom, 2 bath home with a 2 car garage situated on 0.28 acres! Spanning over 1,800 square feet of living space, this home features a living room, dining room, and kitchen with a breakfast bar. Split Bedroom Plan. The primary bedroom is complete with its own bathroom. Nice sized yard, perfect for outdoor entertaining. Close to Highway 27, great for commuters. Don't miss the opportunity to make this home your own. Call us Today.
Key facts
- 0.28 acre lot
- 2 garage spots
- Built 1973
Property features AI
Finance
- Other: Total acreage between 1/4 and less than 1/2 acre; Living area reported as 1,859 (public records); total building area reported as 2,379; Property identified as Residential / Single Family Residence
- Financial info: No lease restrictions
- HOA & community: No association; Association approval not required; Pets allowed
Exterior
- Parking: Attached 2-car garage (22 x 22); Driveway
- Utilities: Public water; Septic tank; Electricity available; Solar energy generation
- Home design: Single family residence; One story; Faces east; Residential zoning; Homestead exempt
- Construction: Block construction; Shingle roof; Slab foundation; Built as residential property
- Exterior features: Paved lot; Other exterior features
Interior
- Kitchen: Dishwasher; Range; Range hood; Refrigerator
- Bedrooms: 3 bedrooms
- Flooring: Carpet; Tile
- Bathrooms: 2 full bathrooms
- Heating & cooling: Central heating; Central air conditioning
- Interior features: Ceiling fans; Split bedroom floor plan; 6 total rooms
- Laundry & utility: Laundry room inside
Neighborhood map
What this means for you Summary
Snapshot
- This is a 3-bed/2.0-bath single-family listed at $188k.
Deal economics
- At list price, monthly cash flow is $477 ($6k/yr) — positive.
- The deal already cash-flows at list — no discount required.
- Meets the 1% rule at list price ($2k rent vs $188k).
Location & tenants
- Location reads 65/100 on livability (#638 in FL) — a middle-class / working-renter tenant base. Strengths: cost of living A+, housing A+, crime B+; Watch: employment D+, schools D, amenities F.
- Polk (suburban): math 39% / reading 43% proficiency, ranked #62 of 73 in FL (top 85%) — families likely to look elsewhere, expect single-tenant / working-renter base with shorter leases.
- Market conditions: 149 active listings in the ZIP; 9 comparable units currently listed for rent nearby; rentals at typical pace (median 19d on market — plan ~3-4 weeks tenant-placement turnaround); 10,384 units permitted in Polk County in 2024 (1,716 in 5+ unit buildings).
Forward outlook
- In year one you build about $20k of equity ($1k loan paydown + $19k appreciation (10.0% local appreciation)).
- Polk County population projected at +33% by 2050 — long-run rental-demand tailwind backs the buy-and-hold thesis.
- At projected returns (10.0% appreciation + 3.0% rent growth), your $53k cash investment doubles in ~2 years — after that, you're playing with house money.
- By year 2, paydown + projected appreciation supports a ~$32k cash-out refi (75% LTV) — recoverable capital for the next deal without selling this one.
Negotiation context
- Only 13 days on market — expect competitive offers; lowballing is unlikely to land.
- 2 sale attempts since 13y ago with the ask held roughly flat each time — persistent listings suggest the price (not the market) is what's stuck; bring a comps-based counter.
- Current owner paid $80k; list at $188k implies a 135% gain — meaningful room to come down on a strong offer.
Risks & watch-outs
- Climate carrying-cost: severe wind risk, 99% chance of damaging wind over 30y; extreme-heat days projected 7→22/yr by 2055 (HVAC capex compounding) — expect insurance premiums to compound above CPI over the hold.
Questions for the listing agent
- Built in 1973 — when were the roof, HVAC, electrical panel, plumbing, and water heater last replaced?
- Is there a deadline driving the sale (1031 exchange, divorce, estate, relocation)? That informs how much negotiation room exists.
- Schools are D-rated, which usually means shorter tenancies and higher turnover. Who's the typical renter profile here, and what's been the actual vacancy rate?
- What's the average days-on-market for RENTAL listings here right now (not sales)? A rising rental-DOM trend means longer vacancies and softer asking-rent achievability than the comps imply.
- What's the recent tenant-quality profile in this submarket — average credit score on applications, eviction rate, late-payment / NSF rate, and stable-employment percentage? A property-management company in the area should have these aggregated.
- How much new for-sale + rental construction is in the pipeline within 1–3 miles? Heavy new supply typically softens prices + rents 12–24 months out; constrained supply supports both.
Investment metrics
- 1% rule
- 1.09% ✓
- Cap rate
- 9.34%
- Cash-on-cash
- 10.86%
- DSCR
- 1.48
- GRM
- 7.7
CMA / ARV
No comps found within radius.
Projected returns pro-forma
10.0% appreciation · 3.0% rent growth · sell at horizon
- IRR
- 32.2%
- Equity multiple
- 3.52×
- Total profit
- $132,677
- Equity at exit
- $169,365
- IRR
- 27.8%
- Equity multiple
- 7.97×
- Total profit
- $366,703
- Equity at exit
- $365,243
Cash invested: $52,640 (down + closing). Projections, not guarantees.
Landlord ↔ Tenant lean methodology
- Overall (STATE)
- 87 Strongly Landlord-Friendly
- State Florida
- 87 Strongly Landlord-Friendly · R+3
- County
- — inherits STATE
- City
- — inherits STATE
ZIP-level market 33838
- Home prices YoY
- 17.6%
- Active inventory
- 149
- Price-to-rent
- 7.7×
Monthly cashflow live
- Estimated rent
- $2,043 high interval (Pro) →
- Mortgage (P&I)
- −$986
- Tax from tax record
- −$73 /mo · $877/yr
- Insurance
- −$78
- HOA
- −$0
- Vacancy / Maint / Mgmt
- −$429
- Net cashflow
- $477
Break-even live
UW: 25.0% down · 7.5% · 30yr · 1.5% tax · 5.0% vac · 8.0% maint · 8.0% mgmt
Financing live
Cash to close
- Down payment
- $47,000
- Closing costs
- $5,640
- Reserves months
- —
- Total cash needed
- —
Loan-product check · same deal, 3 products live
Conventional
25% down · 7.5% · 30yr
- Down + closing
- —
- Monthly P&I
- —
- Monthly cashflow
- —
- DSCR
- —
- Eligible?
- —
Personal DTI + credit; lowest rate.
DSCR
20% down · 8.5% · 30yr
- Down + closing
- —
- Monthly P&I
- —
- Monthly cashflow
- —
- DSCR
- —
- Eligible?
- —
No personal income docs; deal must DSCR.
Hard money
10% down · 12.0% · 12mo
- Down + closing
- —
- Monthly P&I
- —
- Monthly cashflow
- —
- DSCR
- —
- Eligible?
- —
Short-term bridge; refi at stabilization.
Rent comps 9 comps
| Address | Beds | Baths | Sqft | Rent | $/sqft | DOM | Units | Dist |
|---|---|---|---|---|---|---|---|---|
| 1207 Coda Ct Dundee, FL | 3.0 | 2.0 | 2040 | $1,795 | $0.88 | 14d | 1 | 0.62mi |
| 1709 Hill Top Dr Dundee, FL | 4.0 | 3.0 | 2072 | $2,160 | $1.04 | 3d | 1 | 0.74mi |
| 1804 Vista View Dr Dundee, FL | 4.0 | 3.0 | 2066 | $2,250 | $1.09 | 23d | 1 | 0.77mi |
| 391 Sol Vista Dr Dundee, FL | 3.0 | 2.5 | 1768 | $1,950 | $1.10 | 23d | 1 | 0.78mi |
| 1378 Legatto Loop Dundee, FL | 3.0 | 2.0 | 1397 | $1,850 | $1.32 | 3d | 1 | 0.78mi |
| 403 Sol Vista Dr Dundee, FL | 3.0 | 2.5 | 1630 | $1,950 | $1.20 | 23d | 1 | 0.79mi |
| 228 Hillcrest Dr Dundee, FL | 4.0 | 2.0 | 1928 | $2,075 | $1.08 | 19d | 1 | 0.87mi |
| 604 Lime Ave Dundee, FL | 3.0 | 3.0 | 1694 | $2,400 | $1.42 | 23d | 1 | 0.95mi |
| 2163 Mandarin Loop Dundee, FL | 3.0 | 2.0 | 1688 | $2,049 | $1.21 | 3d | 1 | 1.05mi |
Listing history 10 events
-
2026-06-18days on market $188,000 Active 13 DOM
-
2026-06-17days on market $188,000 Active 12 DOM
-
2026-06-16days on market $188,000 Active 11 DOM
-
2026-06-15days on market $188,000 Active 10 DOM
-
2026-06-13days on market $188,000 Active 8 DOM
-
2026-06-10days on market $188,000 Active 5 DOM
-
2026-06-09days on market $188,000 Active 4 DOM
-
2026-06-08days on market $188,000 Active 3 DOM
-
2026-06-07remarks 491-char remark
-
2026-06-07$188,000 Active 2 DOM
ⓘ Source: listings_history table (triggers on properties + properties_extension) + one-shot
backfill from property_details.listing_events for pre-trigger history.
Tax reassessment forecast FL · Resets to sale price
- Current annual tax
- $877 · $73/mo
- Projected year-2 tax
- $1,560 · $130/mo
- Expected delta
- +$684/yr (+$57/mo · 78.0%)
ⓘ Screening estimate from a state-policy table — verify with the county assessor before closing.
Climate risk First Street
- Flood 1/10 Low FEMA zone X (unshaded) · 0% chance over 30 yrs
- Wildfire 4/10 Moderate
- Heat 8/10 Severe 7 d/yr ≥108°F today · 22 d/yr by 30 yrs out
- Wind 9/10 Extreme 99% chance of damaging wind over 30 yrs
- Air quality 1/10 Low 0 unhealthy d/yr today · 0 by 30 yrs out
Nearby sold comps map
Loading sold comps map…
Walkable amenities ~0.75 mi
Loading nearby amenities…
Taxation est. · year 1
- Rental income
- $24,515
- − Mortgage interest
- −$10,531
- − Property taxes
- −$877
- − Insurance
- −$940
- − Repairs & maintenance
- −$1,961
- − Management
- −$1,961
- − Depreciation
- −$5,469
- Taxable income
- $2,776
- Est. tax owed @ 24.0%
- −$666
- After-tax cash flow
- $5,053/yr
For passive investors: Depreciation is non-cash, so a rental often shows a tax loss while cash-flowing — sheltering income. Rental losses are passive: they offset passive income freely, and up to $25,000/yr can offset ordinary (W-2) income if you actively participate and your MAGI is under $100k (phasing out to $0 by $150k); unused losses carry forward. On sale, claimed depreciation is recaptured at up to 25%, and gains may owe capital-gains tax (a 1031 exchange can defer both). Figures are a year-1 estimate at your 24.0% rate — not tax advice; consult a CPA.
Schools (NCES district)
- District
- Polk
- NCES district ID
- 1201590
- Math proficiency
- 39% ▼ -11.00%
- Reading proficiency
- 43% ▼ -4.00%
- Median HH income
- $43,979
- Composite
- 34.74/100
- National rank
- #5132
- State rank
- #62 of 73 in FL
Livability — Dundee
- Score
- 65/100
- State rank
- #638
- US rank
- #12542
Category grades
Schools grade is shown separately in the Schools card above.
Census & demographics
- Census place
- Dundee, FL
- City population
- 5,431
- Population (ZIP)
- 5,431
Population outlook (Polk County) Hauer SSP2
- Today (2025)
- 752,975 people
- By 2030
- 804,621 · +6.9%
- By 2040
- 906,117 · +20.3%
- By 2050
- 1,000,476 · +32.9%
- By 2075
- 1,197,520 · +59.0%
- By 2100
- 1,271,518 · +68.9%
Race, ethnicity, and origin ACS 2023
- Neighborhood character
- Diverse neighborhood (Simpson 0.63)
- Race & ethnicity
- Hispanic / Latino 50% White 30% Black 14% Two or more races 7% Asian 3%
- Hispanic origin (detail)
- Mexican 14% Puerto Rican 19% Dominican 6%
- Common ancestry
- Portuguese 1%
- Foreign-born
- 18% · Canada, Guatemala
- Languages at home
- 53% English-only · Spanish 47%
Political lean MEDSL · Polk
- 2024 margin
- Strong R (+20.7) · D 39.2% · R 59.9%
- 2008→2024 swing
- -14.6pp toward R · 2008: -6.1pp · 2024: -20.7pp
- All cycles
- 2024: R+20.7 2020: R+14.4 2016: R+14.1 2012: R+6.8 2008: R+6.1
Not yet ingested
- Civics
- —
Market trends
- HPI YoY
- ▲ 54.34%
- Current HPI
- 363.9764
- Rent YoY
- —
- Metro
- —
- State GDP YoY
- ▲ 3.28%
- F500 in state
- 36
Industry mix (Fortune 500 HQ in FL)
| Industry | F500 HQs | Revenue |
|---|---|---|
| Industrial Technology | 2 | $29B |
|
||
| Insurance | 2 | $17B |
|
||
| Retail | 1 | $60B |
|
||
| Technology Distribution | 1 | $58B |
|
||
| Homebuilding | 1 | $35B |
|
||
| Technology Manufacturing | 1 | $35B |
|
||
Price history
+88.0% since first listed5 events — show timeline
- 2026-06-05 Listed $188,000 Stellar MLS as Distributed by MLS Grid
- 2013-02-20 Sold (Public Records) $80,000 Public Records
- 2013-02-04 Listing Removed — Stellar MLS as Distributed by MLS Grid
- 2013-01-14 Listed $89,900 Stellar MLS as Distributed by MLS Grid
- 2003-08-13 Sold (Public Records) $100,000 Public Records
Property tax history
+3.1%/yrLatest (2025): $877 · +4.4% YoY. Source: county tax records.
Cash-flow waterfall
monthlySold comps — $/sqft
last 12 mo · ≤1 miLoading sold comps…