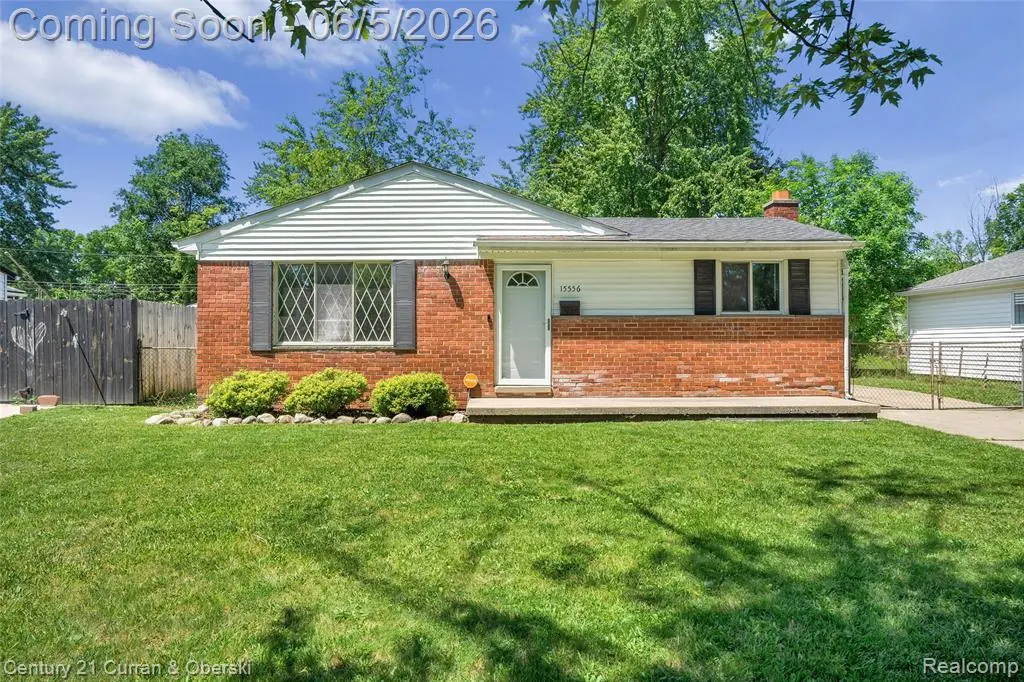
15556 Taft St · Romulus, MI
Flood risk 1/10 · Minimal
- FEMA flood zone
- X (unshaded)
- Chance of flooding over 30 yrs
- 0.0%
- Est. flood insurance / yr
- $473 – $860
Fire risk 2/10 · Minimal
- Est. fire insurance / yr
- $784 – $1,456
Heat risk 3/10 · Minor
- Hot days now (above 97°F)
- 7 days/yr
- Hot days in 30 yrs
- 15 days/yr
Wind risk 2/10 · Minimal
- Chance of severe wind over 30 yrs
- —
Air-quality risk 2/10 · Minimal
- Unhealthy air days now
- 1 days/yr
- Unhealthy air days in 30 yrs
- 3 days/yr
Risk factors via First Street. Map © Google.
Why this score? — see what drove the C- grade
The composite is a weighted blend of 9 inputs, each scored 0–100. Each bar is that input's sub-score; the figure is the points it added to the 100-point composite (weight × sub-score).
- Cash flow +17.5/30.0
- ARV discount +15.0/15.0
- 1% rule +5.5/10.0
- DSCR +5.5/10.0
- Livability +3.0/5.0
- Rent growth +2.5/5.0
- Condition / age +2.5/5.0
- Schools +1.3/10.0
- Appreciation +0.0/10.0
$150,000
🖨 Deal sheet 📄 Offer letter ✓ Due diligence
Listing remarks MLS
* * Friday open house is canceled * * Welcome Home! Here's your opportunity to own a true 4-bedroom home with the updates you've been searching for. From the moment you walk in, you'll appreciate the open-concept floor plan, creating a spacious and inviting atmosphere perfect for everyday living and entertaining. The updated kitchen features granite countertops, while fresh paint in select areas gives the home a clean, move-in-ready feel. Gather around the natural fireplace, adding warmth and character to the living space and creating the perfect setting for cozy evenings at home. The spacious layout offers plenty of room for a growing family, guests, or a home office setup. Step outside and enjoy a nice-sized backyard, offering plenty of space for family gatherings, summer barbecues, and outdoor entertainment. Conveniently located just minutes from I-94 and I-275, making commuting a breeze with easy on-and-off freeway access. Finding a true 4-bedroom home with these updates in this area is becoming increasingly difficult, but here's your chance. Take a look at the photos and see everything this move-in-ready home has to offer. Schedule your private showing today before this opportunity is gone!
Key facts
- 8,276 sq ft lot
- 2 garage spots
- Built 1967
Property features AI
Finance
- Other: Subdivision: OAKBROOK SUB; Directions: South of Middlebelt and west of Middlebelt; near Middlebelt and Eureka
Exterior
- Parking: Detached garage with 2 spaces; garage faces the side
- Utilities: Public water; Public sewer
- Home design: Single-family residence; One story; Ground-level entry with steps; Brick and vinyl siding construction; Asphalt roof; Located on a 0.19-acre lot (approx. 60 x 135)
- Construction: Brick and vinyl siding; Asphalt roof; Unfinished basement
- Exterior features: Porch; Fenced yard; Paved road access
Interior
- Kitchen: Dishwasher; Microwave
- Bedrooms: Total of 6 rooms (includes living spaces and bedrooms)
- Bathrooms: 2 full bathrooms
- Interior features: Gas water heater; Dishwasher; Microwave; Unfinished basement; Lighting
- Laundry & utility: Gas water heater
Neighborhood map
What this means for you Summary
Snapshot
- This is a 3-bed/2.0-bath single-family listed at $150k.
Deal economics
- At list price, monthly cash flow is $114 ($1k/yr) — positive.
- The deal already cash-flows at list — no discount required.
- Meets the 1% rule at list price ($2k rent vs $150k).
- Cap rate 7.2% vs local median 4.2% in Romulus — top-decile yield for the area; either an underpriced asset or a hidden risk that comps aren't pricing in. Stress-test before assuming the spread holds.
Location & tenants
- Location reads 60/100 on livability (#593 in MI) — a middle-class / working-renter tenant base. Strengths: cost of living A+, housing A+; Watch: commute D+, schools F, crime F.
- Romulus Community Schools (suburban): math 9% / reading 21% proficiency, ranked #498 of 540 in MI (top 92%) — low school quality limits family demand, transient renter base, plan for 1-2y turnover; 69% free/reduced lunch — lower-income household profile, screen leases tightly.
- Market conditions: 215 active listings in the ZIP; 2,639 units permitted in Wayne County in 2024 (1,216 in 5+ unit buildings).
Forward outlook
- Local home prices are declining (-3.0%/yr); year-one equity from $1k of loan paydown is wiped out by about $4k of value loss. Plan a longer hold.
- Wayne County population projected at -17% by 2050 — secular population decline; favor cash flow + early exit over multi-decade hold.
Negotiation context
- Only 4 days on market — expect competitive offers; lowballing is unlikely to land.
- 9 sale attempts since 20y ago with the ask held roughly flat each time — persistent listings suggest the price (not the market) is what's stuck; bring a comps-based counter.
Questions for the listing agent
- Built in 1967 — when were the roof, HVAC, electrical panel, plumbing, and water heater last replaced?
- Is there a deadline driving the sale (1031 exchange, divorce, estate, relocation)? That informs how much negotiation room exists.
- Schools are F-rated, which usually means shorter tenancies and higher turnover. Who's the typical renter profile here, and what's been the actual vacancy rate?
- Crime grade is F in this area — have there been break-ins, vandalism, or insurance claims at this property in the last 3 years? What carrier currently insures it and at what premium?
- What's the average days-on-market for RENTAL listings here right now (not sales)? A rising rental-DOM trend means longer vacancies and softer asking-rent achievability than the comps imply.
- What's the recent tenant-quality profile in this submarket — average credit score on applications, eviction rate, late-payment / NSF rate, and stable-employment percentage? A property-management company in the area should have these aggregated.
- How much new for-sale + rental construction is in the pipeline within 1–3 miles? Heavy new supply typically softens prices + rents 12–24 months out; constrained supply supports both.
Investment metrics
- 1% rule
- 1.05% ✓
- Cap rate
- 7.21%
- Cash-on-cash
- 3.26%
- DSCR
- 1.15
- GRM
- 8.0
CMA / ARV
- ARV (on-the-fly)
- $196,992
- Comps found
- 12
Show comp detail 12 sales within ~0.75 mi
| Address | Dist | Beds/Ba | Sqft | Sold | Price | $/sf | Match |
|---|---|---|---|---|---|---|---|
| 15760 Oakbrook St | 0.11mi | 3/1.5 | 1,148 (-0%) | 7mo | $143,000 | $125 | 86 |
| 15521 Brandt St | 0.16mi | 3/1.5 | 1,100 (-4%) | 2mo | $187,900 | $171 | 81 |
| 15700 Oakbrook St | 0.07mi | 3/1.5 | 1,050 (-9%) | 4mo | $180,000 | $171 | 76 |
| 15531 Taft St | 0.04mi | 3/1.0 | 1,200 (+4%) | 13mo | $180,000 | $150 | 76 |
| 15447 Taft St | 0.07mi | 3/1.0 | 1,056 (-8%) | 10mo | $152,500 | $144 | 71 |
| 15423 Taft St | 0.09mi | 3/1.0 | 1,320 (+15%) | 1mo | $195,000 | $148 | 67 |
| 15447 Anthony St | 0.23mi | 3/1.0 | 1,032 (-10%) | 4mo | $195,000 | $189 | 65 |
| 16432 Oakbrook St | 0.41mi | 3/1.0 | 1,152 (0%) | 17mo | $209,500 | $182 | 62 |
| 29934 Spain St | 0.42mi | 3/2.0 | 1,032 (-10%) | 2mo | $150,000 | $145 | 62 |
| 30431 Cherry Ave | 0.23mi | 3/1.0 | 1,006 (-13%) | 8mo | $175,000 | $174 | 57 |
| 16404 Brandt St | 0.40mi | 3/1.0 | 1,026 (-11%) | 10mo | $215,000 | $210 | 51 |
| 16010 Hollywood St | 0.57mi | 3/1.5 | 984 (-15%) | 13mo | $152,500 | $155 | 36 |
Match score weights: distance 35% · size 25% · config 20% · recency 20%. Top-matched comps best support the ARV.
Projected returns pro-forma
-3.0% appreciation · 3.0% rent growth · sell at horizon
- IRR
- -11.1%
- Equity multiple
- 0.60×
- Total profit
- $-16,961
- Equity at exit
- $22,365
- IRR
- -1.8%
- Equity multiple
- 0.88×
- Total profit
- $-5,095
- Equity at exit
- $12,969
Cash invested: $42,000 (down + closing). Projections, not guarantees.
Landlord ↔ Tenant lean methodology
- Overall (STATE)
- 62 Landlord-Friendly
- State Michigan
- 62 Landlord-Friendly · EVEN
- County
- — inherits STATE
- City
- — inherits STATE
ZIP-level market 48174
- Active inventory
- 215
- Price-to-rent
- 8.0×
Monthly cashflow live
- Estimated rent
- $1,568 medium interval (Pro) →
- Mortgage (P&I)
- −$787
- Tax from tax record
- −$276 /mo · $3,310/yr
- Insurance
- −$62
- HOA
- −$0
- Vacancy / Maint / Mgmt
- −$329
- Net cashflow
- $114
Break-even live
UW: 25.0% down · 7.5% · 30yr · 1.5% tax · 5.0% vac · 8.0% maint · 8.0% mgmt
Financing live
Cash to close
- Down payment
- $37,500
- Closing costs
- $4,500
- Reserves months
- —
- Total cash needed
- —
Loan-product check · same deal, 3 products live
Conventional
25% down · 7.5% · 30yr
- Down + closing
- —
- Monthly P&I
- —
- Monthly cashflow
- —
- DSCR
- —
- Eligible?
- —
Personal DTI + credit; lowest rate.
DSCR
20% down · 8.5% · 30yr
- Down + closing
- —
- Monthly P&I
- —
- Monthly cashflow
- —
- DSCR
- —
- Eligible?
- —
No personal income docs; deal must DSCR.
Hard money
10% down · 12.0% · 12mo
- Down + closing
- —
- Monthly P&I
- —
- Monthly cashflow
- —
- DSCR
- —
- Eligible?
- —
Short-term bridge; refi at stabilization.
Listing history 3 events
-
2026-06-08statusdays on market $150,000 Pending 4 DOM
-
2026-06-07remarks 699-char remark
-
2026-06-07$150,000 Active 3 DOM
ⓘ Source: listings_history table (triggers on properties + properties_extension) + one-shot
backfill from property_details.listing_events for pre-trigger history.
Tax reassessment forecast MI · Partial reset (capped growth)
- Current annual tax
- $3,310 · $276/mo
- Projected year-2 tax
- $3,310 · $276/mo
- Expected delta
- $0/yr ($0/mo · 0.0%)
ⓘ Screening estimate from a state-policy table — verify with the county assessor before closing.
Climate risk First Street
- Flood 1/10 Low FEMA zone X (unshaded) · 0% chance over 30 yrs
- Wildfire 2/10 Low
- Heat 3/10 Moderate 7 d/yr ≥97°F today · 15 d/yr by 30 yrs out
- Wind 2/10 Low
- Air quality 2/10 Low 1 unhealthy d/yr today · 3 by 30 yrs out
Nearby sold comps map
Loading sold comps map…
Walkable amenities ~0.75 mi
Loading nearby amenities…
Taxation est. · year 1
- Rental income
- $18,821
- − Mortgage interest
- −$8,402
- − Property taxes
- −$3,310
- − Insurance
- −$750
- − Repairs & maintenance
- −$1,506
- − Management
- −$1,506
- − Depreciation
- −$4,364
- Taxable loss
- −$1,016
- Est. tax savings @ 24.0%
- +$244
- After-tax cash flow
- $1,613/yr
For passive investors: Depreciation is non-cash, so a rental often shows a tax loss while cash-flowing — sheltering income. Rental losses are passive: they offset passive income freely, and up to $25,000/yr can offset ordinary (W-2) income if you actively participate and your MAGI is under $100k (phasing out to $0 by $150k); unused losses carry forward. On sale, claimed depreciation is recaptured at up to 25%, and gains may owe capital-gains tax (a 1031 exchange can defer both). Figures are a year-1 estimate at your 24.0% rate — not tax advice; consult a CPA.
Schools (NCES district)
- District
- Romulus Community Schools
- NCES district ID
- 2630120
- Math proficiency
- 9% ▼ -14.00%
- Reading proficiency
- 21% ▼ -9.00%
- Median HH income
- $44,165
- Composite
- 13.17/100
- National rank
- #9556
- State rank
- #498 of 540 in MI
Livability — Romulus
- Score
- 60/100
- State rank
- #593
- US rank
- #19387
Category grades
Schools grade is shown separately in the Schools card above.
Census & demographics
- Census place
- Romulus, MI
- County
- Wayne County · 1,562,939 people
- City population
- 32,211
- Metro
- Detroit-Warren-Dearborn, MI
- Population (ZIP)
- 32,211
- Household income
- $67,056
- Rent vs Own
- Severe rent burden
- 755.0
Population outlook (Wayne County) Hauer SSP2
- Today (2025)
- 1,675,273 people
- By 2030
- 1,620,300 · -3.3%
- By 2040
- 1,502,341 · -10.3%
- By 2050
- 1,384,039 · -17.4%
- By 2075
- 1,124,592 · -32.9%
- By 2100
- 881,193 · -47.4%
Race, ethnicity, and origin ACS 2023
- Neighborhood character
- Diverse neighborhood (Simpson 0.59)
- Race & ethnicity
- White 52% Black 37% Two or more races 8% Hispanic / Latino 2% Asian 1%
- Common ancestry
- Romanian 6% Lithuanian 3% Italian 2%
- Foreign-born
- 4% · Canada, Vietnam
- Languages at home
- 94% English-only · Spanish 2% Other Indo-European 1% Other Asian/Pacific 1%
Political lean MEDSL · Wayne
- 2024 margin
- Strong D (+29.0) · D 62.7% · R 33.7% · Other 3.6%
- 2008→2024 swing
- -20.5pp toward R · 2008: 49.5pp · 2024: 29.0pp
- All cycles
- 2024: D+29.0 2020: D+38.1 2016: D+37.3 2012: D+46.9 2008: D+49.5
Not yet ingested
- Civics
- —
Market trends
- HPI YoY
- ▼ -171.93%
- Current HPI
- 207.8345
- Rent YoY
- —
- Metro
- Detroit-Warren-Dearborn, MI
- State GDP YoY
- ▲ 1.37%
- F500 in state
- 28
Industry mix (Fortune 500 HQ in MI)
| Industry | F500 HQs | Revenue |
|---|---|---|
| Automotive Parts | 3 | $48B |
|
||
| Automotive | 2 | $372B |
|
||
| Chemicals | 1 | $45B |
|
||
| Automotive Retail | 1 | $29B |
|
||
| Healthcare / Medical Devices | 1 | $23B |
|
||
| Automotive Technology | 1 | $20B |
|
||
Price history
+66.9% since first listed21 events — show timeline
- 2026-06-05 Listed $150,000 MiRealSource-MiMLS
- 2026-06-05 Listed $150,000 REALCOMP
- 2026-06-04 Coming Soon $150,000 MiRealSource-MiMLS
- 2020-12-31 Sold (MLS) $145,000 MiRealSource-MiMLS
- 2020-12-31 Sold (MLS) $145,000 REALCOMP
- 2020-12-07 Pending — MiRealSource-MiMLS
- 2020-12-07 Pending — REALCOMP
- 2020-12-03 Listed $144,990 MiRealSource-MiMLS
- 2020-12-03 Listed $144,990 REALCOMP
- 2011-01-26 Sold (MLS) $26,000 REALCOMP
- 2011-01-26 Sold (MLS) $26,000 MiRealSource-MiMLS
- 2010-12-05 Listed $28,000 REALCOMP
- 2010-12-05 Listed $28,000 MiRealSource-MiMLS
- 2006-11-20 Sold (Public Records) $83,500 Public Records
- 2006-10-27 Sold (MLS) $83,500 MiRealSource-MiMLS
- 2006-10-27 Sold (MLS) $83,500 REALCOMP
- 2006-10-27 Sold (MLS) $83,500 REALCOMP
- 2006-09-29 Listing Removed — MiRealSource-MiMLS
- 2006-07-13 Listed $89,900 REALCOMP
- 2006-05-19 Listed $89,900 MiRealSource-MiMLS
- 2006-05-19 Listed $89,900 REALCOMP
Property tax history
+3.6%/yrLatest (2025): $3,310 · -0.0% YoY. Source: county tax records.
Cash-flow waterfall
monthlySold comps — $/sqft
last 12 mo · ≤1 miLoading sold comps…