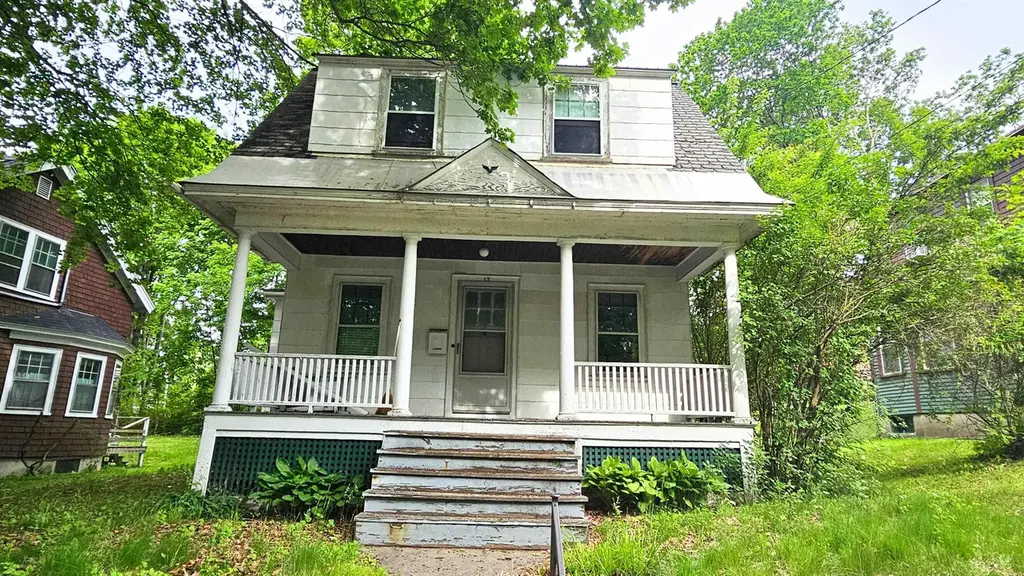
17 Clement Rd · Springfield, VT
Flood risk 1/10 · Minimal
- FEMA flood zone
- X (unshaded)
- Chance of flooding over 30 yrs
- 0.0%
- Est. flood insurance / yr
- $473 – $860
Fire risk 3/10 · Minor
- Est. fire insurance / yr
- $480 – $892
Heat risk 3/10 · Minor
- Hot days now (above 92°F)
- 7 days/yr
- Hot days in 30 yrs
- 17 days/yr
Wind risk 3/10 · Minor
- Chance of severe wind over 30 yrs
- 7.0%
Air-quality risk 1/10 · Minimal
- Unhealthy air days now
- 0 days/yr
- Unhealthy air days in 30 yrs
- 0 days/yr
Risk factors via First Street. Map © Google.
Why this score? — see what drove the B+ grade
The composite is a weighted blend of 9 inputs, each scored 0–100. Each bar is that input's sub-score; the figure is the points it added to the 100-point composite (weight × sub-score).
- Cash flow +30.0/30.0
- ARV discount +15.0/15.0
- 1% rule +10.0/10.0
- DSCR +10.0/10.0
- Schools +5.0/10.0
- Livability +3.7/5.0
- Rent growth +2.5/5.0
- Condition / age +2.5/5.0
- Appreciation +0.0/10.0
$109,000
🖨 Deal sheet (PDF) 📄 Offer letter ✓ Due diligence
Listing remarks
Opportunity awaits at 17 Clement Road in Springfield. This 3 bedroom, 2 bath home is situated in an established neighborhood with convenient access to shopping, services, and the local hospital. Having been vacant for more than 20 years, the property is in need of rehabilitation and is being offered as a project for buyers ready to bring new life to the home. Whether you're looking to renovate and build equity as an owner-occupant, create a rental investment, or pursue a fix & flip opportunity, this property offers significant potential. The existing footprint and location provide a solid foundation for your vision and improvements. Bring your ideas and creativity to unlock the possib
Key facts
- Solid foundation
- Local hospital
- Existing footprint
Tags
Property features AI
Exterior
- Utilities: Public water; Public sewer; 100 amp electric service with circuit breakers; High-speed internet available; Cable available; Telephone service available
- Home design: Other architectural style; White exterior
- Construction: Built in 1905; Wood frame construction with asbestos exterior; Metal and asphalt shingle roof
- Exterior features: Located in town with sidewalks; Near shopping, hospital, and schools; Neighborhood setting
Interior
- Kitchen: Electric range; Refrigerator; Garbage disposal
- Bathrooms: One full bathroom; One half bathroom
- Heating & cooling: Oil heat; Steam heating
- Interior features: Five total rooms; Unfinished basement with interior stair access
Neighborhood map
What this means for you Summary
Snapshot
- This is a 3-bed/1.5-bath single-family listed at $109k.
Deal economics
- At list price, monthly cash flow is $782 ($9k/yr) — positive.
- The deal already cash-flows at list — no discount required.
- Meets the 1% rule at list price ($2k rent vs $109k).
- Cap rate 14.9% vs local median 5.1% in Springfield — top-decile yield for the area; either an underpriced asset or a hidden risk that comps aren't pricing in. Stress-test before assuming the spread holds.
Location & tenants
- Location reads 73/100 on livability (#21 in VT) — a middle-class / working-renter tenant base. Strengths: cost of living A+, health & safety A+, crime A; Watch: amenities F, commute F, employment F.
- Market conditions: 50 active listings in the ZIP; 3 comparable units currently listed for rent nearby; rentals lingering (median 45d on market — plan ~5-8 weeks vacancy on turnover, expect pricing pressure); 100% of comp listings sitting > 30 days — soft ceiling on asking rent; 339 units permitted in Windsor County in 2024 (240 in 5+ unit buildings).
Forward outlook
- Local home prices are declining (-3.0%/yr); year-one equity from $754 of loan paydown is wiped out by about $3k of value loss. Plan a longer hold.
- Windsor County population projected at -21% by 2050 — secular population decline; favor cash flow + early exit over multi-decade hold.
- At projected returns (-3.0% appreciation + 3.0% rent growth), your $31k cash investment doubles in ~4 years — after that, you're playing with house money.
Negotiation context
- Only 13 days on market — expect competitive offers; lowballing is unlikely to land.
Risks & watch-outs
- Watch-outs: built in 1905 — expect roof / HVAC / electrical / plumbing capex.
Questions for the listing agent
- Built in 1905 — when were the roof, HVAC, electrical panel, plumbing, and water heater last replaced?
- Is there a deadline driving the sale (1031 exchange, divorce, estate, relocation)? That informs how much negotiation room exists.
- Schools are B-rated — typically a magnet for longer-tenancy family renters. What's the average tenant stay here, and is there a school-zone premium baked into asking?
- What's the average days-on-market for RENTAL listings here right now (not sales)? A rising rental-DOM trend means longer vacancies and softer asking-rent achievability than the comps imply.
- What's the recent tenant-quality profile in this submarket — average credit score on applications, eviction rate, late-payment / NSF rate, and stable-employment percentage? A property-management company in the area should have these aggregated.
- How much new for-sale + rental construction is in the pipeline within 1–3 miles? Heavy new supply typically softens prices + rents 12–24 months out; constrained supply supports both.
Investment metrics
- 1% rule
- 1.70% ✓
- Cap rate
- 14.90%
- Cash-on-cash
- 30.76%
- DSCR
- 2.37
- GRM
- 4.9
CMA / ARV
- ARV (on-the-fly)
- $206,190
- Comps found
- 10
Show comp detail 10 sales within ~0.75 mi
| Address | Dist | Beds/Ba | Sqft | Sold | Price | $/sf | Match |
|---|---|---|---|---|---|---|---|
| 35 Clement Rd | 0.04mi | 3/1.5 | 1,179 (-0%) | 5mo | $190,000 | $161 | 93 |
| 29 Coolidge St | 0.09mi | 3/2.0 | 1,207 (+2%) | 14mo | $210,000 | $174 | 80 |
| 21 Herrick St | 0.26mi | 2/1.0 (-1) | 1,188 (+0%) | 13mo | $185,000 | $156 | 69 |
| 226 Fellows Hill Rd | 0.51mi | 3/1.0 | 1,075 (-9%) | 6mo | $60,000 | $56 | 54 |
| 8 Curtis St | 0.62mi | 3/1.0 | 1,154 (-3%) | 18mo | $160,000 | $139 | 49 |
| 16 Brierbrook Ln | 0.69mi | 3/1.0 | 1,109 (-6%) | 8mo | $185,000 | $167 | 48 |
| 28 Craigue Hill Rd | 0.65mi | 3/1.0 | 1,221 (+3%) | 23mo | $227,500 | $186 | 43 |
| 16 Mary St | 0.54mi | 2/1.5 (-1) | 1,048 (-12%) | 13mo | $201,000 | $192 | 40 |
| 139 Union St | 0.71mi | 3/1.5 | 1,253 (+6%) | 21mo | $240,000 | $192 | 39 |
| 15 Grove St | 0.74mi | 2/1.0 (-1) | 1,356 (+14%) | 0mo | $241,000 | $178 | 34 |
Match score weights: distance 35% · size 25% · config 20% · recency 20%. Top-matched comps best support the ARV.
Projected returns pro-forma
-3.0% appreciation · 3.0% rent growth · sell at horizon
- IRR
- 25.5%
- Equity multiple
- 2.05×
- Total profit
- $32,141
- Equity at exit
- $16,252
- IRR
- 33.2%
- Equity multiple
- 4.02×
- Total profit
- $92,072
- Equity at exit
- $9,424
Cash invested: $30,520 (down + closing). Projections, not guarantees.
Landlord ↔ Tenant lean methodology
- Overall (STATE)
- 41 Moderately Tenant-Leaning
- State Vermont
- 41 Moderately Tenant-Leaning · D+15
- County
- — inherits STATE
- City
- — inherits STATE
ZIP-level market 05156
- Home prices YoY
- -12.2%
- Active inventory
- 50
- Price-to-rent
- 4.9×
Monthly cashflow live
- Estimated rent
- $1,853 medium interval (Pro) →
- Mortgage (P&I)
- −$572
- Tax from tax record
- −$64 /mo · $771/yr
- Insurance
- −$45
- HOA
- −$0
- Vacancy / Maint / Mgmt
- −$389
- Net cashflow
- $782
Break-even live
Sensitivity live
| Price | -10% $844 | -5% $813 | +0% $782 | +5% $751 | +10% $721 |
|---|---|---|---|---|---|
| Rent | -10% $636 | -5% $709 | +0% $782 | +5% $855 | +10% $929 |
| Rate | -1.0pp $837 | -0.5pp $810 | base $782 | +0.5pp $754 | +1.0pp $725 |
UW: 25.0% down · 7.5% · 30yr · 1.5% tax · 5.0% vac · 8.0% maint · 8.0% mgmt
Financing live
Cash to close
- Down payment
- $27,250
- Closing costs
- $3,270
- Reserves months
- —
- Total cash needed
- —
Loan-product check · same deal, 3 products live
Conventional
25% down · 7.5% · 30yr
- Down + closing
- —
- Monthly P&I
- —
- Monthly cashflow
- —
- DSCR
- —
- Eligible?
- —
Personal DTI + credit; lowest rate.
DSCR
20% down · 8.5% · 30yr
- Down + closing
- —
- Monthly P&I
- —
- Monthly cashflow
- —
- DSCR
- —
- Eligible?
- —
No personal income docs; deal must DSCR.
Hard money
10% down · 12.0% · 12mo
- Down + closing
- —
- Monthly P&I
- —
- Monthly cashflow
- —
- DSCR
- —
- Eligible?
- —
Short-term bridge; refi at stabilization.
Rent comps 3 comps
| Address | Beds | Baths | Sqft | Rent | $/sqft | DOM | Units | Dist |
|---|---|---|---|---|---|---|---|---|
| 104 Park St Apt 2 Springfield, VT | 3.0 | 1.0 | 1150 | $1,645 | $1.43 | 44d | 1 | 0.40mi |
| 104 Park St Apt 4 Springfield, VT | 2.0 | 1.0 | 950 | $1,362 | $1.43 | 44d | 1 | 0.40mi |
| 39 Summit Ave Unit Na Springfield, VT | 2.0 | 2.0 | 1150 | $2,750 | $2.39 | 44d | 1 | 0.58mi |
Listing history 11 events
-
2026-06-19days on market $109,000 Active 13 DOM
-
2026-06-18days on market $109,000 Active 12 DOM
-
2026-06-17days on market $109,000 Active 11 DOM
-
2026-06-16days on market $109,000 Active 10 DOM
-
2026-06-15days on market $109,000 Active 9 DOM
-
2026-06-14days on market $109,000 Active 7 DOM
-
2026-06-12days on market $109,000 Active 6 DOM
-
2026-06-09days on market $109,000 Active 3 DOM
-
2026-06-08days on market $109,000 Active 2 DOM
-
2026-06-07remarks 695-char remark
-
2026-06-07$109,000 Active 1 DOM
ⓘ Source: listings_history table (triggers on properties + properties_extension) + one-shot
backfill from property_details.listing_events for pre-trigger history.
Tax reassessment forecast VT · Partial reset (capped growth)
- Current annual tax
- $771 · $64/mo
- Projected year-2 tax
- $1,421 · $118/mo
- Expected delta
- +$650/yr (+$54/mo · 84.3%)
ⓘ Screening estimate from a state-policy table — verify with the county assessor before closing.
Climate risk First Street
- Flood 1/10 Low FEMA zone X (unshaded) · 0% chance over 30 yrs
- Wildfire 3/10 Moderate
- Heat 3/10 Moderate 7 d/yr ≥92°F today · 17 d/yr by 30 yrs out
- Wind 3/10 Moderate 7% chance of damaging wind over 30 yrs
- Air quality 1/10 Low 0 unhealthy d/yr today · 0 by 30 yrs out
Nearby sold comps map
Loading sold comps map…
Walkable amenities ~0.75 mi
Loading nearby amenities…
Taxation est. · year 1
- Rental income
- $22,231
- − Mortgage interest
- −$6,106
- − Property taxes
- −$771
- − Insurance
- −$545
- − Repairs & maintenance
- −$1,778
- − Management
- −$1,778
- − Depreciation
- −$3,171
- Taxable income
- $8,081
- Est. tax owed @ 24.0%
- −$1,939
- After-tax cash flow
- $7,447/yr
For passive investors: Depreciation is non-cash, so a rental often shows a tax loss while cash-flowing — sheltering income. Rental losses are passive: they offset passive income freely, and up to $25,000/yr can offset ordinary (W-2) income if you actively participate and your MAGI is under $100k (phasing out to $0 by $150k); unused losses carry forward. On sale, claimed depreciation is recaptured at up to 25%, and gains may owe capital-gains tax (a 1031 exchange can defer both). Figures are a year-1 estimate at your 24.0% rate — not tax advice; consult a CPA.
Schools (NCES district)
No district data.
Livability — Springfield
- Score
- 73/100
- State rank
- #21
- US rank
- #5125
Category grades
Schools grade is shown separately in the Schools card above.
Census & demographics
- Census place
- Springfield, VT
- Population (ZIP)
- 9,028
Population outlook (Windsor County) Hauer SSP2
- Today (2025)
- 53,235 people
- By 2030
- 51,269 · -3.7%
- By 2040
- 46,517 · -12.6%
- By 2050
- 41,859 · -21.4%
- By 2075
- 33,298 · -37.5%
- By 2100
- 24,523 · -53.9%
Race, ethnicity, and origin ACS 2023
- Neighborhood character
- Predominantly White (93%)
- Race & ethnicity
- White 93% Two or more races 5% Hispanic / Latino 3%
- Common ancestry
- Lithuanian 13% Romanian 4% Serbian 3%
- Foreign-born
- 2% · Canada
- Languages at home
- 96% English-only · Spanish 2% French/Haitian/Cajun 1%
Political lean MEDSL · Windsor
- 2024 margin
- Solid D (+35.6) · D 66.3% · R 30.7% · Other 2.9%
- 2008→2024 swing
- -4.1pp toward R · 2008: 39.7pp · 2024: 35.6pp
- All cycles
- 2024: D+35.6 2020: D+38.9 2016: D+32.1 2012: D+38.1 2008: D+39.7
Not yet ingested
- Civics
- —
Market trends
- HPI YoY
- ▼ -43.22%
- Current HPI
- 310.0154
- Rent YoY
- —
- Metro
- —
- State GDP YoY
- —
- F500 in state
- 0
Price history
1 event — show timeline
- 2026-06-06 Listed $109,000 PrimeMLS
Property tax history
-6.9%/yrLatest (2024): $771 · +10.5% YoY. Source: county tax records.
Cash-flow waterfall
monthlySold comps — $/sqft
last 12 mo · ≤1 miLoading sold comps…