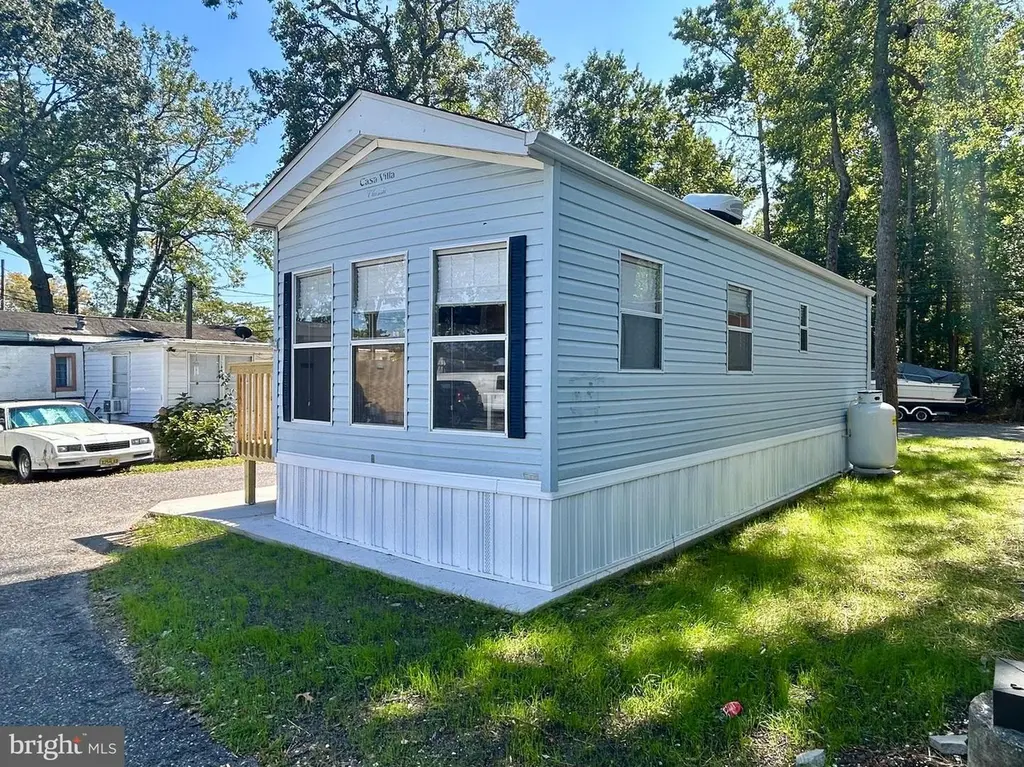
104 S 5th St #39 · Whitesboro, NJ
Flood risk No data
- FEMA flood zone
- —
- Chance of flooding over 30 yrs
- —
- Est. flood insurance / yr
- —
Fire risk No data
- Est. fire insurance / yr
- —
Heat risk No data
- Hot days now (above threshold)
- —
- Hot days in 30 yrs
- —
Wind risk No data
- Chance of severe wind over 30 yrs
- —
Air-quality risk No data
- Unhealthy air days now
- —
- Unhealthy air days in 30 yrs
- —
Risk factors via First Street. Map © Google.
Why this score? — see what drove the B+ grade
The composite is a weighted blend of 9 inputs, each scored 0–100. Each bar is that input's sub-score; the figure is the points it added to the 100-point composite (weight × sub-score).
- Cash flow +30.0/30.0
- 1% rule +10.0/10.0
- DSCR +10.0/10.0
- Appreciation +10.0/10.0
- ARV discount +7.5/15.0
- Condition / age +4.0/5.0
- Livability +3.2/5.0
- Rent growth +2.5/5.0
- Schools +2.4/10.0
$44,900
🖨 Deal sheet (PDF) 📄 Offer letter ✓ Due diligence
Listing remarks
CLOSE to BEACH! LOW LOT RENT! Charming 1-Bedroom, 1-Bathroom Mobile Home - Close to the Beach! Welcome to your coastal retreat! This newly renovated 1-bedroom, 1-bathroom mobile home offers the perfect blend of modern comfort and beachy charm. Located just minutes from the sand and surf, this home is ideal for those looking to enjoy the relaxed beach lifestyle. Step inside to find a bright and airy open-concept living space, with fresh paint, brand-new flooring, and contemporary finishes throughout. The spacious living area is perfect for unwinding after a day at the beach, while the updated kitchen features sleek countertops, standard size appliances, and ample storage for all your culin
Key facts
- Updated kitchen
- Close to beach
- Newly renovated
Tags
Property features AI
Finance
- Other: Annual ground rent listed under income/expense
- Financial info: Lease not considered
- HOA & community: Land lease with monthly ground rent; Ground rent exists; Land lease amount $650 monthly; 99 years remaining on land lease; Property manager present; Pets allowed with restrictions (breed, number, size/weight) and pet addendum/deposit
Exterior
- Parking: On-street parking (no fee)
- Utilities: Private/community water; Community septic tank; Electric cooling fuel; Propane hot water and heating (leased)
- Home design: Manufactured single-wide home; Estimated major remodel in 2025; Estimated year built (source: estimated)
- Construction: Aluminum siding; Shingle roof; Slab foundation
- Exterior features: Corner lot; Porch(es); Above-grade outdoor structures
Interior
- Kitchen: Refrigerator; Single oven; Microwave; Kitchen island
- Bedrooms: One bedroom on the main level
- Flooring: Carpet
- Bathrooms: One full bathroom on the main level
- Heating & cooling: 90% forced air heating; Propane hot water; Propane (leased) heating fuel; Ceiling fan cooling (electric)
- Interior features: Open floor plan; Combination kitchen and living area; Galley kitchen with island; Tub/shower; Window treatments; Carpeted areas; Furnished
- Laundry & utility: No basement
Neighborhood map
What this means for you Summary
Snapshot
- This is a 1-bed/1.0-bath single-family listed at $45k. Condition is rated good.
Deal economics
- At list price, monthly cash flow is $428 ($5k/yr) — positive.
- The deal already cash-flows at list — no discount required.
- Meets the 1% rule at list price ($935 rent vs $45k).
- Recommended offer: $42k (6.0% below list) — sets the bar for market timing.
Location & tenants
- Location reads 64/100 on livability (#400 in NJ) — a middle-class / working-renter tenant base. Strengths: crime A+, housing A+, employment B; Watch: schools F, amenities F, commute D-.
- Middle Township Public School District (suburban): math 15% / reading 38% proficiency, ranked #372 of 472 in NJ (top 79%) — low school quality limits family demand, transient renter base, plan for 1-2y turnover.
- Market conditions: 72 active listings in the ZIP; 877 units permitted in Cape May County in 2024 (35 in 5+ unit buildings).
Forward outlook
- In year one you build about $5k of equity ($310 loan paydown + $4k appreciation (10.0% local appreciation)).
- Cape May County population projected at -24% by 2050 — secular population decline; favor cash flow + early exit over multi-decade hold.
- At projected returns (10.0% appreciation + 3.0% rent growth), your $13k cash investment doubles in ~2 years — after that, you're playing with house money.
- By year 7, paydown + projected appreciation supports a ~$35k cash-out refi (75% LTV) — recoverable capital for the next deal without selling this one.
Negotiation context
- It's been on market 77 days — a 6% lower offer ($42k) is reasonable based on typical stale-listing flexibility.
- 2 sale attempts; this cycle's ask has dropped $5k (10%) from the opening price — seller is motivated, your offer sets the floor, not the list.
Questions for the listing agent
- It's been on market 77 days. Have you received any prior offers? Is the seller open to a 6% concession, seller financing, or rate buy-down credit?
- Why hasn't it sold? Are there any deal-killer items the seller is aware of (foundation, flood, title, zoning, code violations)?
- Is there a deadline driving the sale (1031 exchange, divorce, estate, relocation)? That informs how much negotiation room exists.
- Schools are F-rated, which usually means shorter tenancies and higher turnover. Who's the typical renter profile here, and what's been the actual vacancy rate?
- What's the average days-on-market for RENTAL listings here right now (not sales)? A rising rental-DOM trend means longer vacancies and softer asking-rent achievability than the comps imply.
- What's the recent tenant-quality profile in this submarket — average credit score on applications, eviction rate, late-payment / NSF rate, and stable-employment percentage? A property-management company in the area should have these aggregated.
- How much new for-sale + rental construction is in the pipeline within 1–3 miles? Heavy new supply typically softens prices + rents 12–24 months out; constrained supply supports both.
Investment metrics
- 1% rule
- 2.08% ✓
- Cap rate
- 17.74%
- Cash-on-cash
- 40.87%
- DSCR
- 2.82
- GRM
- 4.0
CMA / ARV
No comps found within radius.
Projected returns pro-forma
10.0% appreciation · 3.0% rent growth · sell at horizon
- IRR
- 55.9%
- Equity multiple
- 5.12×
- Total profit
- $51,739
- Equity at exit
- $40,449
- IRR
- 49.5%
- Equity multiple
- 11.42×
- Total profit
- $130,946
- Equity at exit
- $87,231
Cash invested: $12,572 (down + closing). Projections, not guarantees.
Landlord ↔ Tenant lean methodology
- Overall (STATE)
- 21 Tenant-Leaning
- State New Jersey
- 21 Tenant-Leaning · D+6
- County
- — inherits STATE
- City
- — inherits STATE
ZIP-level market 08242
- Home prices YoY
- 14.2%
- Active inventory
- 72
- Price-to-rent
- 4.0×
Monthly cashflow live
- Estimated rent
- $935 medium interval (Pro) →
- Mortgage (P&I)
- −$235
- Tax est. 1.5%
- −$56 /mo · $674/yr
- Insurance
- −$19
- HOA
- −$0
- Vacancy / Maint / Mgmt
- −$196
- Net cashflow
- $428
Break-even live
Sensitivity live
| Price | -10% $459 | -5% $444 | +0% $428 | +5% $413 | +10% $397 |
|---|---|---|---|---|---|
| Rent | -10% $354 | -5% $391 | +0% $428 | +5% $465 | +10% $502 |
| Rate | -1.0pp $451 | -0.5pp $440 | base $428 | +0.5pp $417 | +1.0pp $405 |
UW: 25.0% down · 7.5% · 30yr · 1.5% tax · 5.0% vac · 8.0% maint · 8.0% mgmt
Financing live
Cash to close
- Down payment
- $11,225
- Closing costs
- $1,347
- Reserves months
- —
- Total cash needed
- —
Loan-product check · same deal, 3 products live
Conventional
25% down · 7.5% · 30yr
- Down + closing
- —
- Monthly P&I
- —
- Monthly cashflow
- —
- DSCR
- —
- Eligible?
- —
Personal DTI + credit; lowest rate.
DSCR
20% down · 8.5% · 30yr
- Down + closing
- —
- Monthly P&I
- —
- Monthly cashflow
- —
- DSCR
- —
- Eligible?
- —
No personal income docs; deal must DSCR.
Hard money
10% down · 12.0% · 12mo
- Down + closing
- —
- Monthly P&I
- —
- Monthly cashflow
- —
- DSCR
- —
- Eligible?
- —
Short-term bridge; refi at stabilization.
Listing history 13 events
-
2026-06-09statusdays on market $44,900 Pending 77 DOM
-
2026-06-08days on market $44,900 Active 76 DOM
-
2026-06-07days on market $44,900 Active 75 DOM
-
2026-06-07days on market $44,900 Active 74 DOM
-
2026-06-04days on market $44,900 Active 71 DOM
-
2026-06-02days on market $44,900 Active 70 DOM
-
2026-06-01days on market $44,900 Active 69 DOM
-
2026-05-31days on market $44,900 Active 68 DOM
-
2026-04-21price $44,900
-
2026-03-24$49,990 Active
-
2026-03-18historical
-
2025-12-16price $49,900
-
2025-10-09$59,900 Active
ⓘ Source: listings_history table (triggers on properties + properties_extension) + one-shot
backfill from property_details.listing_events for pre-trigger history.
Nearby sold comps map
Loading sold comps map…
Walkable amenities ~0.75 mi
Loading nearby amenities…
Taxation est. · year 1
- Rental income
- $11,217
- − Mortgage interest
- −$2,515
- − Property taxes
- −$674
- − Insurance
- −$224
- − Repairs & maintenance
- −$897
- − Management
- −$897
- − Depreciation
- −$1,306
- Taxable income
- $4,703
- Est. tax owed @ 24.0%
- −$1,129
- After-tax cash flow
- $4,009/yr
For passive investors: Depreciation is non-cash, so a rental often shows a tax loss while cash-flowing — sheltering income. Rental losses are passive: they offset passive income freely, and up to $25,000/yr can offset ordinary (W-2) income if you actively participate and your MAGI is under $100k (phasing out to $0 by $150k); unused losses carry forward. On sale, claimed depreciation is recaptured at up to 25%, and gains may owe capital-gains tax (a 1031 exchange can defer both). Figures are a year-1 estimate at your 24.0% rate — not tax advice; consult a CPA.
Condition & rehab AI · 12 photos
This newly renovated mobile home offers a charming and modern beach retreat with updated interiors and a fresh exterior. Ideal for both resale and rental markets.
Value-add opportunities
- Both Painting the exterior — Enhances curb appeal and value
- Resale Upgrading the kitchen appliances — Modernizes the space and attracts buyers
- Rental Adding a small deck or patio — Improves outdoor living space and rental appeal
Renovation cost estimate screening
Value-add ROI direction
- Both Painting the exterior — Enhances curb appeal and value ↑
- Resale Upgrading the kitchen appliances — Modernizes the space and attracts buyers ↑
- Rental Adding a small deck or patio — Improves outdoor living space and rental appeal ↑
ⓘ Cost ranges are severity-bucket heuristics (US national rule-of-thumb). Get contractor quotes + a written scope before underwriting a rehab budget.
Schools (NCES district)
- District
- Middle Township Public School District
- NCES district ID
- 3410020
- Math proficiency
- 15% ▼ -18.00%
- Reading proficiency
- 38% ▼ -7.00%
- Median HH income
- $59,228
- Composite
- 24.09/100
- National rank
- #7754
- State rank
- #372 of 472 in NJ
Livability — Whitesboro
- Score
- 64/100
- State rank
- #400
- US rank
- #13908
Category grades
Schools grade is shown separately in the Schools card above.
Census & demographics
- Census place
- Whitesboro, NJ
- Population (ZIP)
- 4,021
Population outlook (Cape May County) Hauer SSP2
- Today (2025)
- 88,234 people
- By 2030
- 84,144 · -4.6%
- By 2040
- 75,146 · -14.8%
- By 2050
- 67,389 · -23.6%
- By 2075
- 55,732 · -36.8%
- By 2100
- 44,972 · -49.0%
Race, ethnicity, and origin ACS 2023
- Neighborhood character
- Predominantly White (69%)
- Race & ethnicity
- White 69% Hispanic / Latino 17% Two or more races 11% Black 7%
- Hispanic origin (detail)
- Mexican 5% Puerto Rican 10%
- Common ancestry
- Romanian 4% Slovak 2% Lithuanian 1%
- Foreign-born
- 6% · Canada
- Languages at home
- 85% English-only · Spanish 11% Russian/Polish/Slavic 2% Arabic 1%
Political lean MEDSL · Cape May
- 2024 margin
- R (+19.2) · D 39.7% · R 58.9% · Other 1.4%
- 2008→2024 swing
- -10.6pp toward R · 2008: -8.7pp · 2024: -19.2pp
- All cycles
- 2024: R+19.2 2020: R+15.9 2016: R+19.9 2012: R+8.9 2008: R+8.7
Not yet ingested
- Civics
- —
Market trends
- HPI YoY
- ▲ 51.53%
- Current HPI
- 414.7401
- Rent YoY
- —
- Metro
- —
- State GDP YoY
- ▲ 2.05%
- F500 in state
- 34
Industry mix (Fortune 500 HQ in NJ)
| Industry | F500 HQs | Revenue |
|---|---|---|
| Consumer Goods | 3 | $31B |
|
||
| Pharmaceuticals | 2 | $153B |
|
||
| Technology | 2 | $21B |
|
||
| Insurance | 2 | $20B |
|
||
| Healthcare | 2 | $19B |
|
||
| Financial Services | 1 | $70B |
|
||
Price history
-25.0% since first listed5 events — show timeline
- 2026-04-21 Price Changed $44,900 BRIGHT MLS
- 2026-03-24 Listed $49,990 BRIGHT MLS
- 2026-03-18 Listing Removed — BRIGHT MLS
- 2025-12-16 Price Changed $49,900 BRIGHT MLS
- 2025-10-09 Listed $59,900 BRIGHT MLS
Cash-flow waterfall
monthlySold comps — $/sqft
last 12 mo · ≤1 miLoading sold comps…