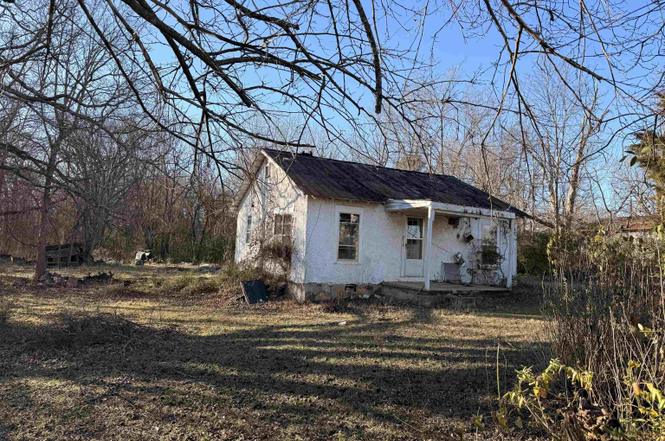
218 N Oak St · Salem, AR
Flood risk No data
- FEMA flood zone
- —
- Chance of flooding over 30 yrs
- —
- Est. flood insurance / yr
- —
Fire risk No data
- Est. fire insurance / yr
- —
Heat risk No data
- Hot days now (above threshold)
- —
- Hot days in 30 yrs
- —
Wind risk No data
- Chance of severe wind over 30 yrs
- —
Air-quality risk No data
- Unhealthy air days now
- —
- Unhealthy air days in 30 yrs
- —
Risk factors via First Street. Map © Google.
Why this score? — see what drove the C- grade
The composite is a weighted blend of 9 inputs, each scored 0–100. Each bar is that input's sub-score; the figure is the points it added to the 100-point composite (weight × sub-score).
- Cash flow +15.0/30.0
- ARV discount +7.5/15.0
- Appreciation +6.2/10.0
- 1% rule +5.0/10.0
- DSCR +5.0/10.0
- Schools +4.5/10.0
- Livability +3.2/5.0
- Rent growth +2.5/5.0
- Condition / age +2.5/5.0
$19,500
🖨 Deal sheet 📄 Offer letter ✓ Due diligence
Listing remarks
Fixer-upper with tons of potential! This small cottage-style home sits on a quiet, wooded lot and is ready for a full transformation. Surrounded by mature trees and natural privacy, the setting offers a peaceful, rural feel while still being accessible. The home features a simple layout, a covered front porch, and a solid footprint, an ideal canvas for a renovation or rebuild.
Key facts
- Covered front porch
- Wooded lot
- Peaceful rural feel
Tags
Property features AI
Exterior
- Home design: Single-family residence; Residential property
- Exterior features: Approximately 0.4-acre lot
Interior
- Bathrooms: 1 full bathroom
- Interior features: One full bathroom
Neighborhood map
What this means for you Summary
Snapshot
- This is a 2-bed/1.0-bath single-family listed at $20k.
Deal economics
- At list price, monthly cash flow is $553 ($7k/yr) — positive.
- The deal already cash-flows at list — no discount required.
- Meets the 1% rule at list price ($848 rent vs $20k).
- Recommended offer: $17k (12.0% below list) — sets the bar for market timing.
- Cap rate 40.3% vs local median 3.2% in Salem — top-decile yield for the area; either an underpriced asset or a hidden risk that comps aren't pricing in. Stress-test before assuming the spread holds.
Location & tenants
- Location reads 65/100 on livability (#148 in AR) — a middle-class / working-renter tenant base. Strengths: cost of living A+, schools B; Watch: amenities F, commute F, employment F.
- Salem School District (rural): math 53% / reading 55% proficiency, ranked #10 of 238 in AR (top 4%) — acceptable for families but not a draw, mixed tenant base, ~2y average lease.
- Market conditions: 39 active listings in the ZIP.
Forward outlook
- In year one you build about $595 of equity ($135 loan paydown + $460 appreciation (2.4% local appreciation)).
- Fulton County population projected at -17% by 2050 — secular population decline; favor cash flow + early exit over multi-decade hold.
- At projected returns (2.4% appreciation + 3.0% rent growth), your $5k cash investment doubles in ~1 year — after that, you're playing with house money.
Negotiation context
- It's been on market 148 days — a 12% lower offer ($17k) is reasonable based on typical stale-listing flexibility.
- 3 sale attempts since 3y ago with the ask held roughly flat each time — persistent listings suggest the price (not the market) is what's stuck; bring a comps-based counter.
Questions for the listing agent
- It's been on market 148 days. Have you received any prior offers? Is the seller open to a 12% concession, seller financing, or rate buy-down credit?
- Why hasn't it sold? Are there any deal-killer items the seller is aware of (foundation, flood, title, zoning, code violations)?
- Is there a deadline driving the sale (1031 exchange, divorce, estate, relocation)? That informs how much negotiation room exists.
- Schools are B-rated — typically a magnet for longer-tenancy family renters. What's the average tenant stay here, and is there a school-zone premium baked into asking?
- What's the average days-on-market for RENTAL listings here right now (not sales)? A rising rental-DOM trend means longer vacancies and softer asking-rent achievability than the comps imply.
- What's the recent tenant-quality profile in this submarket — average credit score on applications, eviction rate, late-payment / NSF rate, and stable-employment percentage? A property-management company in the area should have these aggregated.
- How much new for-sale + rental construction is in the pipeline within 1–3 miles? Heavy new supply typically softens prices + rents 12–24 months out; constrained supply supports both.
Investment metrics
- 1% rule
- 4.35% ✓
- Cap rate
- 40.32%
- Cash-on-cash
- 121.52%
- DSCR
- 6.41
- GRM
- 1.9
CMA / ARV
- ARV (on-the-fly)
- $97,440
- Comps found
- 2
Show comp detail 2 sales within ~0.75 mi
| Address | Dist | Beds/Ba | Sqft | Sold | Price | $/sf | Match |
|---|---|---|---|---|---|---|---|
| 133 Oak St | 0.17mi | 2/1.0 | 884 (+5%) | 22mo | $63,000 | $71 | 65 |
| 109 Roberts St | 0.56mi | 2/1.0 | 864 (+3%) | 14mo | $100,000 | $116 | 57 |
Match score weights: distance 35% · size 25% · config 20% · recency 20%. Top-matched comps best support the ARV.
Projected returns pro-forma
2.36% appreciation · 3.0% rent growth · sell at horizon
- IRR
- —
- Equity multiple
- 7.76×
- Total profit
- $36,915
- Equity at exit
- $8,074
- IRR
- —
- Equity multiple
- 16.18×
- Total profit
- $82,898
- Equity at exit
- $11,927
Cash invested: $5,460 (down + closing). Projections, not guarantees.
Landlord ↔ Tenant lean methodology
- Overall (STATE)
- 92 Strongly Landlord-Friendly
- State Arkansas
- 92 Strongly Landlord-Friendly · R+14
- County
- — inherits STATE
- City
- — inherits STATE
ZIP-level market 72576
- Home prices YoY
- 1.3%
- Active inventory
- 39
- Price-to-rent
- 1.9×
Monthly cashflow live
- Estimated rent
- $848 medium interval (Pro) →
- Mortgage (P&I)
- −$102
- Tax from tax record
- −$7 /mo · $79/yr
- Insurance
- −$8
- HOA
- −$0
- Vacancy / Maint / Mgmt
- −$178
- Net cashflow
- $553
Break-even live
UW: 25.0% down · 7.5% · 30yr · 1.5% tax · 5.0% vac · 8.0% maint · 8.0% mgmt
Financing live
Cash to close
- Down payment
- $4,875
- Closing costs
- $585
- Reserves months
- —
- Total cash needed
- —
Loan-product check · same deal, 3 products live
Conventional
25% down · 7.5% · 30yr
- Down + closing
- —
- Monthly P&I
- —
- Monthly cashflow
- —
- DSCR
- —
- Eligible?
- —
Personal DTI + credit; lowest rate.
DSCR
20% down · 8.5% · 30yr
- Down + closing
- —
- Monthly P&I
- —
- Monthly cashflow
- —
- DSCR
- —
- Eligible?
- —
No personal income docs; deal must DSCR.
Hard money
10% down · 12.0% · 12mo
- Down + closing
- —
- Monthly P&I
- —
- Monthly cashflow
- —
- DSCR
- —
- Eligible?
- —
Short-term bridge; refi at stabilization.
Listing history 24 events
-
2026-06-19days on market $19,500 Active 148 DOM
-
2026-06-18days on market $19,500 Active 147 DOM
-
2026-06-17days on market $19,500 Active 146 DOM
-
2026-06-16days on market $19,500 Active 145 DOM
-
2026-06-15days on market $19,500 Active 144 DOM
-
2026-06-14days on market $19,500 Active 142 DOM
-
2026-06-12days on market $19,500 Active 141 DOM
-
2026-06-09days on market $19,500 Active 138 DOM
-
2026-06-08days on market $19,500 Active 137 DOM
-
2026-06-07days on market $19,500 Active 136 DOM
-
2026-06-07days on market $19,500 Active 135 DOM
-
2026-06-04statusdays on market $19,500 Active 132 DOM
-
2026-06-02days on market $19,500 Active Under Contract 131 DOM
-
2026-06-01days on market $19,500 Active Under Contract 130 DOM
-
2026-05-31days on market $19,500 Active Under Contract 129 DOM
-
2026-05-31days on market $19,500 Active Under Contract 128 DOM
-
2026-04-02historical Active Under Contract
-
2026-01-21$19,500 Active
-
2025-04-28historical
-
2024-09-09status Under Contract
-
2024-09-06price $20,000
-
2024-09-05status Price Change
-
2024-08-23historical
-
2023-10-19$35,000 New Listing
ⓘ Source: listings_history table (triggers on properties + properties_extension) + one-shot
backfill from property_details.listing_events for pre-trigger history.
Tax reassessment forecast AR · Resets to sale price
- Current annual tax
- $79 · $7/mo
- Projected year-2 tax
- $125 · $10/mo
- Expected delta
- +$45/yr (+$4/mo · 57.0%)
ⓘ Screening estimate from a state-policy table — verify with the county assessor before closing.
Nearby sold comps map
Loading sold comps map…
Walkable amenities ~0.75 mi
Loading nearby amenities…
Taxation est. · year 1
- Rental income
- $10,176
- − Mortgage interest
- −$1,092
- − Property taxes
- −$79
- − Insurance
- −$98
- − Repairs & maintenance
- −$814
- − Management
- −$814
- − Depreciation
- −$567
- Taxable income
- $6,712
- Est. tax owed @ 24.0%
- −$1,611
- After-tax cash flow
- $5,024/yr
For passive investors: Depreciation is non-cash, so a rental often shows a tax loss while cash-flowing — sheltering income. Rental losses are passive: they offset passive income freely, and up to $25,000/yr can offset ordinary (W-2) income if you actively participate and your MAGI is under $100k (phasing out to $0 by $150k); unused losses carry forward. On sale, claimed depreciation is recaptured at up to 25%, and gains may owe capital-gains tax (a 1031 exchange can defer both). Figures are a year-1 estimate at your 24.0% rate — not tax advice; consult a CPA.
Schools (NCES district)
- District
- Salem School District
- NCES district ID
- 0512090
- Math proficiency
- 53% ▼ -11.00%
- Reading proficiency
- 55% ▼ -9.00%
- Median HH income
- $34,918
- Composite
- 44.66/100
- National rank
- #2766
- State rank
- #10 of 238 in AR
Livability — Salem
- Score
- 65/100
- State rank
- #148
- US rank
- #12757
Category grades
Schools grade is shown separately in the Schools card above.
Census & demographics
- Census place
- Salem, AR
- Population (ZIP)
- 3,748
Population outlook (Fulton County) Hauer SSP2
- Today (2025)
- 11,739 people
- By 2030
- 11,330 · -3.5%
- By 2040
- 10,483 · -10.7%
- By 2050
- 9,717 · -17.2%
- By 2075
- 8,351 · -28.9%
- By 2100
- 6,853 · -41.6%
Race, ethnicity, and origin ACS 2023
- Neighborhood character
- Predominantly White (90%)
- Race & ethnicity
- White 90% Two or more races 7% Hispanic / Latino 3%
- Common ancestry
- Romanian 3% Slovak 2% Lithuanian 2%
- Foreign-born
- 1% · Canada
- Languages at home
- 99% English-only · Spanish 1%
Political lean MEDSL · Fulton
- 2024 margin
- Solid R (+62.1) · D 18.0% · R 80.1% · Other 1.9%
- 2008→2024 swing
- -43.3pp toward R · 2008: -18.9pp · 2024: -62.1pp
- All cycles
- 2024: R+62.1 2020: R+57.2 2016: R+50.7 2012: R+33.1 2008: R+18.9
Not yet ingested
- Civics
- —
Market trends
- HPI YoY
- ▲ 2.36%
- Current HPI
- 187.7518
- Rent YoY
- —
- Metro
- —
- State GDP YoY
- ▲ 3.80%
- F500 in state
- 10
Industry mix (Fortune 500 HQ in AR)
| Industry | F500 HQs | Revenue |
|---|---|---|
| Retail | 1 | $681B |
|
||
| Food / Agriculture | 1 | $53B |
|
||
| Retail / Energy | 1 | $22B |
|
||
| Transportation / Logistics | 1 | $12B |
|
||
| Energy | 1 | $4B |
|
||
Price history
-44.3% since first listed8 events — show timeline
- 2026-04-02 Contingent — MHMLS
- 2026-01-21 Listed $19,500 MHMLS
- 2025-04-28 Listing Removed — CARMLS
- 2024-09-09 Pending — CARMLS
- 2024-09-06 Price Changed $20,000 CARMLS
- 2024-09-05 Relisted — CARMLS
- 2024-08-23 Listing Removed — CARMLS
- 2023-10-19 Listed $35,000 CARMLS
Property tax history
+8.5%/yrLatest (2025): $79 · +5.7% YoY. Source: county tax records.
Cash-flow waterfall
monthlySold comps — $/sqft
last 12 mo · ≤1 miLoading sold comps…