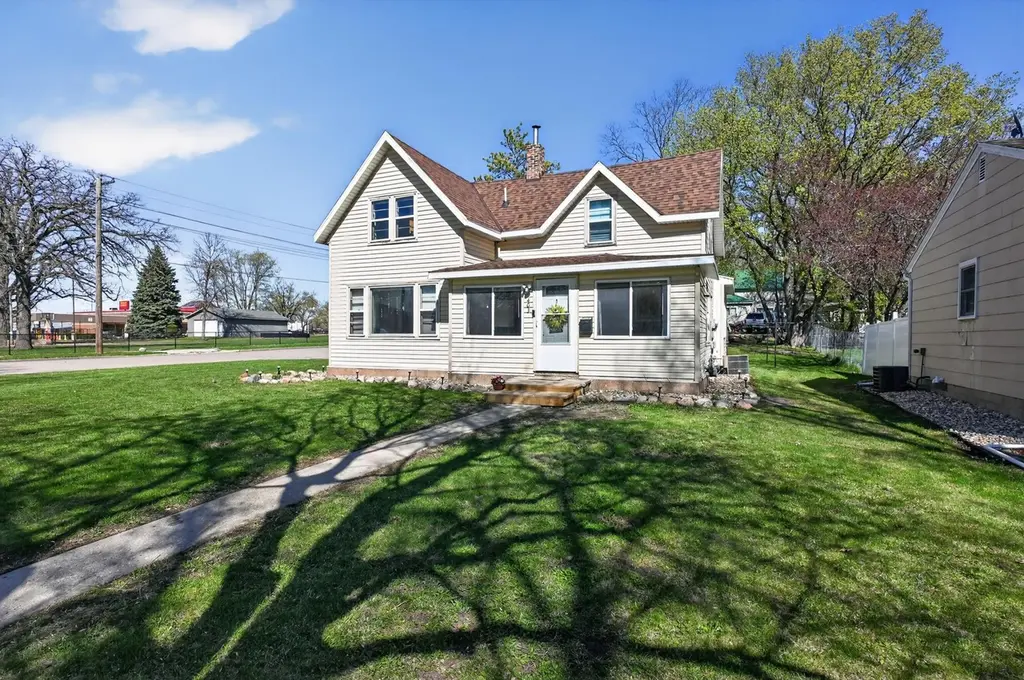
403 Lake St · Alexandria, MN
Flood risk 1/10 · Minimal
- FEMA flood zone
- X (unshaded)
- Chance of flooding over 30 yrs
- 0.0%
- Est. flood insurance / yr
- $473 – $860
Fire risk 1/10 · Minimal
- Est. fire insurance / yr
- $888 – $1,650
Heat risk 1/10 · Minimal
- Hot days now (above 95°F)
- 7 days/yr
- Hot days in 30 yrs
- 13 days/yr
Wind risk 2/10 · Minimal
- Chance of severe wind over 30 yrs
- —
Air-quality risk 2/10 · Minimal
- Unhealthy air days now
- 2 days/yr
- Unhealthy air days in 30 yrs
- 2 days/yr
Risk factors via First Street. Map © Google.
Why this score? — see what drove the D grade
The composite is a weighted blend of 9 inputs, each scored 0–100. Each bar is that input's sub-score; the figure is the points it added to the 100-point composite (weight × sub-score).
- ARV discount +15.0/15.0
- Cash flow +8.0/30.0
- Schools +4.8/10.0
- Livability +3.9/5.0
- Rent growth +2.5/5.0
- Condition / age +2.5/5.0
- DSCR +2.1/10.0
- 1% rule +1.8/10.0
- Appreciation +0.0/10.0
$199,900
🖨 Deal sheet 📄 Offer letter ✓ Due diligence
Listing remarks MLS
Well-Maintained 3 Bedroom, 2 Bath, located in the City of Alexandria. Large corner lot, very nice front porch and back porch, many updates in home.
Key facts
- 9,888 sq ft lot
- Built 1902
- Listed 6 days
Property features AI
Finance
- Other: Approximately 1,556 sq. ft. above grade with 435 sq. ft. below grade (total building area 1,991); Lot about 0.227 acres (approx. dimensions 65 x 150 x 65 x 150)
Exterior
- Parking: Gravel parking
- Utilities: City water connected; City sewer connected; Natural gas; Circuit breaker electrical service; Serviced by Alexandria Light & Power
- Home design: Residential property; One and one-half stories
- Construction: Block foundation; Roof replaced within the last 8 years
- Exterior features: Vinyl exterior; Front porch; Rear porch; Storage shed on the property; City street frontage (publicly maintained road)
Interior
- Kitchen: Dishwasher; Range; Refrigerator; Microwave; Kitchen with window
- Bedrooms: Three bedrooms — two on the upper level and one on the main level
- Bathrooms: Main-level full bathroom; Upper-level 3/4 bathroom
- Heating & cooling: Forced air heating; Central air conditioning
- Interior features: Ceiling fan(s); Kitchen window; Porches (front and rear); Walk-in closet(s)
- Laundry & utility: Main-level laundry; Washer; Dryer
Neighborhood map
What this means for you Summary
Snapshot
- This is a 3-bed/2.0-bath single-family listed at $200k.
Deal economics
- At list price, monthly cash flow is $-203 ($-2k/yr) — negative.
- To cash-flow at today's rent, offer at most $164k (17.9% below list).
- To meet the 1% rule (rent ≥ 1% of price), the offer needs to be $136k (31.9% below list).
- Recommended offer: $136k (31.9% below list) — sets the bar for 1% rule.
- Cap rate 5.1% vs local median 2.5% in Alexandria — top-decile yield for the area; either an underpriced asset or a hidden risk that comps aren't pricing in. Stress-test before assuming the spread holds.
Location & tenants
- Location reads 78/100 on livability (#105 in MN, #2,409 nationally) — a middle-class / working-renter tenant base. Strengths: cost of living A+, housing A+, health & safety A+; Watch: amenities D, commute F.
- Alexandria Public School District (town): math 55% / reading 57% proficiency, ranked #64 of 301 in MN (top 21%) — acceptable for families but not a draw, mixed tenant base, ~2y average lease.
- Market conditions: 402 active listings in the ZIP; 4 comparable units currently listed for rent nearby; rentals lingering (median 44d on market — plan ~5-8 weeks vacancy on turnover, expect pricing pressure); 100% of comp listings sitting > 30 days — soft ceiling on asking rent; solid renter incomes; 285 units permitted in Douglas County in 2024 (88 in 5+ unit buildings).
Forward outlook
- Local home prices are declining (-3.0%/yr); year-one equity from $1k of loan paydown is wiped out by about $6k of value loss. Plan a longer hold.
- Douglas County population projected at +5% by 2050 — modest demand growth; plan on rents tracking national, not racing it.
Negotiation context
- Only 6 days on market — expect competitive offers; lowballing is unlikely to land.
- 3 sale attempts since 15y ago with the ask held roughly flat each time — persistent listings suggest the price (not the market) is what's stuck; bring a comps-based counter.
Risks & watch-outs
- Watch-outs: built in 1902 — expect roof / HVAC / electrical / plumbing capex.
Questions for the listing agent
- What do current leases actually rent for vs. the listed asking? Can we see a recent rent roll and the last 12 months of T-12 income?
- Built in 1902 — when were the roof, HVAC, electrical panel, plumbing, and water heater last replaced?
- Is there a deadline driving the sale (1031 exchange, divorce, estate, relocation)? That informs how much negotiation room exists.
- Schools are B-rated — typically a magnet for longer-tenancy family renters. What's the average tenant stay here, and is there a school-zone premium baked into asking?
- The area grade is low — what's the realistic commute time and amenity access for the typical tenant pool here? Any planned neighborhood developments (good or bad) we should know about?
- What's the average days-on-market for RENTAL listings here right now (not sales)? A rising rental-DOM trend means longer vacancies and softer asking-rent achievability than the comps imply.
- What's the recent tenant-quality profile in this submarket — average credit score on applications, eviction rate, late-payment / NSF rate, and stable-employment percentage? A property-management company in the area should have these aggregated.
- How much new for-sale + rental construction is in the pipeline within 1–3 miles? Heavy new supply typically softens prices + rents 12–24 months out; constrained supply supports both.
Investment metrics
- 1% rule
- 0.68% ✗
- Cap rate
- 5.08%
- Cash-on-cash
- -4.35%
- DSCR
- 0.81
- GRM
- 12.2
CMA / ARV
- ARV (median comp)
- $342,658
- List price
- $199,900
- Delta
- -41.66%
- Verdict
- UNDERPRICED
- Comps
- 1 within 2.0 mi
Projected returns pro-forma
-3.0% appreciation · 3.0% rent growth · sell at horizon
- IRR
- -23.7%
- Equity multiple
- 0.19×
- Total profit
- $-45,350
- Equity at exit
- $29,806
- IRR
- -18.7%
- Equity multiple
- -0.01×
- Total profit
- $-56,296
- Equity at exit
- $17,284
Cash invested: $55,972 (down + closing). Projections, not guarantees.
Landlord ↔ Tenant lean methodology
- Overall (STATE)
- 46 Balanced
- State Minnesota
- 46 Balanced · D+2
- County
- — inherits STATE
- City
- — inherits STATE
ZIP-level market 56308
- Active inventory
- 402
- Price-to-rent
- 12.2×
Monthly cashflow live
- Estimated rent
- $1,360 medium interval (Pro) →
- Mortgage (P&I)
- −$1,048
- Tax from tax record
- −$146 /mo · $1,750/yr
- Insurance
- −$83
- HOA
- −$0
- Vacancy / Maint / Mgmt
- −$286
- Net cashflow
- $-203
Break-even live
UW: 25.0% down · 7.5% · 30yr · 1.5% tax · 5.0% vac · 8.0% maint · 8.0% mgmt
Financing live
Cash to close
- Down payment
- $49,975
- Closing costs
- $5,997
- Reserves months
- —
- Total cash needed
- —
Loan-product check · same deal, 3 products live
Conventional
25% down · 7.5% · 30yr
- Down + closing
- —
- Monthly P&I
- —
- Monthly cashflow
- —
- DSCR
- —
- Eligible?
- —
Personal DTI + credit; lowest rate.
DSCR
20% down · 8.5% · 30yr
- Down + closing
- —
- Monthly P&I
- —
- Monthly cashflow
- —
- DSCR
- —
- Eligible?
- —
No personal income docs; deal must DSCR.
Hard money
10% down · 12.0% · 12mo
- Down + closing
- —
- Monthly P&I
- —
- Monthly cashflow
- —
- DSCR
- —
- Eligible?
- —
Short-term bridge; refi at stabilization.
Rent comps 4 comps
| Address | Beds | Baths | Sqft | Rent | $/sqft | DOM | Units | Dist |
|---|---|---|---|---|---|---|---|---|
| 1605 6th Ave E Unit 214 Alexandria, MN | 2.0 | 1.0 | 950 | $1,100 | $1.16 | 43d | 1 | 0.75mi |
| 1607 6th Ave E Unit 202 Alexandria, MN | 2.0 | 1.0 | 950 | $1,100 | $1.16 | 43d | 1 | 0.76mi |
| 505 McKay Ave S Alexandria, MN | 2.0 | 1.0 | 850 | $1,075 | $1.26 | 43d | 2 | 1.04mi |
| 1964 10th Ave E Alexandria, MN | 3.0 | 1.0–2.0 | 775 | $1,650 | $2.13 | 43d | 1 | 1.37mi |
Listing history 9 events
-
2026-05-12status Pending 369-char remark
-
2026-05-07$199,900 Active 369-char remark
-
2026-05-04historical $199,900 369-char remark
-
2015-10-28soldstatus $125,000 147-char remark
Show marketing remark (147 chars)
Well-Maintained 3 Bedroom, 2 Bath, located in the City of Alexandria. Large corner lot, very nice front porch and back porch, many updates in home.
-
2015-10-28soldstatus $125,100
Show marketing remark (147 chars)
Well-Maintained 3 Bedroom, 2 Bath, located in the City of Alexandria. Large corner lot, very nice front porch and back porch, many updates in home.
-
2015-08-05$124,900 147-char remark
Show marketing remark (147 chars)
Well-Maintained 3 Bedroom, 2 Bath, located in the City of Alexandria. Large corner lot, very nice front porch and back porch, many updates in home.
-
2012-01-05historical
-
2011-11-02soldstatus $124,000
-
2011-05-11$124,900
ⓘ Source: listings_history table (triggers on properties + properties_extension) + one-shot
backfill from property_details.listing_events for pre-trigger history.
Tax reassessment forecast MN · Partial reset (capped growth)
- Current annual tax
- $1,750 · $146/mo
- Projected year-2 tax
- $1,994 · $166/mo
- Expected delta
- +$244/yr (+$20/mo · 14.0%)
ⓘ Screening estimate from a state-policy table — verify with the county assessor before closing.
Climate risk First Street
- Flood 1/10 Low FEMA zone X (unshaded) · 0% chance over 30 yrs
- Wildfire 1/10 Low
- Heat 1/10 Low 7 d/yr ≥95°F today · 13 d/yr by 30 yrs out
- Wind 2/10 Low
- Air quality 2/10 Low 2 unhealthy d/yr today · 2 by 30 yrs out
Nearby sold comps map
Loading sold comps map…
Walkable amenities ~0.75 mi
Loading nearby amenities…
Taxation est. · year 1
- Rental income
- $16,324
- − Mortgage interest
- −$11,198
- − Property taxes
- −$1,750
- − Insurance
- −$1,000
- − Repairs & maintenance
- −$1,306
- − Management
- −$1,306
- − Depreciation
- −$5,815
- Taxable loss
- −$6,050
- Est. tax savings @ 24.0%
- +$1,452
- After-tax cash flow
- $-981/yr
For passive investors: Depreciation is non-cash, so a rental often shows a tax loss while cash-flowing — sheltering income. Rental losses are passive: they offset passive income freely, and up to $25,000/yr can offset ordinary (W-2) income if you actively participate and your MAGI is under $100k (phasing out to $0 by $150k); unused losses carry forward. On sale, claimed depreciation is recaptured at up to 25%, and gains may owe capital-gains tax (a 1031 exchange can defer both). Figures are a year-1 estimate at your 24.0% rate — not tax advice; consult a CPA.
Schools (NCES district)
- District
- Alexandria Public School District
- NCES district ID
- 2703060
- Math proficiency
- 55% ▼ -10.00%
- Reading proficiency
- 57% ▼ -9.00%
- Median HH income
- $52,476
- Composite
- 48.0/100
- National rank
- #2197
- State rank
- #64 of 301 in MN
Livability — Alexandria
- Score
- 78/100
- State rank
- #105
- US rank
- #2409
Category grades
Schools grade is shown separately in the Schools card above.
Census & demographics
- Census place
- Alexandria, MN
- County
- Douglas County · 27,008 people
- City population
- 27,008
- Metro
- Alexandria, MN
- Population (ZIP)
- 27,008
- Household income
- $78,177
- Rent vs Own
- Severe rent burden
- 550.0
Population outlook (Douglas County) Hauer SSP2
- Today (2025)
- 38,913 people
- By 2030
- 39,636 · +1.9%
- By 2040
- 40,564 · +4.2%
- By 2050
- 40,819 · +4.9%
- By 2075
- 40,824 · +4.9%
- By 2100
- 38,379 · -1.4%
Race, ethnicity, and origin ACS 2023
- Neighborhood character
- Predominantly White (93%)
- Race & ethnicity
- White 93% Hispanic / Latino 3% Two or more races 2%
- Common ancestry
- Portuguese 22% Lithuanian 3% Romanian 3%
- Foreign-born
- 2% · Vietnam, Canada
- Languages at home
- 97% English-only · Spanish 2%
Political lean MEDSL · Douglas
- 2024 margin
- Solid R (+35.1) · D 31.7% · R 66.8% · Other 1.4%
- 2008→2024 swing
- -25.6pp toward R · 2008: -9.5pp · 2024: -35.1pp
- All cycles
- 2024: R+35.1 2020: R+32.8 2016: R+35.8 2012: R+15.5 2008: R+9.5
Not yet ingested
- Civics
- —
Market trends
- HPI YoY
- ▼ -215.15%
- Current HPI
- 189.1595
- Rent YoY
- —
- Metro
- Alexandria, MN
- State GDP YoY
- ▲ 2.41%
- F500 in state
- 34
Industry mix (Fortune 500 HQ in MN)
| Industry | F500 HQs | Revenue |
|---|---|---|
| Healthcare | 2 | $407B |
|
||
| Retail | 2 | $150B |
|
||
| Consumer Goods | 2 | $32B |
|
||
| Industrial Machinery | 2 | $6B |
|
||
| Agriculture | 1 | $40B |
|
||
| Healthcare / Medical Devices | 1 | $32B |
|
||
Price history
+72.9% since first listed10 events — show timeline
- 2026-06-10 Sold (MLS) $216,000 NORTHSTARMLS as Distributed by MLS Grid
- 2026-05-12 Pending — NORTHSTARMLS as Distributed by MLS Grid
- 2026-05-07 Listed $199,900 NORTHSTARMLS as Distributed by MLS Grid
- 2026-05-04 Coming Soon $199,900 NORTHSTARMLS as Distributed by MLS Grid
- 2015-10-28 Sold (Public Records) $125,100 Public Records
- 2015-10-28 Sold (MLS) $125,000 NORTHSTARMLS as Distributed by MLS Grid
- 2015-08-05 Listed $124,900 NORTHSTARMLS as Distributed by MLS Grid
- 2012-01-05 Listing Removed — NORTHSTARMLS as Distributed by MLS Grid
- 2011-11-02 Sold (Public Records) $124,000 Public Records
- 2011-05-11 Listed $124,900 NORTHSTARMLS as Distributed by MLS Grid
Property tax history
+5.6%/yrLatest (2026): $1,750 · +12.6% YoY. Source: county tax records.
Cash-flow waterfall
monthlySold comps — $/sqft
last 12 mo · ≤1 miLoading sold comps…