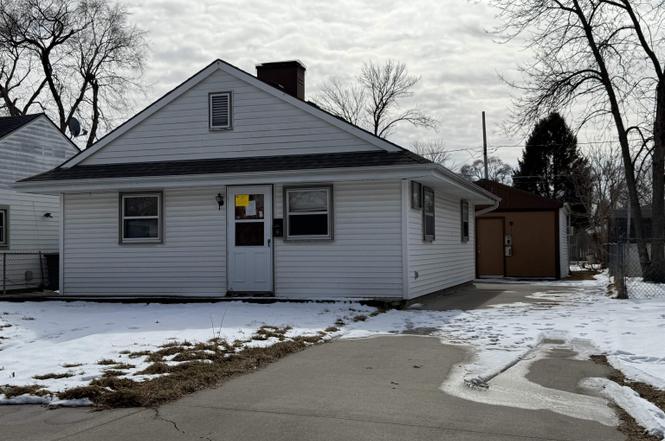
3313 7th Ave · Council Bluffs, IA
Flood risk 1/10 · Minimal
- FEMA flood zone
- X
- Chance of flooding over 30 yrs
- 0.0%
- Est. flood insurance / yr
- $507 – $1,088
Fire risk 3/10 · Minor
- Est. fire insurance / yr
- $902 – $1,676
Heat risk 4/10 · Minor
- Hot days now (above 104°F)
- 7 days/yr
- Hot days in 30 yrs
- 15 days/yr
Wind risk 2/10 · Minimal
- Chance of severe wind over 30 yrs
- —
Air-quality risk 2/10 · Minimal
- Unhealthy air days now
- 1 days/yr
- Unhealthy air days in 30 yrs
- 1 days/yr
Risk factors via First Street. Map © Google.
Why this score? — see what drove the B+ grade
The composite is a weighted blend of 9 inputs, each scored 0–100. Each bar is that input's sub-score; the figure is the points it added to the 100-point composite (weight × sub-score).
- Cash flow +30.0/30.0
- ARV discount +15.0/15.0
- DSCR +10.0/10.0
- 1% rule +9.2/10.0
- Schools +4.5/10.0
- Livability +3.5/5.0
- Rent growth +2.6/5.0
- Condition / age +2.5/5.0
- Appreciation +0.0/10.0
$84,900
🖨 Deal sheet (PDF) 📄 Offer letter ✓ Due diligence
Listing remarks MLS
AGENT IS OWNER
Key facts
- Zoned r-2
- Bank foreclosure
- 5,227 sq ft lot
Tags
Neighborhood map
What this means for you Summary
Snapshot
- This is a 2-bed/1.0-bath single-family listed at $85k.
Deal economics
- At list price, monthly cash flow is $382 ($5k/yr) — positive.
- The deal already cash-flows at list — no discount required.
- Meets the 1% rule at list price ($1k rent vs $85k).
- Cap rate 11.7% vs local median 3.3% in Council Bluffs — top-decile yield for the area; either an underpriced asset or a hidden risk that comps aren't pricing in. Stress-test before assuming the spread holds.
Location & tenants
- Location reads 70/100 on livability (#368 in IA) — a middle-class / working-renter tenant base. Strengths: cost of living A+, housing A+, health & safety B+; Watch: employment C-, amenities D, crime D-.
- Council Bluffs Community School District (urban): math 52% / reading 55% proficiency, ranked #272 of 289 in IA (top 94%) — acceptable for families but not a draw, mixed tenant base, ~2y average lease.
- Market conditions: Rents flat; 140 active listings in the ZIP; 9 comparable units currently listed for rent nearby; rentals at typical pace (median 25d on market — plan ~3-4 weeks tenant-placement turnaround); 44% of comp listings sitting > 30 days — soft ceiling on asking rent; 679 units permitted in Pottawattamie County in 2024 (566 in 5+ unit buildings).
Forward outlook
- Local home prices are declining (-3.0%/yr); year-one equity from $587 of loan paydown is wiped out by about $3k of value loss. Plan a longer hold.
- Pottawattamie County population projected to shrink 7% by 2050 — rents likely to lag national; underwrite the cash flow, not the appreciation.
- At projected returns (-3.0% appreciation + 0.6% rent growth), your $24k cash investment doubles in ~8 years — after that, you're playing with house money.
Negotiation context
- Only 2 days on market — expect competitive offers; lowballing is unlikely to land.
- 2 sale attempts since 23y ago; this cycle's ask has dropped $84.82M (100%) from the opening price — seller is motivated, your offer sets the floor, not the list.
Risks & watch-outs
- Watch-outs: built in 1951 — expect roof / HVAC / electrical / plumbing capex.
Questions for the listing agent
- Built in 1951 — when were the roof, HVAC, electrical panel, plumbing, and water heater last replaced?
- Is there a deadline driving the sale (1031 exchange, divorce, estate, relocation)? That informs how much negotiation room exists.
- Crime grade is D in this area — have there been break-ins, vandalism, or insurance claims at this property in the last 3 years? What carrier currently insures it and at what premium?
- What's the average days-on-market for RENTAL listings here right now (not sales)? A rising rental-DOM trend means longer vacancies and softer asking-rent achievability than the comps imply.
- What's the recent tenant-quality profile in this submarket — average credit score on applications, eviction rate, late-payment / NSF rate, and stable-employment percentage? A property-management company in the area should have these aggregated.
- How much new for-sale + rental construction is in the pipeline within 1–3 miles? Heavy new supply typically softens prices + rents 12–24 months out; constrained supply supports both.
Investment metrics
- 1% rule
- 1.42% ✓
- Cap rate
- 11.69%
- Cash-on-cash
- 19.29%
- DSCR
- 1.86
- GRM
- 5.9
CMA / ARV
- ARV (on-the-fly)
- $121,632
- Comps found
- 12
Show comp detail 12 sales within ~0.75 mi
| Address | Dist | Beds/Ba | Sqft | Sold | Price | $/sf | Match |
|---|---|---|---|---|---|---|---|
| 3538 3rd Ave | 0.37mi | 2/1.0 | 672 (0%) | 1mo | $155,000 | $231 | 82 |
| 3219 9th Ave | 0.16mi | 2/1.0 | 720 (+7%) | 10mo | $150,000 | $208 | 72 |
| 3418 9th Ave | 0.16mi | 2/1.0 | 750 (+12%) | 3mo | $135,000 | $180 | 71 |
| 3537 6th Ave | 0.26mi | 2/1.0 | 740 (+10%) | 1mo | $155,000 | $209 | 70 |
| 3512 4th Ave | 0.29mi | 1/1.0 (-1) | 645 (-4%) | 6mo | $117,000 | $181 | 70 |
| 3227 6th Ave | 0.11mi | 2/1.0 | 744 (+11%) | 10mo | $45,500 | $61 | 69 |
| 3453 4th Ave | 0.23mi | 2/1.0 | 616 (-8%) | 10mo | $126,000 | $205 | 67 |
| 3023 8th Ave | 0.28mi | 2/1.0 | 720 (+7%) | 10mo | $112,000 | $156 | 67 |
| 2708 5th Avenue Ave | 0.62mi | 2/1.0 | 660 (-2%) | 10mo | $80,000 | $121 | 60 |
| 3138 5th Ave | 0.22mi | 2/1.0 | 768 (+14%) | 9mo | $130,000 | $169 | 59 |
| 3741 4th Ave | 0.56mi | 1/1.5 (-1) | 677 (+1%) | 10mo | $173,000 | $256 | 58 |
| 2712 5th Ave | 0.61mi | 2/1.0 | 575 (-14%) | 8mo | $95,000 | $165 | 41 |
Match score weights: distance 35% · size 25% · config 20% · recency 20%. Top-matched comps best support the ARV.
Projected returns pro-forma
-3.0% appreciation · 0.56% rent growth · sell at horizon
- IRR
- 8.5%
- Equity multiple
- 1.32×
- Total profit
- $7,697
- Equity at exit
- $12,659
- IRR
- 15.6%
- Equity multiple
- 2.13×
- Total profit
- $26,788
- Equity at exit
- $7,341
Cash invested: $23,772 (down + closing). Projections, not guarantees.
Landlord ↔ Tenant lean methodology
- Overall (STATE)
- 83 Strongly Landlord-Friendly
- State Iowa
- 83 Strongly Landlord-Friendly · R+6
- County
- — inherits STATE
- City
- — inherits STATE
ZIP-level market 51501
- Rents YoY
- 0.6%
- Active inventory
- 140
- Price-to-rent
- 5.9×
Monthly cashflow live
- Estimated rent
- $1,204 high interval (Pro) →
- Mortgage (P&I)
- −$445
- Tax from tax record
- −$89 /mo · $1,064/yr
- Insurance
- −$35
- HOA
- −$0
- Vacancy / Maint / Mgmt
- −$253
- Net cashflow
- $382
Break-even live
Sensitivity live
| Price | -10% $430 | -5% $406 | +0% $382 | +5% $358 | +10% $334 |
|---|---|---|---|---|---|
| Rent | -10% $287 | -5% $334 | +0% $382 | +5% $430 | +10% $477 |
| Rate | -1.0pp $425 | -0.5pp $404 | base $382 | +0.5pp $360 | +1.0pp $338 |
UW: 25.0% down · 7.5% · 30yr · 1.5% tax · 5.0% vac · 8.0% maint · 8.0% mgmt
Financing live
Cash to close
- Down payment
- $21,225
- Closing costs
- $2,547
- Reserves months
- —
- Total cash needed
- —
Loan-product check · same deal, 3 products live
Conventional
25% down · 7.5% · 30yr
- Down + closing
- —
- Monthly P&I
- —
- Monthly cashflow
- —
- DSCR
- —
- Eligible?
- —
Personal DTI + credit; lowest rate.
DSCR
20% down · 8.5% · 30yr
- Down + closing
- —
- Monthly P&I
- —
- Monthly cashflow
- —
- DSCR
- —
- Eligible?
- —
No personal income docs; deal must DSCR.
Hard money
10% down · 12.0% · 12mo
- Down + closing
- —
- Monthly P&I
- —
- Monthly cashflow
- —
- DSCR
- —
- Eligible?
- —
Short-term bridge; refi at stabilization.
Rent comps 9 comps
| Address | Beds | Baths | Sqft | Rent | $/sqft | DOM | Units | Dist |
|---|---|---|---|---|---|---|---|---|
| 3726 3rd Ave Apt E Council Bluffs, IA | 2.0 | 1.0 | 748 | $895 | $1.20 | 44d | 1 | 0.57mi |
| 2717 Avenue A Apt 4 Council Bluffs, IA | 2.0 | 1.0 | 672 | $995 | $1.48 | 44d | 1 | 0.79mi |
| 2523 3rd Ave Unit 8 Council Bluffs, IA | 2.0 | 1.0 | 720 | $750 | $1.04 | 44d | 1 | 0.87mi |
| 20 S 41st St Council Bluffs, IA | 2.0 | 1.0–2.0 | 709 | $1,640 | $2.31 | 2d | 14 | 0.91mi |
| 806 N 34th St Council Bluffs, IA | 1.0–2.0 | 1.0 | 776 | $1,105 | $1.42 | 3d | 16 | 0.98mi |
| 4141 Rivers Edge Pkwy Council Bluffs, IA | 2.0 | 1.0–2.0 | 808 | $1,900 | $2.35 | 3d | 8 | 0.98mi |
| 415 Leavenworth St Omaha, NE | 1.0–2.0 | 1.0–2.0 | 881 | $2,395 | $2.72 | 2d | 38 | 1.21mi |
| 2018 Avenue A Unit 2018 Council Bluffs, IA | 1.0 | 1.0 | 560 | $775 | $1.38 | 24d | 1 | 1.40mi |
| 2018 Avenue A Unit 2018 Council Bluffs, IA | 1.0 | 1.0 | 560 | $750 | $1.34 | 44d | 1 | 1.40mi |
Listing history 6 events
-
2026-04-23soldstatus $77,500
-
2026-02-26status Pending
-
2026-02-25price $84,900
-
2026-02-24$84,900,000 Active
-
2003-01-31soldstatus $70,000 14-char remark
Show marketing remark (14 chars)
AGENT IS OWNER
-
2003-01-04$70,000 14-char remark
Show marketing remark (14 chars)
AGENT IS OWNER
ⓘ Source: listings_history table (triggers on properties + properties_extension) + one-shot
backfill from property_details.listing_events for pre-trigger history.
Tax reassessment forecast IA · Partial reset (capped growth)
- Current annual tax
- $1,064 · $89/mo
- Projected year-2 tax
- $1,198 · $100/mo
- Expected delta
- +$134/yr (+$11/mo · 12.6%)
ⓘ Screening estimate from a state-policy table — verify with the county assessor before closing.
Climate risk First Street
- Flood 1/10 Low FEMA zone X · 0% chance over 30 yrs
- Wildfire 3/10 Moderate
- Heat 4/10 Moderate 7 d/yr ≥104°F today · 15 d/yr by 30 yrs out
- Wind 2/10 Low
- Air quality 2/10 Low 1 unhealthy d/yr today · 1 by 30 yrs out
Nearby sold comps map
Loading sold comps map…
Walkable amenities ~0.75 mi
Loading nearby amenities…
Taxation est. · year 1
- Rental income
- $14,451
- − Mortgage interest
- −$4,756
- − Property taxes
- −$1,064
- − Insurance
- −$424
- − Repairs & maintenance
- −$1,156
- − Management
- −$1,156
- − Depreciation
- −$2,470
- Taxable income
- $3,424
- Est. tax owed @ 24.0%
- −$822
- After-tax cash flow
- $3,763/yr
For passive investors: Depreciation is non-cash, so a rental often shows a tax loss while cash-flowing — sheltering income. Rental losses are passive: they offset passive income freely, and up to $25,000/yr can offset ordinary (W-2) income if you actively participate and your MAGI is under $100k (phasing out to $0 by $150k); unused losses carry forward. On sale, claimed depreciation is recaptured at up to 25%, and gains may owe capital-gains tax (a 1031 exchange can defer both). Figures are a year-1 estimate at your 24.0% rate — not tax advice; consult a CPA.
Schools (NCES district)
- District
- Council Bluffs Community School District
- NCES district ID
- 1908220
- Math proficiency
- 52% ▼ -9.00%
- Reading proficiency
- 55% ▼ -1.00%
- Median HH income
- $45,259
- Composite
- 45.23/100
- National rank
- #2665
- State rank
- #272 of 289 in IA
Livability — Council Bluffs
- Score
- 70/100
- State rank
- #368
- US rank
- #7695
Category grades
Schools grade is shown separately in the Schools card above.
Census & demographics
- Census place
- Council Bluffs, IA
- County
- Pottawattamie County · 72,590 people
- City population
- 72,590
- Metro
- Omaha-Council Bluffs, NE-IA
- Population (ZIP)
- 34,618
- Household income
- $59,843
- Rent vs Own
- Severe rent burden
- 1110.0
Population outlook (Pottawattamie County) Hauer SSP2
- Today (2025)
- 93,683 people
- By 2030
- 92,772 · -1.0%
- By 2040
- 89,917 · -4.0%
- By 2050
- 86,994 · -7.1%
- By 2075
- 82,756 · -11.7%
- By 2100
- 79,097 · -15.6%
Race, ethnicity, and origin ACS 2023
- Neighborhood character
- Predominantly White (79%)
- Race & ethnicity
- White 79% Hispanic / Latino 14% Two or more races 8% Asian 2% Black 2%
- Hispanic origin (detail)
- Mexican 13%
- Common ancestry
- Portuguese 2% Romanian 2% Iranian 1%
- Foreign-born
- 6% · Canada, China
- Languages at home
- 90% English-only · Spanish 8% Chinese 1%
Political lean MEDSL · Pottawattamie
- 2024 margin
- R (+20.0) · D 39.3% · R 59.3% · Other 1.4%
- 2008→2024 swing
- -18.1pp toward R · 2008: -1.9pp · 2024: -20.0pp
- All cycles
- 2024: R+20.0 2020: R+16.8 2016: R+21.6 2012: R+5.8 2008: R+1.9
Not yet ingested
- Civics
- —
Market trends
- HPI YoY
- ▼ -187.49%
- Current HPI
- 215.2532
- Rent YoY
- ▲ 0.56%
- Metro
- Omaha-Council Bluffs, NE-IA
- State GDP YoY
- ▲ 2.48%
- F500 in state
- 4
Industry mix (Fortune 500 HQ in IA)
| Industry | F500 HQs | Revenue |
|---|---|---|
| Financial Services | 1 | $16B |
|
||
| Retail / Convenience | 1 | $15B |
|
||
Price history
+10.7% since first listed6 events — show timeline
- 2026-04-23 Sold (Public Records) $77,500 Public Records
- 2026-02-26 Pending — IAR
- 2026-02-25 Price Changed $84,900 IAR
- 2026-02-24 Listed $84,900,000 IAR
- 2003-01-31 Sold (MLS) $70,000 SWIAR
- 2003-01-04 Listed $70,000 SWIAR
Property tax history
-2.6%/yrLatest (2025): $1,064 · -28.4% YoY. Source: county tax records.
Cash-flow waterfall
monthlySold comps — $/sqft
last 12 mo · ≤1 miLoading sold comps…