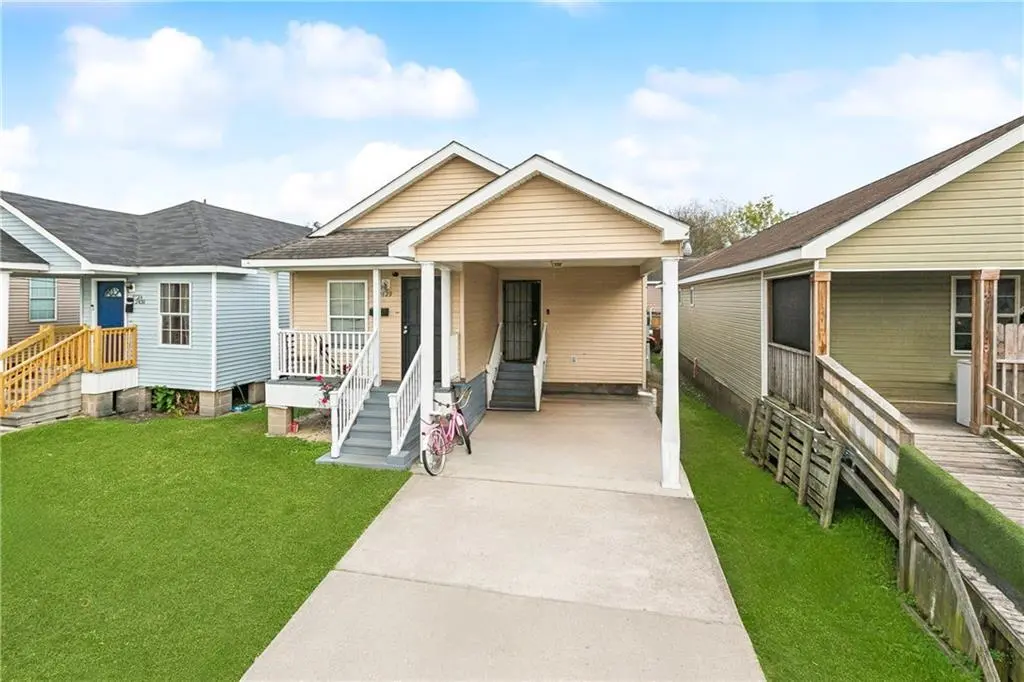
2429 Piety St · New Orleans, LA
Flood risk 8/10 · Major
- FEMA flood zone
- AE
- Chance of flooding over 30 yrs
- 0.78%
- Est. flood insurance / yr
- $1,737 – $8,500
Fire risk 2/10 · Minimal
- Est. fire insurance / yr
- $1,269 – $2,357
Heat risk 10/10 · Severe
- Hot days now (above 108°F)
- 7 days/yr
- Hot days in 30 yrs
- 21 days/yr
Wind risk 10/10 · Severe
- Chance of severe wind over 30 yrs
- 99.0%
Air-quality risk 3/10 · Minor
- Unhealthy air days now
- 3 days/yr
- Unhealthy air days in 30 yrs
- 3 days/yr
Risk factors via First Street. Map © Google.
Why this score? — see what drove the B- grade
The composite is a weighted blend of 9 inputs, each scored 0–100. Each bar is that input's sub-score; the figure is the points it added to the 100-point composite (weight × sub-score).
- Cash flow +27.1/30.0
- ARV discount +14.0/15.0
- DSCR +9.4/10.0
- 1% rule +6.6/10.0
- Livability +4.0/5.0
- Rent growth +3.1/5.0
- Condition / age +2.5/5.0
- Schools +1.6/10.0
- Appreciation +0.0/10.0
$155,000
🖨 Deal sheet (PDF) 📄 Offer letter ✓ Due diligence
Listing remarks MLS
Single Family home located in the Upper Ninth Ward featuring an open floor plan with 4 bedrooms and 2 baths. Includes a covered carport and a spacious backyard. Easy access to I-10 and 610
Key facts
- Open floor plan
- Spacious backyard
- Covered carport
Tags
Neighborhood map
What this means for you Summary
Snapshot
- This is a 4-bed/2.0-bath single-family listed at $155k.
Deal economics
- At list price, monthly cash flow is $12 ($138/yr) — positive.
- The deal already cash-flows at list — no discount required.
- Meets the 1% rule at list price ($2k rent vs $155k).
- Recommended offer: $136k (12.0% below list) — sets the bar for market timing.
- Cap rate 9.7% vs local median 4.4% in New Orleans — top-decile yield for the area; either an underpriced asset or a hidden risk that comps aren't pricing in. Stress-test before assuming the spread holds.
Location & tenants
- Location reads 81/100 on livability (#3 in LA, #1,383 nationally) — a professional / high-income tenant draw. Strengths: amenities A+, commute A+, health & safety A+; Watch: crime C-, employment D.
- Orleans Parish (urban): math 11% / reading 27% proficiency, ranked #69 of 98 in LA (top 70%) — low school quality limits family demand, transient renter base, plan for 1-2y turnover; 68% free/reduced lunch — lower-income household profile, screen leases tightly.
- Zoned schools: Benjamin Franklin Elem. Math And Science (math 12% / reading 23%, grade F, #479 of 646 statewide, top 75%, 747 students, 98% FRL, charter) — zoned schools average 98% FRL vs 68% district-wide (30 pts higher); higher-poverty schools than district average — tighter screening recommended.
- Market conditions: Rents rising (+2.5%/yr); 587 active listings in the ZIP; 40 comparable units currently listed for rent nearby; rentals at typical pace (median 19d on market — plan ~3-4 weeks tenant-placement turnaround); 710 units permitted in Orleans Parish in 2024 (244 in 5+ unit buildings).
- At $1,803/mo this rent would consume 47% of the median local household income ($46k/yr) (locally 1988% of renters already pay >50% of income on rent) — very limited rent-growth headroom before tenants either downsize or default.
Forward outlook
- Local home prices are declining (-3.0%/yr); year-one equity from $1k of loan paydown is wiped out by about $5k of value loss. Plan a longer hold.
- Orleans County population projected at +61% by 2050 — long-run rental-demand tailwind backs the buy-and-hold thesis.
Negotiation context
- It's been on market 144 days — a 12% lower offer ($136k) is reasonable based on typical stale-listing flexibility.
- 4 sale attempts since 23y ago; this cycle's ask has dropped $10k (6%) from the opening price — seller is motivated, your offer sets the floor, not the list.
- Current owner paid $38k; list at $155k implies a 313% gain — meaningful room to come down on a strong offer.
Risks & watch-outs
- Watch-outs: flood insurance adds $427/mo.
- Climate carrying-cost: in FEMA flood zone AE (mandatory federal flood insurance); severe wind risk, 99% chance of damaging wind over 30y; extreme-heat days projected 7→21/yr by 2055 (HVAC capex compounding) — expect insurance premiums to compound above CPI over the hold.
Questions for the listing agent
- It's been on market 144 days. Have you received any prior offers? Is the seller open to a 12% concession, seller financing, or rate buy-down credit?
- What's the actual annual flood-insurance premium (NFIP or private), and is the property in a SFHA with mandatory coverage?
- Why hasn't it sold? Are there any deal-killer items the seller is aware of (foundation, flood, title, zoning, code violations)?
- Is there a deadline driving the sale (1031 exchange, divorce, estate, relocation)? That informs how much negotiation room exists.
- What's the average days-on-market for RENTAL listings here right now (not sales)? A rising rental-DOM trend means longer vacancies and softer asking-rent achievability than the comps imply.
- What's the recent tenant-quality profile in this submarket — average credit score on applications, eviction rate, late-payment / NSF rate, and stable-employment percentage? A property-management company in the area should have these aggregated.
- How much new for-sale + rental construction is in the pipeline within 1–3 miles? Heavy new supply typically softens prices + rents 12–24 months out; constrained supply supports both.
Investment metrics
- 1% rule
- 1.16% ✓
- Cap rate
- 9.68%
- Cash-on-cash
- 12.11%
- DSCR
- 1.54
- GRM
- 7.2
CMA / ARV
- ARV (median comp)
- $181,266
- List price
- $155,000
- Delta
- -14.49%
- Verdict
- UNDERPRICED
- Comps
- 20 within 1.0 mi
Show comp detail 12 sales within ~0.75 mi
| Address | Dist | Beds/Ba | Sqft | Sold | Price | $/sf | Match |
|---|---|---|---|---|---|---|---|
| 2238 Clouet St | 0.23mi | 3/2.0 (-1) | 1,372 (-5%) | 10mo | $125,000 | $91 | 68 |
| 3130 N Tonti St | 0.19mi | 3/2.0 (-1) | 1,252 (-13%) | 5mo | $235,000 | $188 | 60 |
| 2334 Louisa St | 0.11mi | 3/2.5 (-1) | 1,645 (+14%) | 7mo | $215,000 | $131 | 58 |
| 1704 Desire St | 0.56mi | 3/2.0 (-1) | 1,500 (+4%) | 7mo | $200,000 | $133 | 56 |
| 4006 N Miro St | 0.44mi | 3/2.0 (-1) | 1,272 (-12%) | 4mo | $179,900 | $141 | 52 |
| 1437 Gallier St | 0.74mi | 3/2.0 (-1) | 1,451 (+1%) | 9mo | $65,000 | $45 | 52 |
| 1833 Saint Ferdinand St | 0.61mi | 4/2.5 | 1,551 (+8%) | 8mo | $130,000 | $84 | 50 |
| 1933 France St | 0.61mi | 3/2.0 (-1) | 1,358 (-6%) | 9mo | $45,000 | $33 | 50 |
| 1639 Independence St | 0.61mi | 3/2.0 (-1) | 1,340 (-7%) | 7mo | $220,000 | $164 | 49 |
| 2218 Feliciana St | 0.30mi | 3/2.5 (-1) | 1,645 (+14%) | 8mo | $210,000 | $128 | 49 |
| 1713 Desire St | 0.55mi | 4/2.0 | 1,654 (+15%) | 2mo | $235,000 | $142 | 48 |
| 1621 Congress St | 0.63mi | 3/2.0 (-1) | 1,237 (-14%) | 4mo | $190,000 | $154 | 38 |
Match score weights: distance 35% · size 25% · config 20% · recency 20%. Top-matched comps best support the ARV.
Projected returns pro-forma
-3.0% appreciation · 2.49% rent growth · sell at horizon
- IRR
- -16.4%
- Equity multiple
- 0.42×
- Total profit
- $-25,065
- Equity at exit
- $23,111
- IRR
- -9.0%
- Equity multiple
- 0.45×
- Total profit
- $-23,656
- Equity at exit
- $13,402
Cash invested: $43,400 (down + closing). Projections, not guarantees.
Landlord ↔ Tenant lean methodology
- Overall (STATE)
- 90 Strongly Landlord-Friendly
- State Louisiana
- 90 Strongly Landlord-Friendly · R+12
- County
- — inherits STATE
- City
- — inherits STATE
ZIP-level market 70117
- Rents YoY
- 2.5%
- Active inventory
- 587
- Price-to-rent
- 7.2×
Monthly cashflow live
- Estimated rent
- $1,803 high interval (Pro) →
- Mortgage (P&I)
- −$813
- Tax from tax record
- −$109 /mo · $1,303/yr
- Insurance
- −$65
- Flood insurance flood zone
- −$427 /mo · $5,118/yr
- HOA
- −$0
- Vacancy / Maint / Mgmt
- −$379
- Net cashflow
- $12
Break-even live
Sensitivity live
| Price | -10% $99 | -5% $55 | +0% $12 | +5% $-32 | +10% $-76 |
|---|---|---|---|---|---|
| Rent | -10% $-131 | -5% $-60 | +0% $12 | +5% $83 | +10% $154 |
| Rate | -1.0pp $90 | -0.5pp $51 | base $12 | +0.5pp $-29 | +1.0pp $-69 |
UW: 25.0% down · 7.5% · 30yr · 1.5% tax · 5.0% vac · 8.0% maint · 8.0% mgmt
Financing live
Cash to close
- Down payment
- $38,750
- Closing costs
- $4,650
- Reserves months
- —
- Total cash needed
- —
Loan-product check · same deal, 3 products live
Conventional
25% down · 7.5% · 30yr
- Down + closing
- —
- Monthly P&I
- —
- Monthly cashflow
- —
- DSCR
- —
- Eligible?
- —
Personal DTI + credit; lowest rate.
DSCR
20% down · 8.5% · 30yr
- Down + closing
- —
- Monthly P&I
- —
- Monthly cashflow
- —
- DSCR
- —
- Eligible?
- —
No personal income docs; deal must DSCR.
Hard money
10% down · 12.0% · 12mo
- Down + closing
- —
- Monthly P&I
- —
- Monthly cashflow
- —
- DSCR
- —
- Eligible?
- —
Short-term bridge; refi at stabilization.
Rent comps 40 comps
| Address | Beds | Baths | Sqft | Rent | $/sqft | DOM | Units | Dist |
|---|---|---|---|---|---|---|---|---|
| 2129 Desire St Unit 1B New Orleans, LA | 3.0 | 1.0 | 1105 | $1,200 | $1.09 | 4d | 1 | 0.22mi |
| 2129 Desire St Unit 1B New Orleans, LA | 3.0 | 1.0 | 1105 | $1,200 | $1.09 | 5d | 1 | 0.22mi |
| 2331 Feliciana St New Orleans, LA | 3.0 | 2.0 | 1250 | $1,850 | $1.48 | 25d | 1 | 0.23mi |
| 2028 Desire St New Orleans, LA | 3.0 | 1.0 | 1300 | $1,300 | $1.00 | 25d | 1 | 0.30mi |
| 2019 Gallier St New Orleans, LA | 4.0 | 2.0 | 1400 | $2,200 | $1.57 | 25d | 1 | 0.34mi |
| 2114 Feliciana St Unit A New Orleans, LA | 3.0 | 2.0 | 1134 | $1,500 | $1.32 | 25d | 1 | 0.34mi |
| 2114 Feliciana St Unit A New Orleans, LA | 3.0 | 2.0 | 1134 | $1,500 | $1.32 | 17d | 1 | 0.34mi |
| 1942 Piety St New Orleans, LA | 3.0 | 1.0 | 1100 | $1,500 | $1.36 | 25d | 1 | 0.35mi |
| 1904 Desire St New Orleans, LA | 3.0 | 1.0 | 1200 | $1,400 | $1.17 | 12d | 1 | 0.40mi |
| 1839 Louisa St New Orleans, LA | 3.0 | 2.0 | 1500 | $2,095 | $1.40 | 17d | 1 | 0.43mi |
| 1835 Louisa St New Orleans, LA | 3.0 | 2.5 | 1800 | $2,350 | $1.31 | 5d | 1 | 0.44mi |
| 1822 Piety St New Orleans, LA | 3.0 | 1.5 | 1200 | $1,500 | $1.25 | 17d | 1 | 0.46mi |
| 4217 N Johnson St New Orleans, LA | 3.0 | 2.0 | 904 | $1,650 | $1.83 | 25d | 1 | 0.60mi |
| 4222 N Johnson St New Orleans, LA | 3.0 | 2.0 | 1100 | $1,895 | $1.72 | 25d | 1 | 0.62mi |
| 2003 Almonaster Ave New Orleans, LA | 3.0 | 2.0 | 988 | $1,600 | $1.62 | 25d | 1 | 0.64mi |
| 1628 Bartholomew St New Orleans, LA | 3.0 | 2.0 | 1050 | $1,600 | $1.52 | 25d | 1 | 0.68mi |
| 5624-5626 Saint Claude ST New Orleans, LA | 4.0 | 3.0 | 1521 | $2,300 | $1.51 | 25d | 1 | 0.70mi |
| 3302 Metropolitan St New Orleans, LA | 4.0 | 2.5 | 1700 | $2,200 | $1.29 | 18d | 1 | 0.72mi |
| 1437 Gallier St New Orleans, LA | 3.0 | 2.0 | 1451 | $1,875 | $1.29 | 23d | 1 | 0.73mi |
| 3316 Metropolitan St New Orleans, LA | 3.0 | 2.0 | 1184 | $1,700 | $1.44 | 25d | 1 | 0.75mi |
| 2524 N Galvez St New Orleans, LA | 3.0 | 2.5 | 1102 | $1,800 | $1.63 | 18d | 1 | 0.79mi |
| 2522 N Galvez St New Orleans, LA | 3.0 | 2.0 | 1105 | $1,675 | $1.52 | 25d | 1 | 0.79mi |
| 1924 Painters St New Orleans, LA | 3.0 | 1.0 | 920 | $1,700 | $1.85 | 5d | 1 | 0.79mi |
| 1922 Painters St New Orleans, LA | 3.0 | 1.0 | 920 | $1,700 | $1.85 | 5d | 1 | 0.80mi |
| 2515 N Galvez St Unit 2515 New Orleans, LA | 4.0 | 2.0 | 1200 | $1,900 | $1.58 | 25d | 1 | 0.80mi |
| 2515 N Galvez St New Orleans, LA | 4.0 | 2.0 | 1200 | $1,200 | $1.00 | 12d | 1 | 0.80mi |
| 2556 N Tonti St New Orleans, LA | 3.0 | 2.0 | 1100 | $1,850 | $1.68 | 17d | 1 | 0.80mi |
| 4230 N Claiborne Ave New Orleans, LA | 3.0 | 2.5 | 1296 | $1,750 | $1.35 | 25d | 1 | 0.84mi |
| 1325 Pauline St New Orleans, LA | 3.0 | 2.0 | 1792 | $2,250 | $1.26 | 5d | 1 | 0.86mi |
| 1325 Pauline St New Orleans, LA | 3.0 | 2.0 | 1792 | $2,250 | $1.26 | 4d | 1 | 0.86mi |
| 1323 Pauline St New Orleans, LA | 3.0 | 2.0 | 1792 | $2,250 | $1.26 | 5d | 1 | 0.86mi |
| 2519 N Derbigny St New Orleans, LA | 3.0 | 1.0 | 994 | $1,300 | $1.31 | 23d | 1 | 0.87mi |
| 1411 France St New Orleans, LA | 3.0 | 2.0 | 1525 | $2,000 | $1.31 | 25d | 1 | 0.91mi |
| 1231 Feliciana St New Orleans, LA | 3.0 | 2.5 | 1869 | $2,750 | $1.47 | 45d | 1 | 0.92mi |
| 4318 N Robertson St New Orleans, LA | 3.0 | 1.0 | 1250 | $1,150 | $0.92 | 5d | 1 | 0.92mi |
| 4318 1/2 N Robertson St New Orleans, LA | 3.0 | 1.0 | 1250 | $1,150 | $0.92 | 4d | 1 | 0.93mi |
| 1403 Lesseps St New Orleans, LA | 3.0 | 3.0 | 1700 | $1,800 | $1.06 | 13d | 1 | 0.95mi |
| 1809 Saint Roch Ave New Orleans, LA | 3.0 | 1.0 | 949 | $1,195 | $1.26 | 18d | 1 | 0.96mi |
| 2222 Saint Roch Ave New Orleans, LA | 3.0 | 1.0 | 900 | $1,200 | $1.33 | 25d | 1 | 0.98mi |
| 1636 Music St New Orleans, LA | 3.0 | 1.0 | 900 | $1,185 | $1.32 | 17d | 1 | 0.98mi |
Listing history 25 events
-
2026-06-21days on market $155,000 Active 144 DOM
-
2026-06-18days on market $155,000 Active 141 DOM
-
2026-06-17days on market $155,000 Active 140 DOM
-
2026-06-16days on market $155,000 Active 139 DOM
-
2026-06-15days on market $155,000 Active 138 DOM
-
2026-06-13days on market $155,000 Active 136 DOM
-
2026-06-10days on market $155,000 Active 133 DOM
-
2026-06-09days on market $155,000 Active 132 DOM
-
2026-06-08days on market $155,000 Active 131 DOM
-
2026-06-07days on market $155,000 Active 130 DOM
-
2026-06-05days on market $155,000 Active 127 DOM
-
2026-06-03days on market $155,000 Active 126 DOM
-
2026-06-02days on market $155,000 Active 125 DOM
-
2026-06-01days on market $155,000 Active 124 DOM
-
2026-05-31days on market $155,000 Active 123 DOM
-
2026-05-20price $155,000 188-char remark
Show marketing remark (189 chars)
Single Family home located in the Upper Ninth Ward featuring an open floor plan with 4 bedrooms and 2 baths. Includes a covered carport and a spacious backyard. Easy access to I-10 and 610
-
2026-05-20price $155,000 189-char remark
Show marketing remark (189 chars)
Single Family home located in the Upper Ninth Ward featuring an open floor plan with 4 bedrooms and 2 baths. Includes a covered carport and a spacious backyard. Easy access to I-10 and 610
-
2026-02-25price $160,000 188-char remark
Show marketing remark (189 chars)
Single Family home located in the Upper Ninth Ward featuring an open floor plan with 4 bedrooms and 2 baths. Includes a covered carport and a spacious backyard. Easy access to I-10 and 610
-
2026-02-25price $160,000 189-char remark
Show marketing remark (189 chars)
Single Family home located in the Upper Ninth Ward featuring an open floor plan with 4 bedrooms and 2 baths. Includes a covered carport and a spacious backyard. Easy access to I-10 and 610
-
2026-01-28$165,000 Active 188-char remark
Show marketing remark (189 chars)
Single Family home located in the Upper Ninth Ward featuring an open floor plan with 4 bedrooms and 2 baths. Includes a covered carport and a spacious backyard. Easy access to I-10 and 610
-
2026-01-28$165,000 Active 189-char remark
Show marketing remark (189 chars)
Single Family home located in the Upper Ninth Ward featuring an open floor plan with 4 bedrooms and 2 baths. Includes a covered carport and a spacious backyard. Easy access to I-10 and 610
-
2004-02-04soldstatus $37,500
-
2003-12-29$37,500
-
2003-12-29$37,500
-
1981-07-17soldstatus $4,500
ⓘ Source: listings_history table (triggers on properties + properties_extension) + one-shot
backfill from property_details.listing_events for pre-trigger history.
Tax reassessment forecast LA · Resets to sale price
- Current annual tax
- $1,303 · $109/mo
- Projected year-2 tax
- $1,303 · $109/mo
- Expected delta
- $0/yr ($0/mo · 0.0%)
ⓘ Screening estimate from a state-policy table — verify with the county assessor before closing.
Climate risk First Street
- Flood 8/10 Severe FEMA zone AE · 78% chance over 30 yrs
- Wildfire 2/10 Low
- Heat 10/10 Extreme 7 d/yr ≥108°F today · 21 d/yr by 30 yrs out
- Wind 10/10 Extreme 99% chance of damaging wind over 30 yrs
- Air quality 3/10 Moderate 3 unhealthy d/yr today · 3 by 30 yrs out
Nearby sold comps map
Loading sold comps map…
Walkable amenities ~0.75 mi
Loading nearby amenities…
Taxation est. · year 1
- Rental income
- $21,631
- − Mortgage interest
- −$8,682
- − Property taxes
- −$1,303
- − Insurance
- −$5,894
- − Repairs & maintenance
- −$1,731
- − Management
- −$1,731
- − Depreciation
- −$4,509
- Taxable loss
- −$2,217
- Est. tax savings @ 24.0%
- +$532
- After-tax cash flow
- $671/yr
For passive investors: Depreciation is non-cash, so a rental often shows a tax loss while cash-flowing — sheltering income. Rental losses are passive: they offset passive income freely, and up to $25,000/yr can offset ordinary (W-2) income if you actively participate and your MAGI is under $100k (phasing out to $0 by $150k); unused losses carry forward. On sale, claimed depreciation is recaptured at up to 25%, and gains may owe capital-gains tax (a 1031 exchange can defer both). Figures are a year-1 estimate at your 24.0% rate — not tax advice; consult a CPA.
Schools (NCES district)
- District
- Orleans Parish
- NCES district ID
- 2201170
- Math proficiency
- 11% ▼ -52.00%
- Reading proficiency
- 27% ▼ -46.00%
- Median HH income
- $37,011
- Composite
- 15.78/100
- National rank
- #9271
- State rank
- #69 of 98 in LA
Livability — New Orleans
- Score
- 81/100
- State rank
- #3
- US rank
- #1383
Category grades
Schools grade is shown separately in the Schools card above.
Census & demographics
- Census place
- New Orleans, LA
- County
- Orleans Parish · 338,817 people
- City population
- 338,817
- Metro
- New Orleans-Metairie, LA
- Population (ZIP)
- 25,652
- Household income
- $45,764
- Rent vs Own
- Severe rent burden
- 1988.0
Population outlook (Orleans County) Hauer SSP2
- Today (2025)
- 513,025 people
- By 2030
- 575,781 · +12.2%
- By 2040
- 700,174 · +36.5%
- By 2050
- 826,541 · +61.1%
- By 2075
- 1,123,374 · +119.0%
- By 2100
- 1,355,609 · +164.2%
Race, ethnicity, and origin ACS 2023
- Neighborhood character
- Majority Black (60%)
- Race & ethnicity
- Black 60% White 30% Two or more races 6% Hispanic / Latino 5%
- Common ancestry
- Lithuanian 5% Italian 1% Romanian 1%
- Foreign-born
- 5% · Canada, South Korea
- Languages at home
- 93% English-only · Spanish 3% Other Indo-European 1% French/Haitian/Cajun 1%
Political lean MEDSL · Orleans
- 2024 margin
- Solid D (+67.0) · D 82.2% · R 15.2% · Other 2.7%
- 2008→2024 swing
- +6.7pp toward D · 2008: 60.3pp · 2024: 67.0pp
- All cycles
- 2024: D+67.0 2020: D+68.2 2016: D+66.2 2012: D+62.5 2008: D+60.3
Not yet ingested
- Civics
- —
Market trends
- HPI YoY
- ▼ -177.22%
- Current HPI
- 184.6061
- Rent YoY
- ▲ 2.49%
- Metro
- New Orleans-Metairie, LA
- State GDP YoY
- ▲ 3.29%
- F500 in state
- 10
Industry mix (Fortune 500 HQ in LA)
| Industry | F500 HQs | Revenue |
|---|---|---|
| Telecommunications | 2 | $23B |
|
||
| Utilities | 1 | $12B |
|
||
| Wholesale / Distribution | 1 | $5B |
|
||
| Advertising | 1 | $2B |
|
||
Price history
+3344.4% since first listed10 events — show timeline
- 2026-05-20 Price Changed $155,000 AcadianaMLS
- 2026-05-20 Price Changed $155,000 GSREIN
- 2026-02-25 Price Changed $160,000 AcadianaMLS
- 2026-02-25 Price Changed $160,000 GSREIN
- 2026-01-28 Listed $165,000 GSREIN
- 2026-01-28 Listed $165,000 AcadianaMLS
- 2004-02-04 Sold (MLS) $37,500 GSREIN
- 2003-12-29 Listed $37,500 GSREIN
- 2003-12-29 Listed $37,500 AcadianaMLS
- 1981-07-17 Sold (Public Records) $4,500 Public Records
Property tax history
-2.3%/yrLatest (2026): $1,303 · +1.1% YoY. Source: county tax records.
Cash-flow waterfall
monthlySold comps — $/sqft
last 12 mo · ≤1 miLoading sold comps…