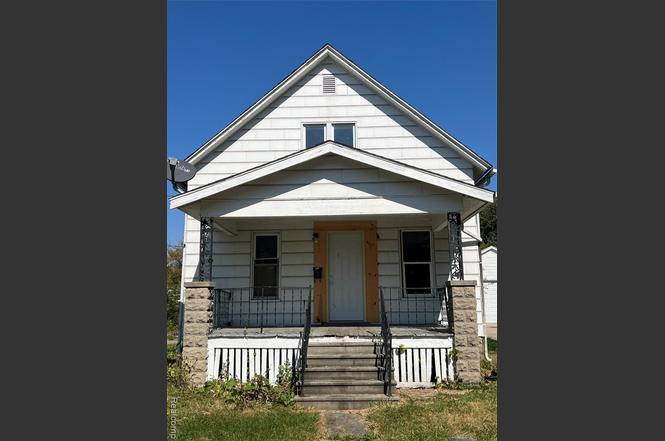
1756 Jordan St · Saginaw, MI
Flood risk 1/10 · Minimal
- FEMA flood zone
- X (unshaded)
- Chance of flooding over 30 yrs
- 0.0%
- Est. flood insurance / yr
- $473 – $860
Fire risk 1/10 · Minimal
- Est. fire insurance / yr
- $784 – $1,456
Heat risk 2/10 · Minimal
- Hot days now (above 99°F)
- 7 days/yr
- Hot days in 30 yrs
- 14 days/yr
Wind risk 1/10 · Minimal
- Chance of severe wind over 30 yrs
- —
Air-quality risk 2/10 · Minimal
- Unhealthy air days now
- 1 days/yr
- Unhealthy air days in 30 yrs
- 2 days/yr
Risk factors via First Street. Map © Google.
Why this score? — see what drove the B- grade
The composite is a weighted blend of 9 inputs, each scored 0–100. Each bar is that input's sub-score; the figure is the points it added to the 100-point composite (weight × sub-score).
- Cash flow +29.6/30.0
- DSCR +10.0/10.0
- 1% rule +8.7/10.0
- ARV discount +8.3/15.0
- Rent growth +3.5/5.0
- Livability +3.2/5.0
- Condition / age +2.5/5.0
- Schools +2.0/10.0
- Appreciation +0.0/10.0
$75,000
🖨 Deal sheet (PDF) 📄 Offer letter ✓ Due diligence
Listing remarks MLS
Landlords/Investors, enjoy the guaranteed rental payments with this Section 8 rental property. This 3-bedroom property has undergone recent painting, floors stained, and other updates. Section 8 pays directly to the owner. The rent is $1185, the landlord receives Positive Cash Flow. Do Not Disturb tenants! Serious buyers only!
Key facts
- 0.24 acre lot
- 2 garage spots
- Built 1904
Property features AI
Exterior
- Parking: Detached garage (about 2.5 car capacity)
- Utilities: Public sewer
- Home design: Single-family residence; One and one-half stories; Ground-level entry with steps
- Construction: Aluminum siding; Block foundation
- Exterior features: Paved road access; Lot dimensions approximately 58.7 x 176 (0.24 acre)
Interior
- Bathrooms: 1 full bathroom
- Heating & cooling: Forced air heating (natural gas); No central cooling
- Interior features: Unfinished basement; Total of 5 rooms
Neighborhood map
What this means for you Summary
Snapshot
- This is a 3-bed/1.0-bath single-family listed at $75k.
Deal economics
- At list price, monthly cash flow is $270 ($3k/yr) — positive.
- The deal already cash-flows at list — no discount required.
- Meets the 1% rule at list price ($1k rent vs $75k).
- Recommended offer: $66k (12.0% below list) — sets the bar for market timing.
- Cap rate 10.6% vs local median 8.3% in Saginaw — meaningfully above typical; check what's discounted (condition, days-on-market, listing class) to confirm the premium yield is real.
Location & tenants
- Location reads 63/100 on livability (#521 in MI) — a middle-class / working-renter tenant base. Strengths: cost of living A+, housing A+, health & safety A+; Watch: schools F, crime F, amenities F.
- Saginaw School District (urban): math 20% / reading 29% proficiency, ranked #444 of 540 in MI (top 82%) — low school quality limits family demand, transient renter base, plan for 1-2y turnover; 76% free/reduced lunch — lower-income household profile, screen leases tightly.
- Market conditions: Rents rising (+4.0%/yr); 250 active listings in the ZIP; 2 comparable units currently listed for rent nearby; 154 units permitted in Saginaw County in 2024 (0 in 5+ unit buildings).
Forward outlook
- Local home prices are declining (-3.0%/yr); year-one equity from $519 of loan paydown is wiped out by about $2k of value loss. Plan a longer hold.
- Saginaw County population projected at -25% by 2050 — secular population decline; favor cash flow + early exit over multi-decade hold.
- At projected returns (-3.0% appreciation + 4.0% rent growth), your $21k cash investment doubles in ~8 years — after that, you're playing with house money.
Negotiation context
- It's been on market 375 days — a 12% lower offer ($66k) is reasonable based on typical stale-listing flexibility.
- 6 sale attempts since 23y ago with the ask held roughly flat each time — persistent listings suggest the price (not the market) is what's stuck; bring a comps-based counter.
Risks & watch-outs
- Watch-outs: built in 1904 — expect roof / HVAC / electrical / plumbing capex.
Questions for the listing agent
- It's been on market 375 days. Have you received any prior offers? Is the seller open to a 12% concession, seller financing, or rate buy-down credit?
- Built in 1904 — when were the roof, HVAC, electrical panel, plumbing, and water heater last replaced?
- Why hasn't it sold? Are there any deal-killer items the seller is aware of (foundation, flood, title, zoning, code violations)?
- Is there a deadline driving the sale (1031 exchange, divorce, estate, relocation)? That informs how much negotiation room exists.
- Schools are F-rated, which usually means shorter tenancies and higher turnover. Who's the typical renter profile here, and what's been the actual vacancy rate?
- Crime grade is F in this area — have there been break-ins, vandalism, or insurance claims at this property in the last 3 years? What carrier currently insures it and at what premium?
- What's the average days-on-market for RENTAL listings here right now (not sales)? A rising rental-DOM trend means longer vacancies and softer asking-rent achievability than the comps imply.
- What's the recent tenant-quality profile in this submarket — average credit score on applications, eviction rate, late-payment / NSF rate, and stable-employment percentage? A property-management company in the area should have these aggregated.
- How much new for-sale + rental construction is in the pipeline within 1–3 miles? Heavy new supply typically softens prices + rents 12–24 months out; constrained supply supports both.
Investment metrics
- 1% rule
- 1.37% ✓
- Cap rate
- 10.61%
- Cash-on-cash
- 15.43%
- DSCR
- 1.69
- GRM
- 6.1
CMA / ARV
- ARV (on-the-fly)
- $76,440
- Comps found
- 12
Show comp detail 12 sales within ~0.75 mi
| Address | Dist | Beds/Ba | Sqft | Sold | Price | $/sf | Match |
|---|---|---|---|---|---|---|---|
| 819 Grove St | 0.12mi | 3/1.0 | 1,298 (+10%) | 3mo | $85,000 | $65 | 74 |
| 1843 Kendrick St | 0.14mi | 3/1.0 | 1,296 (+10%) | 4mo | $47,000 | $36 | 73 |
| 1013 Maple St | 0.10mi | 3/1.0 | 1,034 (-12%) | 2mo | $66,000 | $64 | 73 |
| 1757 Burnham Dr | 0.22mi | 4/1.0 (+1) | 1,097 (-7%) | 2mo | $63,000 | $57 | 72 |
| 2116 W Michigan Ave | 0.52mi | 3/1.0 | 1,159 (-1%) | 4mo | $125,000 | $108 | 70 |
| 1 Southlawn Ct | 0.39mi | 3/1.0 | 1,090 (-7%) | 4mo | $116,900 | $107 | 66 |
| 202 S Wheeler St | 0.56mi | 3/1.0 | 1,228 (+4%) | 2mo | $96,900 | $79 | 65 |
| 1521 Chestnut St | 0.50mi | 3/1.5 | 1,118 (-5%) | 6mo | $102,000 | $91 | 62 |
| 1430 Marquette St | 0.42mi | 3/1.0 | 1,301 (+11%) | 5mo | $30,000 | $23 | 58 |
| 1522 Gilbert St | 0.63mi | 2/1.0 (-1) | 1,112 (-5%) | 1mo | $67,000 | $60 | 56 |
| 1811 Allegan St | 0.64mi | 3/1.0 | 1,316 (+12%) | 3mo | $70,000 | $53 | 47 |
| 123 Vermont St | 0.66mi | 2/1.0 (-1) | 1,010 (-14%) | 5mo | $78,000 | $77 | 36 |
Match score weights: distance 35% · size 25% · config 20% · recency 20%. Top-matched comps best support the ARV.
Projected returns pro-forma
-3.0% appreciation · 3.98% rent growth · sell at horizon
- IRR
- 7.3%
- Equity multiple
- 1.29×
- Total profit
- $6,090
- Equity at exit
- $11,183
- IRR
- 17.5%
- Equity multiple
- 2.52×
- Total profit
- $31,829
- Equity at exit
- $6,485
Cash invested: $21,000 (down + closing). Projections, not guarantees.
Landlord ↔ Tenant lean methodology
- Overall (STATE)
- 62 Landlord-Friendly
- State Michigan
- 62 Landlord-Friendly · EVEN
- County
- — inherits STATE
- City
- — inherits STATE
ZIP-level market 48602
- Home prices YoY
- -19.7%
- Rents YoY
- 4.0%
- Active inventory
- 250
- Price-to-rent
- 6.1×
Monthly cashflow live
- Estimated rent
- $1,025 medium interval (Pro) →
- Mortgage (P&I)
- −$393
- Tax from tax record
- −$115 /mo · $1,378/yr
- Insurance
- −$31
- HOA
- −$0
- Vacancy / Maint / Mgmt
- −$215
- Net cashflow
- $270
Break-even live
Sensitivity live
| Price | -10% $312 | -5% $291 | +0% $270 | +5% $249 | +10% $228 |
|---|---|---|---|---|---|
| Rent | -10% $189 | -5% $230 | +0% $270 | +5% $310 | +10% $351 |
| Rate | -1.0pp $308 | -0.5pp $289 | base $270 | +0.5pp $251 | +1.0pp $231 |
UW: 25.0% down · 7.5% · 30yr · 1.5% tax · 5.0% vac · 8.0% maint · 8.0% mgmt
Financing live
Cash to close
- Down payment
- $18,750
- Closing costs
- $2,250
- Reserves months
- —
- Total cash needed
- —
Loan-product check · same deal, 3 products live
Conventional
25% down · 7.5% · 30yr
- Down + closing
- —
- Monthly P&I
- —
- Monthly cashflow
- —
- DSCR
- —
- Eligible?
- —
Personal DTI + credit; lowest rate.
DSCR
20% down · 8.5% · 30yr
- Down + closing
- —
- Monthly P&I
- —
- Monthly cashflow
- —
- DSCR
- —
- Eligible?
- —
No personal income docs; deal must DSCR.
Hard money
10% down · 12.0% · 12mo
- Down + closing
- —
- Monthly P&I
- —
- Monthly cashflow
- —
- DSCR
- —
- Eligible?
- —
Short-term bridge; refi at stabilization.
Rent comps 2 comps
| Address | Beds | Baths | Sqft | Rent | $/sqft | DOM | Units | Dist |
|---|---|---|---|---|---|---|---|---|
| 1827 Gilbert St Saginaw, MI | 3.0 | 2.0 | 1008 | $695 | $0.69 | 44d | 1 | 0.51mi |
| 2021 Grout St Saginaw, MI | 1.0–2.0 | 1.0 | 862 | $995 | $1.15 | 44d | 1 | 0.61mi |
Listing history 28 events
-
2026-06-19days on market $75,000 Active 375 DOM
-
2026-06-18days on market $75,000 Active 374 DOM
-
2026-06-17days on market $75,000 Active 373 DOM
-
2026-06-16days on market $75,000 Active 372 DOM
-
2026-06-15days on market $75,000 Active 371 DOM
-
2026-06-14days on market $75,000 Active 369 DOM
-
2026-06-12days on market $75,000 Active 368 DOM
-
2026-06-09days on market $75,000 Active 365 DOM
-
2026-06-08days on market $75,000 Active 364 DOM
-
2026-06-07days on market $75,000 Active 363 DOM
-
2026-06-05days on market $75,000 Active 360 DOM
-
2026-06-03days on market $75,000 Active 359 DOM
-
2026-06-02days on market $75,000 Active 358 DOM
-
2026-06-01days on market $75,000 Active 357 DOM
-
2026-05-31days on market $75,000 Active 356 DOM
-
2026-05-30days on market $75,000 Active 355 DOM
-
2026-01-20status Active 328-char remark
Show marketing remark (328 chars)
Landlords/Investors, enjoy the guaranteed rental payments with this Section 8 rental property. This 3-bedroom property has undergone recent painting, floors stained, and other updates. Section 8 pays directly to the owner. The rent is $1185, the landlord receives Positive Cash Flow. Do Not Disturb tenants! Serious buyers only!
-
2026-01-20status Active
Show marketing remark (328 chars)
Landlords/Investors, enjoy the guaranteed rental payments with this Section 8 rental property. This 3-bedroom property has undergone recent painting, floors stained, and other updates. Section 8 pays directly to the owner. The rent is $1185, the landlord receives Positive Cash Flow. Do Not Disturb tenants! Serious buyers only!
-
2026-01-10status Pending 328-char remark
Show marketing remark (328 chars)
Landlords/Investors, enjoy the guaranteed rental payments with this Section 8 rental property. This 3-bedroom property has undergone recent painting, floors stained, and other updates. Section 8 pays directly to the owner. The rent is $1185, the landlord receives Positive Cash Flow. Do Not Disturb tenants! Serious buyers only!
-
2026-01-10status Pending
Show marketing remark (328 chars)
Landlords/Investors, enjoy the guaranteed rental payments with this Section 8 rental property. This 3-bedroom property has undergone recent painting, floors stained, and other updates. Section 8 pays directly to the owner. The rent is $1185, the landlord receives Positive Cash Flow. Do Not Disturb tenants! Serious buyers only!
-
2025-05-30$75,000 Active
Show marketing remark (328 chars)
Landlords/Investors, enjoy the guaranteed rental payments with this Section 8 rental property. This 3-bedroom property has undergone recent painting, floors stained, and other updates. Section 8 pays directly to the owner. The rent is $1185, the landlord receives Positive Cash Flow. Do Not Disturb tenants! Serious buyers only!
-
2025-05-30$75,000 Active 328-char remark
Show marketing remark (328 chars)
Landlords/Investors, enjoy the guaranteed rental payments with this Section 8 rental property. This 3-bedroom property has undergone recent painting, floors stained, and other updates. Section 8 pays directly to the owner. The rent is $1185, the landlord receives Positive Cash Flow. Do Not Disturb tenants! Serious buyers only!
-
2021-12-01soldstatus $100,000
-
2003-12-19historical 126-char remark
Show marketing remark (126 chars)
Reo property to be sold in "as is" condition/3 BRS, full basement, 2 1/2 car detached garge/home in need of repairs.
-
2003-12-16soldstatus $25,000 126-char remark
Show marketing remark (126 chars)
Reo property to be sold in "as is" condition/3 BRS, full basement, 2 1/2 car detached garge/home in need of repairs.
-
2003-12-16soldstatus $25,000
Show marketing remark (126 chars)
Reo property to be sold in "as is" condition/3 BRS, full basement, 2 1/2 car detached garge/home in need of repairs.
-
2003-11-18$22,000 126-char remark
Show marketing remark (126 chars)
Reo property to be sold in "as is" condition/3 BRS, full basement, 2 1/2 car detached garge/home in need of repairs.
-
2003-11-18$22,000
Show marketing remark (126 chars)
Reo property to be sold in "as is" condition/3 BRS, full basement, 2 1/2 car detached garge/home in need of repairs.
ⓘ Source: listings_history table (triggers on properties + properties_extension) + one-shot
backfill from property_details.listing_events for pre-trigger history.
Tax reassessment forecast MI · Partial reset (capped growth)
- Current annual tax
- $1,378 · $115/mo
- Projected year-2 tax
- $1,378 · $115/mo
- Expected delta
- $0/yr ($0/mo · 0.0%)
ⓘ Screening estimate from a state-policy table — verify with the county assessor before closing.
Climate risk First Street
- Flood 1/10 Low FEMA zone X (unshaded) · 0% chance over 30 yrs
- Wildfire 1/10 Low
- Heat 2/10 Low 7 d/yr ≥99°F today · 14 d/yr by 30 yrs out
- Wind 1/10 Low
- Air quality 2/10 Low 1 unhealthy d/yr today · 2 by 30 yrs out
Nearby sold comps map
Loading sold comps map…
Walkable amenities ~0.75 mi
Loading nearby amenities…
Taxation est. · year 1
- Rental income
- $12,294
- − Mortgage interest
- −$4,201
- − Property taxes
- −$1,378
- − Insurance
- −$375
- − Repairs & maintenance
- −$984
- − Management
- −$984
- − Depreciation
- −$2,182
- Taxable income
- $2,191
- Est. tax owed @ 24.0%
- −$526
- After-tax cash flow
- $2,714/yr
For passive investors: Depreciation is non-cash, so a rental often shows a tax loss while cash-flowing — sheltering income. Rental losses are passive: they offset passive income freely, and up to $25,000/yr can offset ordinary (W-2) income if you actively participate and your MAGI is under $100k (phasing out to $0 by $150k); unused losses carry forward. On sale, claimed depreciation is recaptured at up to 25%, and gains may owe capital-gains tax (a 1031 exchange can defer both). Figures are a year-1 estimate at your 24.0% rate — not tax advice; consult a CPA.
Schools (NCES district)
- District
- Saginaw School District
- NCES district ID
- 2630390
- Math proficiency
- 20% ▼ -5.00%
- Reading proficiency
- 29% ▼ -3.00%
- Median HH income
- $28,940
- Composite
- 19.6/100
- National rank
- #8755
- State rank
- #444 of 540 in MI
Livability — Saginaw
- Score
- 63/100
- State rank
- #521
- US rank
- #15424
Category grades
Schools grade is shown separately in the Schools card above.
Census & demographics
- Census place
- Saginaw, MI
- County
- Saginaw County · 54,884 people
- City population
- 54,884
- Metro
- Saginaw, MI
- Population (ZIP)
- 27,127
- Household income
- $46,984
- Rent vs Own
- Severe rent burden
- 1416.0
Population outlook (Saginaw County) Hauer SSP2
- Today (2025)
- 180,568 people
- By 2030
- 172,302 · -4.6%
- By 2040
- 153,919 · -14.8%
- By 2050
- 135,519 · -24.9%
- By 2075
- 97,199 · -46.2%
- By 2100
- 65,037 · -64.0%
Race, ethnicity, and origin ACS 2023
- Neighborhood character
- Diverse neighborhood (Simpson 0.64)
- Race & ethnicity
- White 50% Black 27% Hispanic / Latino 17% Two or more races 12%
- Hispanic origin (detail)
- Mexican 14% Puerto Rican 1%
- Common ancestry
- Romanian 4% Lithuanian 3% Italian 2%
- Foreign-born
- 1% · Canada
- Languages at home
- 96% English-only · Spanish 3%
Political lean MEDSL · Saginaw
- 2024 margin
- Toss-up / Even · D 47.7% · R 51.0% · Other 1.4%
- 2008→2024 swing
- -20.6pp toward R · 2008: 17.3pp · 2024: -3.3pp
- All cycles
- 2024: R+3.3 2020: D+0.3 2016: R+1.1 2012: D+11.9 2008: D+17.3
Not yet ingested
- Civics
- —
Market trends
- HPI YoY
- ▼ -39.15%
- Current HPI
- 159.8807
- Rent YoY
- ▲ 3.98%
- Metro
- Saginaw, MI
- State GDP YoY
- ▲ 1.37%
- F500 in state
- 28
Industry mix (Fortune 500 HQ in MI)
| Industry | F500 HQs | Revenue |
|---|---|---|
| Automotive Parts | 3 | $48B |
|
||
| Automotive | 2 | $372B |
|
||
| Chemicals | 1 | $45B |
|
||
| Automotive Retail | 1 | $29B |
|
||
| Healthcare / Medical Devices | 1 | $23B |
|
||
| Automotive Technology | 1 | $20B |
|
||
Price history
+240.9% since first listed12 events — show timeline
- 2026-01-20 Relisted — MiRealSource-MiMLS
- 2026-01-20 Relisted — REALCOMP
- 2026-01-10 Pending — MiRealSource-MiMLS
- 2026-01-10 Pending — REALCOMP
- 2025-05-30 Listed $75,000 REALCOMP
- 2025-05-30 Listed $75,000 MiRealSource-MiMLS
- 2021-12-01 Sold (Public Records) $100,000 Public Records
- 2003-12-19 Listing Removed — MiRealSource-MiMLS
- 2003-12-16 Sold (MLS) $25,000 REALCOMP
- 2003-12-16 Sold (MLS) $25,000 MiRealSource-MiMLS
- 2003-11-18 Listed $22,000 REALCOMP
- 2003-11-18 Listed $22,000 MiRealSource-MiMLS
Property tax history
-0.0%/yrLatest (2025): $1,378 · -16.3% YoY. Source: county tax records.
Cash-flow waterfall
monthlySold comps — $/sqft
last 12 mo · ≤1 miLoading sold comps…