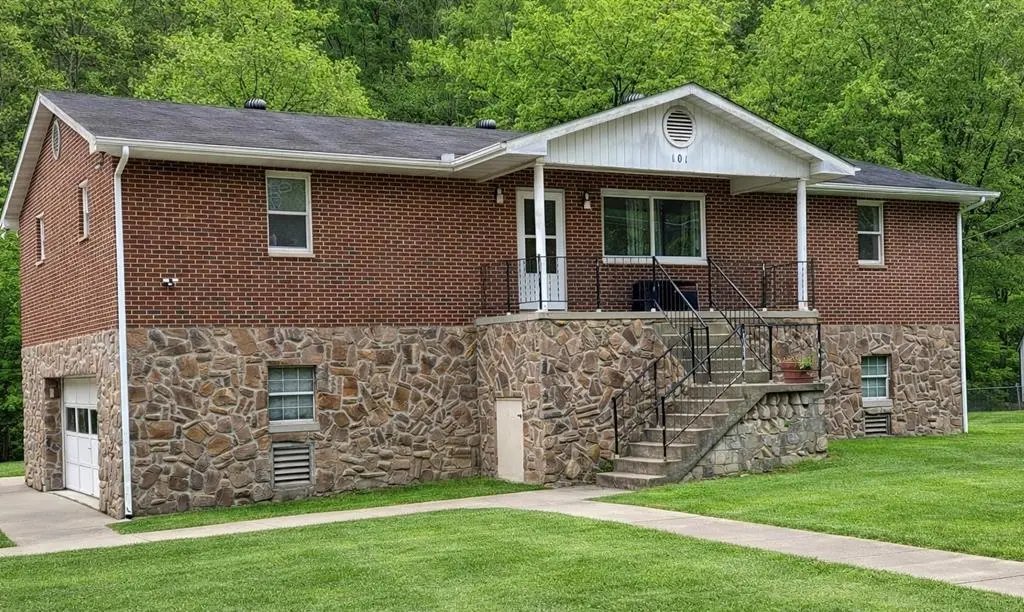
101 Taylor Frk · South Williamson, KY
Flood risk 9/10 · Severe
- FEMA flood zone
- X (shaded)
- Chance of flooding over 30 yrs
- 0.99%
- Est. flood insurance / yr
- $473 – $860
Fire risk 5/10 · Moderate
- Est. fire insurance / yr
- $839 – $1,559
Heat risk 4/10 · Minor
- Hot days now (above 102°F)
- 7 days/yr
- Hot days in 30 yrs
- 20 days/yr
Wind risk 2/10 · Minimal
- Chance of severe wind over 30 yrs
- 1.0%
Air-quality risk 1/10 · Minimal
- Unhealthy air days now
- 0 days/yr
- Unhealthy air days in 30 yrs
- 0 days/yr
Risk factors via First Street. Map © Google.
Why this score? — see what drove the D grade
The composite is a weighted blend of 9 inputs, each scored 0–100. Each bar is that input's sub-score; the figure is the points it added to the 100-point composite (weight × sub-score).
- Cash flow +11.0/30.0
- ARV discount +8.1/15.0
- Appreciation +5.5/10.0
- Livability +3.4/5.0
- DSCR +3.2/10.0
- Schools +2.6/10.0
- Rent growth +2.5/5.0
- Condition / age +2.5/5.0
- 1% rule +2.3/10.0
$155,000
🖨 Deal sheet 📄 Offer letter ✓ Due diligence
Listing remarks
Nice 3 Bedroom / 2 Bath Brick conveniently located on Taylor Fork and in Turkey Creek just minutes away from the ARH Hospital. Downtown Williamson and right in the heart of the Hatfield McCoy ATV Trail System. This home sits on a beautiful 1.5+/- acre lot with a concrete driveway. Inside is a spacious living area, dining room, laundry room and a spacious 4 car attached garage area that offers storage/workshop/exercise area on the bottom level of the the home. This home also has a large deck on the rear of the house for entertaining and a covered front porch for relaxing in the evening or sipping on coffee in the mornings.
Key facts
- Attached garage
- Spacious living area
- Laundry room
Tags
Property features AI
Exterior
- Parking: 3-car attached garage; Concrete driveway/parking
- Utilities: Public water; Public sewer
- Home design: Single family residence; Residential property; 2 stories
- Construction: Brick construction; Shingle roof
- Exterior features: Deck; Porch; 1.5-acre lot
Interior
- Kitchen: Microwave; Refrigerator; Cooktop
- Flooring: Carpet; Vinyl
- Heating & cooling: Central air; Ceiling fan(s); Natural gas heating
- Interior features: Insulated windows; 7 total rooms
Neighborhood map
What this means for you Summary
Snapshot
- This is a 3-bed/2.0-bath single-family listed at $155k.
Deal economics
- At list price, monthly cash flow is $-121 ($-1k/yr) — negative.
- To cash-flow at today's rent, offer at most $134k (13.8% below list).
- To meet the 1% rule (rent ≥ 1% of price), the offer needs to be $113k (27.3% below list).
- Recommended offer: $113k (27.3% below list) — sets the bar for 1% rule.
Location & tenants
- Location reads 68/100 on livability (#193 in KY) — a middle-class / working-renter tenant base. Strengths: crime A+, employment A+, cost of living A+; Watch: amenities F, commute F, health & safety F.
- Pike County (rural): math 24% / reading 40% proficiency, ranked #98 of 165 in KY (top 59%) — families likely to look elsewhere, expect single-tenant / working-renter base with shorter leases.
- Zoned schools: Belfry High School (math 17% / reading 42%, grade F, #127 of 254 statewide, top 58%, 531 students, 62% FRL).
- Market conditions: 12 active listings in the ZIP; 4 units permitted in Pike County in 2024 (0 in 5+ unit buildings).
Forward outlook
- In year one you build about $3k of equity ($1k loan paydown + $2k appreciation (1.1% local appreciation)).
- Pike County population projected at -33% by 2050 — secular population decline; favor cash flow + early exit over multi-decade hold.
Negotiation context
- It's been on market 32 days — a 3% lower offer ($150k) is reasonable based on typical stale-listing flexibility.
- 2 sale attempts; this cycle's ask has dropped $15k (9%) from the opening price — seller is motivated, your offer sets the floor, not the list.
- Current owner paid $75k; list at $155k implies a 107% gain — meaningful room to come down on a strong offer.
Risks & watch-outs
- Watch-outs: flood insurance adds $56/mo.
- Climate carrying-cost: severe flood risk; moderate wildfire risk — expect insurance premiums to compound above CPI over the hold.
Questions for the listing agent
- What do current leases actually rent for vs. the listed asking? Can we see a recent rent roll and the last 12 months of T-12 income?
- It's been on market 32 days. Have you received any prior offers? Is the seller open to a 27% concession, seller financing, or rate buy-down credit?
- Built in 1974 — when were the roof, HVAC, electrical panel, plumbing, and water heater last replaced?
- What's the actual annual flood-insurance premium (NFIP or private), and is the property in a SFHA with mandatory coverage?
- Is there a deadline driving the sale (1031 exchange, divorce, estate, relocation)? That informs how much negotiation room exists.
- Schools are F-rated, which usually means shorter tenancies and higher turnover. Who's the typical renter profile here, and what's been the actual vacancy rate?
- The area grade is low — what's the realistic commute time and amenity access for the typical tenant pool here? Any planned neighborhood developments (good or bad) we should know about?
- What's the average days-on-market for RENTAL listings here right now (not sales)? A rising rental-DOM trend means longer vacancies and softer asking-rent achievability than the comps imply.
- What's the recent tenant-quality profile in this submarket — average credit score on applications, eviction rate, late-payment / NSF rate, and stable-employment percentage? A property-management company in the area should have these aggregated.
- How much new for-sale + rental construction is in the pipeline within 1–3 miles? Heavy new supply typically softens prices + rents 12–24 months out; constrained supply supports both.
Investment metrics
- 1% rule
- 0.73% ✗
- Cap rate
- 5.79%
- Cash-on-cash
- -1.81%
- DSCR
- 0.92
- GRM
- 11.5
CMA / ARV
- ARV (on-the-fly)
- $157,035
- Comps found
- 2
Show comp detail 2 sales within ~0.75 mi
| Address | Dist | Beds/Ba | Sqft | Sold | Price | $/sf | Match |
|---|---|---|---|---|---|---|---|
| 82 Caney Frk | 0.42mi | 3/2.0 | 1,650 (-0%) | 12mo | $156,500 | $95 | 71 |
| 290 Taylor Frk | 0.10mi | 4/1.0 (+1) | 1,750 (+6%) | 8mo | $60,000 | $34 | 70 |
Match score weights: distance 35% · size 25% · config 20% · recency 20%. Top-matched comps best support the ARV.
Projected returns pro-forma
1.06% appreciation · 3.0% rent growth · sell at horizon
- IRR
- -2.0%
- Equity multiple
- 0.90×
- Total profit
- $-4,393
- Equity at exit
- $53,378
- IRR
- 3.0%
- Equity multiple
- 1.36×
- Total profit
- $15,815
- Equity at exit
- $71,295
Cash invested: $43,400 (down + closing). Projections, not guarantees.
Landlord ↔ Tenant lean methodology
- Overall (STATE)
- 83 Strongly Landlord-Friendly
- State Kentucky
- 83 Strongly Landlord-Friendly · R+16
- County
- — inherits STATE
- City
- — inherits STATE
ZIP-level market 41514
- Home prices YoY
- 0.9%
- Active inventory
- 12
- Price-to-rent
- 11.5×
Monthly cashflow live
- Estimated rent
- $1,127 medium interval (Pro) →
- Mortgage (P&I)
- −$813
- Tax from tax record
- −$79 /mo · $945/yr
- Insurance
- −$65
- Flood insurance flood zone
- −$56 /mo · $666/yr
- HOA
- −$0
- Vacancy / Maint / Mgmt
- −$237
- Net cashflow
- $-121
Break-even live
UW: 25.0% down · 7.5% · 30yr · 1.5% tax · 5.0% vac · 8.0% maint · 8.0% mgmt
Financing live
Cash to close
- Down payment
- $38,750
- Closing costs
- $4,650
- Reserves months
- —
- Total cash needed
- —
Loan-product check · same deal, 3 products live
Conventional
25% down · 7.5% · 30yr
- Down + closing
- —
- Monthly P&I
- —
- Monthly cashflow
- —
- DSCR
- —
- Eligible?
- —
Personal DTI + credit; lowest rate.
DSCR
20% down · 8.5% · 30yr
- Down + closing
- —
- Monthly P&I
- —
- Monthly cashflow
- —
- DSCR
- —
- Eligible?
- —
No personal income docs; deal must DSCR.
Hard money
10% down · 12.0% · 12mo
- Down + closing
- —
- Monthly P&I
- —
- Monthly cashflow
- —
- DSCR
- —
- Eligible?
- —
Short-term bridge; refi at stabilization.
Listing history 17 events
-
2026-06-16status $155,000 Pending 32 DOM
-
2026-06-15days on market $155,000 Active 32 DOM
-
2026-06-13days on market $155,000 Active 30 DOM
-
2026-06-12days on market $155,000 Active 29 DOM
-
2026-06-09days on market $155,000 Active 26 DOM
-
2026-06-08days on market $155,000 Active 25 DOM
-
2026-06-07days on market $155,000 Active 24 DOM
-
2026-06-07days on market $155,000 Active 23 DOM
-
2026-06-04days on market $155,000 Active 20 DOM
-
2026-06-02days on market $155,000 Active 19 DOM
-
2026-06-01days on market $155,000 Active 18 DOM
-
2026-05-31days on market $155,000 Active 17 DOM
-
2026-05-31days on market $155,000 Active 16 DOM
-
2026-05-25status Active
-
2026-05-25price $155,000
-
2026-04-14$170,000 Active
-
2005-06-01soldstatus $75,000
ⓘ Source: listings_history table (triggers on properties + properties_extension) + one-shot
backfill from property_details.listing_events for pre-trigger history.
Tax reassessment forecast KY · Resets to sale price
- Current annual tax
- $945 · $79/mo
- Projected year-2 tax
- $1,333 · $111/mo
- Expected delta
- +$388/yr (+$32/mo · 41.1%)
ⓘ Screening estimate from a state-policy table — verify with the county assessor before closing.
Climate risk First Street
- Flood 9/10 Extreme FEMA zone X (shaded) · 99% chance over 30 yrs
- Wildfire 5/10 Major
- Heat 4/10 Moderate 7 d/yr ≥102°F today · 20 d/yr by 30 yrs out
- Wind 2/10 Low 100% chance of damaging wind over 30 yrs
- Air quality 1/10 Low 0 unhealthy d/yr today · 0 by 30 yrs out
Nearby sold comps map
Loading sold comps map…
Walkable amenities ~0.75 mi
Loading nearby amenities…
Taxation est. · year 1
- Rental income
- $13,529
- − Mortgage interest
- −$8,682
- − Property taxes
- −$945
- − Insurance
- −$1,442
- − Repairs & maintenance
- −$1,082
- − Management
- −$1,082
- − Depreciation
- −$4,509
- Taxable loss
- −$4,213
- Est. tax savings @ 24.0%
- +$1,011
- After-tax cash flow
- $-441/yr
For passive investors: Depreciation is non-cash, so a rental often shows a tax loss while cash-flowing — sheltering income. Rental losses are passive: they offset passive income freely, and up to $25,000/yr can offset ordinary (W-2) income if you actively participate and your MAGI is under $100k (phasing out to $0 by $150k); unused losses carry forward. On sale, claimed depreciation is recaptured at up to 25%, and gains may owe capital-gains tax (a 1031 exchange can defer both). Figures are a year-1 estimate at your 24.0% rate — not tax advice; consult a CPA.
Schools (NCES district)
- District
- Pike County
- NCES district ID
- 2104800
- Math proficiency
- 24% ▼ -24.00%
- Reading proficiency
- 40% ▼ -20.00%
- Median HH income
- $32,601
- Composite
- 26.14/100
- National rank
- #7276
- State rank
- #98 of 165 in KY
Livability — South Williamson
- Score
- 68/100
- State rank
- #193
- US rank
- #9670
Category grades
Schools grade is shown separately in the Schools card above.
Census & demographics
- City population
- 301
- Population (ZIP)
- 2,590
Population outlook (Pike County) Hauer SSP2
- Today (2025)
- 55,108 people
- By 2030
- 51,235 · -7.0%
- By 2040
- 43,573 · -20.9%
- By 2050
- 36,797 · -33.2%
- By 2075
- 24,330 · -55.9%
- By 2100
- 15,611 · -71.7%
Race, ethnicity, and origin ACS 2023
- Neighborhood character
- Predominantly White (92%)
- Race & ethnicity
- White 92% Two or more races 8% Hispanic / Latino 2%
- Common ancestry
- Serbian 3% Slovak 2%
- Foreign-born
- 1% · Canada
- Languages at home
- 98% English-only · Spanish 2%
Political lean MEDSL · Pike
- 2024 margin
- Solid R (+65.4) · D 16.8% · R 82.2%
- 2008→2024 swing
- -51.6pp toward R · 2008: -13.8pp · 2024: -65.4pp
- All cycles
- 2024: R+65.4 2020: R+60.7 2016: R+62.8 2012: R+50.5 2008: R+13.8
Not yet ingested
- Civics
- —
Market trends
- HPI YoY
- ▲ 1.06%
- Current HPI
- 111.7949
- Rent YoY
- —
- Metro
- —
- State GDP YoY
- ▲ 1.81%
- F500 in state
- 4
Industry mix (Fortune 500 HQ in KY)
| Industry | F500 HQs | Revenue |
|---|---|---|
| Healthcare | 1 | $118B |
|
||
| Food / Beverage | 1 | $7B |
|
||
Price history
+106.7% since first listed4 events — show timeline
- 2026-05-25 Relisted — EKAR
- 2026-05-25 Price Changed $155,000 EKAR
- 2026-04-14 Listed $170,000 EKAR
- 2005-06-01 Sold (Public Records) $75,000 Public Records
Property tax history
+1.6%/yrLatest (2025): $945 · -0.7% YoY. Source: county tax records.
Cash-flow waterfall
monthlySold comps — $/sqft
last 12 mo · ≤1 miLoading sold comps…