4440 Katfur Ct · Huntertown, IN
Flood risk No data
- FEMA flood zone
- —
- Chance of flooding over 30 yrs
- —
- Est. flood insurance / yr
- —
Fire risk No data
- Est. fire insurance / yr
- —
Heat risk No data
- Hot days now (above threshold)
- —
- Hot days in 30 yrs
- —
Wind risk No data
- Chance of severe wind over 30 yrs
- —
Air-quality risk No data
- Unhealthy air days now
- —
- Unhealthy air days in 30 yrs
- —
Risk factors via First Street. Map © Google.
Why this score? — see what drove the D grade
The composite is a weighted blend of 9 inputs, each scored 0–100. Each bar is that input's sub-score; the figure is the points it added to the 100-point composite (weight × sub-score).
- ARV discount +11.9/15.0
- Cash flow +9.4/30.0
- Schools +4.9/10.0
- Rent growth +4.4/5.0
- Livability +3.5/5.0
- 1% rule +3.0/10.0
- DSCR +2.6/10.0
- Condition / age +2.5/5.0
- Appreciation +0.0/10.0
$349,220
🖨 Deal sheet 📄 Offer letter ✓ Due diligence
Listing remarks
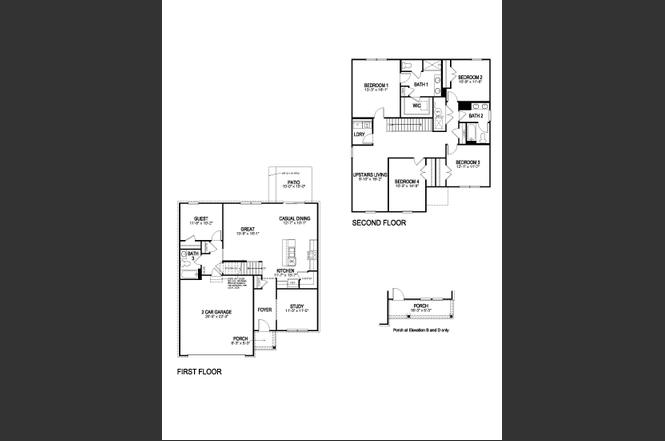
Say hello to 4440 Katfur Court in Northwest Fort Wayne-a new home in Farmstead at Carroll Creek, designed for space and style. This 2,600 square foot plan includes 5 bedrooms, 3 bathrooms, a study, and a versatile upstairs living space. The first floor offers a guest suite with a nearby full bath and a quiet study just off the entry. The open-concept layout connects the kitchen, great room, and dining area so you can live, cook, and entertain with ease. The kitchen features sarsaparilla shaker style cabinetry, miami vena quartz countertops, calacatta sky ceramic tile backsplash, Whirlpool stainless steel appliances including a gas range, and a generous island with built-in sink and seating.
Key facts
- Quiet study
- Guest suite
- Open-concept layout
Tags
Property features AI
Finance
- Financial info: List price $349,220
Exterior
- Parking: 2-car garage (2 parking spaces total)
- Home design: Single-family property; Active listing
- Exterior features: Living area approximately 2,600
Interior
- Bedrooms: 5 bedrooms
- Bathrooms: 3 full bathrooms
- Interior features: Spec home (Henley plan)
Neighborhood map
What this means for you Summary
Snapshot
- This is a 5-bed/3.0-bath single-family listed at $349k.
Deal economics
- At list price, monthly cash flow is $-249 ($-3k/yr) — negative.
- To cash-flow at today's rent, offer at most $313k (10.3% below list).
- To meet the 1% rule (rent ≥ 1% of price), the offer needs to be $278k (20.3% below list).
- Recommended offer: $278k (20.3% below list) — sets the bar for 1% rule.
- Cap rate 5.4% vs local median 4.1% in Huntertown — top-decile yield for the area; either an underpriced asset or a hidden risk that comps aren't pricing in. Stress-test before assuming the spread holds.
Location & tenants
- Location reads 70/100 on livability (#159 in IN) — a middle-class / working-renter tenant base. Strengths: employment A+, cost of living A+, housing A+; Watch: amenities F, commute F, health & safety F.
- Northwest Allen County Schools (rural): math 51% / reading 58% proficiency, ranked #25 of 301 in IN (top 8%) — acceptable for families but not a draw, mixed tenant base, ~2y average lease; only 11% free/reduced lunch — higher-income household profile.
- Market conditions: Rents rising fast (+7.6%/yr); 327 active listings in the ZIP; 2 comparable units currently listed for rent nearby; solid renter incomes; 1,861 units permitted in Allen County in 2024 (576 in 5+ unit buildings).
- This rent runs 41% of the median local income ($81k/yr) — at the standard rent-burdened threshold; future hikes will face affordability resistance.
Forward outlook
- Local home prices are declining (-3.0%/yr); year-one equity from $2k of loan paydown is wiped out by about $10k of value loss. Plan a longer hold.
- Allen County population projected at +10% by 2050 — modest demand growth; plan on rents tracking national, not racing it.
Negotiation context
- Only 2 days on market — expect competitive offers; lowballing is unlikely to land.
Questions for the listing agent
- What do current leases actually rent for vs. the listed asking? Can we see a recent rent roll and the last 12 months of T-12 income?
- What does the HOA fee cover, when was the last increase, and are there any pending special assessments or reserve-fund shortfalls?
- Is there a deadline driving the sale (1031 exchange, divorce, estate, relocation)? That informs how much negotiation room exists.
- The area grade is low — what's the realistic commute time and amenity access for the typical tenant pool here? Any planned neighborhood developments (good or bad) we should know about?
- What's the average days-on-market for RENTAL listings here right now (not sales)? A rising rental-DOM trend means longer vacancies and softer asking-rent achievability than the comps imply.
- What's the recent tenant-quality profile in this submarket — average credit score on applications, eviction rate, late-payment / NSF rate, and stable-employment percentage? A property-management company in the area should have these aggregated.
- How much new for-sale + rental construction is in the pipeline within 1–3 miles? Heavy new supply typically softens prices + rents 12–24 months out; constrained supply supports both.
Investment metrics
- 1% rule
- 0.80% ✗
- Cap rate
- 5.44%
- Cash-on-cash
- -3.06%
- DSCR
- 0.86
- GRM
- 10.5
CMA / ARV
- ARV (on-the-fly)
- $387,400
- Comps found
- 12
Show comp detail 12 sales within ~0.75 mi
| Address | Dist | Beds/Ba | Sqft | Sold | Price | $/sf | Match |
|---|---|---|---|---|---|---|---|
| 12839 Watts Dr | 0.10mi | 5/3.0 | 2,600 (0%) | 2mo | $387,130 | $149 | 93 |
| 4922 Hammock Dr | 0.33mi | 4/2.5 (-1) | 2,626 (+1%) | 4mo | $340,000 | $129 | 73 |
| 12843 Watts Dr | 0.11mi | 4/2.5 (-1) | 2,346 (-10%) | 3mo | $350,650 | $149 | 69 |
| 4841 Whittlebury Dr | 0.19mi | 4/2.5 (-1) | 2,322 (-11%) | 2mo | $379,900 | $164 | 65 |
| 12967 Solo Ln | 0.72mi | 5/3.0 | 2,600 (0%) | 3mo | $371,805 | $143 | 64 |
| 4313 Great Hollow Ct | 0.36mi | 4/2.5 (-1) | 2,438 (-6%) | 2mo | $475,000 | $195 | 64 |
| 3515 Astoria Way | 0.69mi | 4/2.5 (-1) | 2,607 (+0%) | 0mo | $335,000 | $129 | 60 |
| 5495 Tranquilo Way | 0.64mi | 5/3.0 | 2,415 (-7%) | 3mo | $324,900 | $135 | 56 |
| 5517 Tranquilo Way | 0.65mi | 4/2.5 (-1) | 2,346 (-10%) | 1mo | $329,085 | $140 | 45 |
| 4819 Windrow Way | 0.52mi | 4/2.5 (-1) | 2,244 (-14%) | 1mo | $379,900 | $169 | 45 |
| 5371 Elk Run Pl | 0.61mi | 4/2.5 (-1) | 2,299 (-12%) | 1mo | $412,000 | $179 | 44 |
| 12041 Swather Ct | 0.52mi | 4/2.5 (-1) | 2,229 (-14%) | 2mo | $375,000 | $168 | 44 |
Match score weights: distance 35% · size 25% · config 20% · recency 20%. Top-matched comps best support the ARV.
Projected returns pro-forma
-3.0% appreciation · 7.64% rent growth · sell at horizon
- IRR
- -16.3%
- Equity multiple
- 0.40×
- Total profit
- $-58,788
- Equity at exit
- $52,070
- IRR
- -1.2%
- Equity multiple
- 0.90×
- Total profit
- $-9,935
- Equity at exit
- $30,194
Cash invested: $97,782 (down + closing). Projections, not guarantees.
Landlord ↔ Tenant lean methodology
- Overall (STATE)
- 90 Strongly Landlord-Friendly
- State Indiana
- 90 Strongly Landlord-Friendly · R+11
- County
- — inherits STATE
- City
- — inherits STATE
ZIP-level market 46818
- Rents YoY
- 7.6%
- Active inventory
- 327
- Price-to-rent
- 10.5×
Monthly cashflow live
- Estimated rent
- $2,783 medium interval (Pro) →
- Mortgage (P&I)
- −$1,831
- Tax est. 1.5%
- −$437 /mo · $5,238/yr
- Insurance
- −$146
- HOA
- −$34
- Vacancy / Maint / Mgmt
- −$584
- Net cashflow
- $-249
Break-even live
UW: 25.0% down · 7.5% · 30yr · 1.5% tax · 5.0% vac · 8.0% maint · 8.0% mgmt
Financing live
Cash to close
- Down payment
- $87,305
- Closing costs
- $10,477
- Reserves months
- —
- Total cash needed
- —
Loan-product check · same deal, 3 products live
Conventional
25% down · 7.5% · 30yr
- Down + closing
- —
- Monthly P&I
- —
- Monthly cashflow
- —
- DSCR
- —
- Eligible?
- —
Personal DTI + credit; lowest rate.
DSCR
20% down · 8.5% · 30yr
- Down + closing
- —
- Monthly P&I
- —
- Monthly cashflow
- —
- DSCR
- —
- Eligible?
- —
No personal income docs; deal must DSCR.
Hard money
10% down · 12.0% · 12mo
- Down + closing
- —
- Monthly P&I
- —
- Monthly cashflow
- —
- DSCR
- —
- Eligible?
- —
Short-term bridge; refi at stabilization.
Rent comps 2 comps
| Address | Beds | Baths | Sqft | Rent | $/sqft | DOM | Units | Dist |
|---|---|---|---|---|---|---|---|---|
| 5045 Portney Pl Fort Wayne, IN | 4.0 | 2.5 | 2226 | $2,300 | $1.03 | 43d | 1 | 0.33mi |
| 3205 Water Wheel Run Fort Wayne, IN | 4.0 | 2.5 | 2382 | $2,500 | $1.05 | 43d | 1 | 1.29mi |
HOA detail
- Monthly dues
- $34 · $408/yr
- Likely covers
- gaspool
Listing history 6 events
-
2026-06-18days on market $349,220 Active 2 DOM
-
2026-06-16days on market $349,220 Active 1 DOM
-
2026-06-15days on market $349,220 Active 5 DOM
-
2026-06-14days on market $349,220 Active 3 DOM
-
2026-06-13remarks 699-char remark
-
2026-06-13$349,220 Active 2 DOM
ⓘ Source: listings_history table (triggers on properties + properties_extension) + one-shot
backfill from property_details.listing_events for pre-trigger history.
Nearby sold comps map
Loading sold comps map…
Walkable amenities ~0.75 mi
Loading nearby amenities…
Taxation est. · year 1
- Rental income
- $33,393
- − Mortgage interest
- −$19,562
- − Property taxes
- −$5,238
- − Insurance
- −$1,746
- − Repairs & maintenance
- −$2,671
- − Management
- −$2,671
- − HOA
- −$408
- − Depreciation
- −$10,159
- Taxable loss
- −$9,064
- Est. tax savings @ 24.0%
- +$2,175
- After-tax cash flow
- $-813/yr
For passive investors: Depreciation is non-cash, so a rental often shows a tax loss while cash-flowing — sheltering income. Rental losses are passive: they offset passive income freely, and up to $25,000/yr can offset ordinary (W-2) income if you actively participate and your MAGI is under $100k (phasing out to $0 by $150k); unused losses carry forward. On sale, claimed depreciation is recaptured at up to 25%, and gains may owe capital-gains tax (a 1031 exchange can defer both). Figures are a year-1 estimate at your 24.0% rate — not tax advice; consult a CPA.
Schools (NCES district)
- District
- Northwest Allen County Schools
- NCES district ID
- 1808250
- Math proficiency
- 51% ▼ -6.00%
- Reading proficiency
- 58% ▼ -5.00%
- Median HH income
- $78,952
- Composite
- 49.26/100
- National rank
- #2027
- State rank
- #25 of 301 in IN
Livability — Huntertown
- Score
- 70/100
- State rank
- #159
- US rank
- #7771
Category grades
Schools grade is shown separately in the Schools card above.
Census & demographics
- County
- Allen County · 326,813 people
- Metro
- Fort Wayne, IN
- Population (ZIP)
- 21,954
- Household income
- $81,066
- Rent vs Own
- Severe rent burden
- 101.0
Population outlook (Allen County) Hauer SSP2
- Today (2025)
- 394,020 people
- By 2030
- 405,128 · +2.8%
- By 2040
- 423,476 · +7.5%
- By 2050
- 435,137 · +10.4%
- By 2075
- 450,293 · +14.3%
- By 2100
- 424,101 · +7.6%
Race, ethnicity, and origin ACS 2023
- Neighborhood character
- Predominantly White (79%)
- Race & ethnicity
- White 79% Two or more races 8% Hispanic / Latino 7% Black 4% Asian 3%
- Hispanic origin (detail)
- Mexican 6%
- Common ancestry
- Italian 4% Slovak 3% Romanian 2%
- Foreign-born
- 8% · Canada, Vietnam, Philippines
- Languages at home
- 90% English-only · Spanish 4% Other Asian/Pacific 1% Vietnamese 1%
Political lean MEDSL · Allen
- 2024 margin
- R (+12.5) · D 42.9% · R 55.4% · Other 1.7%
- 2008→2024 swing
- -8.1pp toward R · 2008: -4.3pp · 2024: -12.5pp
- All cycles
- 2024: R+12.5 2020: R+11.2 2016: R+19.6 2012: R+16.8 2008: R+4.3
Not yet ingested
- Civics
- —
Market trends
- HPI YoY
- ▼ -217.71%
- Current HPI
- 228.1539
- Rent YoY
- ▲ 7.64%
- Metro
- Fort Wayne, IN
- State GDP YoY
- ▲ 2.90%
- F500 in state
- 18
Industry mix (Fortune 500 HQ in IN)
| Industry | F500 HQs | Revenue |
|---|---|---|
| Industrial Machinery | 2 | $37B |
|
||
| Healthcare | 1 | $177B |
|
||
| Pharmaceuticals | 1 | $45B |
|
||
| Metals / Steel | 1 | $18B |
|
||
| Agriculture | 1 | $17B |
|
||
| Packaging | 1 | $12B |
|
||
Cash-flow waterfall
monthlySold comps — $/sqft
last 12 mo · ≤1 miLoading sold comps…