 Fourplex
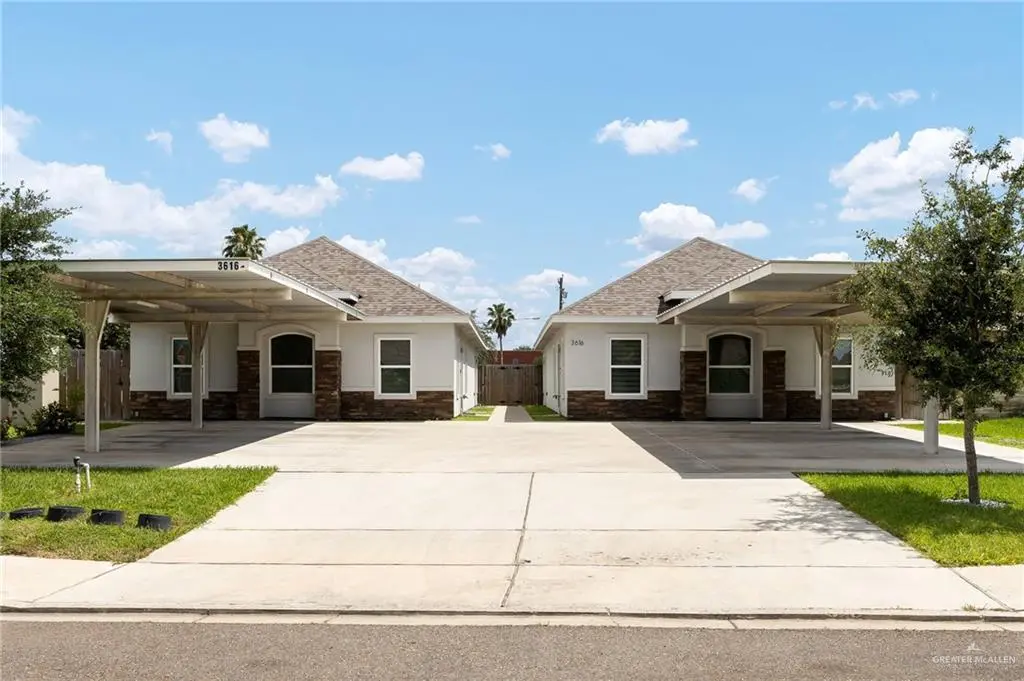
3616 Hawthorne Ave · Edinburg, TX
Flood risk 9/10 · Severe
- FEMA flood zone
- X (shaded)
- Chance of flooding over 30 yrs
- 0.99%
- Est. flood insurance / yr
- $507 – $1,088
Fire risk 5/10 · Moderate
- Est. fire insurance / yr
- $1,222 – $2,270
Heat risk 9/10 · Severe
- Hot days now (above 111°F)
- 7 days/yr
- Hot days in 30 yrs
- 23 days/yr
Wind risk 8/10 · Major
- Chance of severe wind over 30 yrs
- 99.0%
Air-quality risk 2/10 · Minimal
- Unhealthy air days now
- 0 days/yr
- Unhealthy air days in 30 yrs
- 1 days/yr
Risk factors via First Street. Map © Google.
Why this score? — see what drove the D grade
The composite is a weighted blend of 9 inputs, each scored 0–100. Each bar is that input's sub-score; the figure is the points it added to the 100-point composite (weight × sub-score).
- Cash flow +13.3/30.0
- ARV discount +9.4/15.0
- DSCR +4.0/10.0
- Condition / age +4.0/5.0
- 1% rule +3.9/10.0
- Livability +3.2/5.0
- Rent growth +2.4/5.0
- Schools +2.2/10.0
- Appreciation +0.0/10.0
$460,000
🖨 Deal sheet (PDF) 📄 Offer letter ✓ Due diligence
Multi-family units
County records classify this as Multi-Family (2-4 Unit). Listing-text estimate: 4 units. confirmed
Listing remarks MLS
Property consists of 4 units. Building 1 includes two 1 bed/1 bath units. Building 2 includes 2 bed/2 bath units. Total of 6 bedrooms and 6 bathrooms across all units. Three units are currently leased, with one vacant unit offering immediate income potential or owner-occupant flexibility. Well maintained fourplex with strong rental demand in the area. Located in Sprague Village in Edinburg, within Edinburg CISD. Conveniently located near shopping, dining, and major roadways. Ideal opportunity for investors seeking steady cash flow with upside potential.
Key facts
- Immediate cash flow
- Strong rental demand
- Near shopping
Tags
Neighborhood map
What this means for you Summary
Snapshot
- This is a 2×1bd/1ba + 2×2bd/2ba units multifamily listed at $460k. Condition is rated good.
Deal economics
- At list price, monthly cash flow is $-63 ($-759/yr) — negative. Per door: $-16/mo.
- To cash-flow at today's rent, offer at most $451k (2.0% below list).
- To meet the 1% rule (rent ≥ 1% of price), the offer needs to be $410k (10.8% below list).
- Recommended offer: $410k (10.8% below list) — sets the bar for 1% rule.
- Cap rate 6.3% vs local median 2.4% in Edinburg — top-decile yield for the area; either an underpriced asset or a hidden risk that comps aren't pricing in. Stress-test before assuming the spread holds.
Location & tenants
- Location reads 64/100 on livability (#784 in TX) — a middle-class / working-renter tenant base. Strengths: cost of living A+, housing A+; Watch: employment D, amenities F, commute F.
- Edinburg CISD (urban): math 20% / reading 34% proficiency, ranked #699 of 826 in TX (top 85%) — low school quality limits family demand, transient renter base, plan for 1-2y turnover; 62% free/reduced lunch — lower-income household profile, screen leases tightly.
- Zoned schools: Trevino El (math 36% / reading 49%, grade F, #1,313 of 4,322 statewide, top 31%, 655 students, 48% FRL); Elias Longoria Sr Middle (math 16% / reading 35%, grade F, #1,236 of 1,662 statewide, top 76%, 804 students, 82% FRL); Robert R Vela H S (math 27% / reading 48%, grade F, #888 of 1,632 statewide, top 55%, 2,189 students, 62% FRL) — zoned schools at 64% FRL track the district average.
- Market conditions: Rents soft (-0.5%/yr); 411 active listings in the ZIP; 14 comparable units currently listed for rent nearby; rentals lingering (median 46d on market — plan ~5-8 weeks vacancy on turnover, expect pricing pressure); 64% of comp listings sitting > 30 days — soft ceiling on asking rent; 7,378 units permitted in Hidalgo County in 2024 (641 in 5+ unit buildings).
- At $4,104/mo this rent would consume 74% of the median local household income ($67k/yr) (locally 1525% of renters already pay >50% of income on rent) — very limited rent-growth headroom before tenants either downsize or default.
Forward outlook
- Local home prices are declining (-3.0%/yr); year-one equity from $3k of loan paydown is wiped out by about $14k of value loss. Plan a longer hold.
- Hidalgo County population projected at +28% by 2050 — long-run rental-demand tailwind backs the buy-and-hold thesis.
Negotiation context
- It's been on market 94 days — a 9% lower offer ($419k) is reasonable based on typical stale-listing flexibility.
Risks & watch-outs
- Watch-outs: flood insurance adds $66/mo.
- Climate carrying-cost: severe flood risk; severe wind risk, 99% chance of damaging wind over 30y; moderate wildfire risk; extreme-heat days projected 7→23/yr by 2055 (HVAC capex compounding) — expect insurance premiums to compound above CPI over the hold.
Questions for the listing agent
- What do current leases actually rent for vs. the listed asking? Can we see a recent rent roll and the last 12 months of T-12 income?
- It's been on market 94 days. Have you received any prior offers? Is the seller open to a 11% concession, seller financing, or rate buy-down credit?
- Can we see the unit-by-unit rent roll, current vacancy, and any below-market leases? What's the average tenancy length?
- What capital expenditures (roof, boiler, parking lot, exteriors) have been made in the last 5 years, and what's planned in the next 2?
- What's the actual annual flood-insurance premium (NFIP or private), and is the property in a SFHA with mandatory coverage?
- What does the HOA fee cover, when was the last increase, and are there any pending special assessments or reserve-fund shortfalls?
- Why hasn't it sold? Are there any deal-killer items the seller is aware of (foundation, flood, title, zoning, code violations)?
- Is there a deadline driving the sale (1031 exchange, divorce, estate, relocation)? That informs how much negotiation room exists.
- Schools are D-rated, which usually means shorter tenancies and higher turnover. Who's the typical renter profile here, and what's been the actual vacancy rate?
- The area grade is low — what's the realistic commute time and amenity access for the typical tenant pool here? Any planned neighborhood developments (good or bad) we should know about?
- What's the average days-on-market for RENTAL listings here right now (not sales)? A rising rental-DOM trend means longer vacancies and softer asking-rent achievability than the comps imply.
- What's the recent tenant-quality profile in this submarket — average credit score on applications, eviction rate, late-payment / NSF rate, and stable-employment percentage? A property-management company in the area should have these aggregated.
- How much new apartment / multifamily construction is in the pipeline within 1–3 miles? Heavy new supply (>2% of stock underway) typically softens rents 12–24 months out; light construction supports rent growth.
Investment metrics
- 1% rule
- 0.89% ✗
- Cap rate
- 6.30%
- Cash-on-cash
- 0.03%
- DSCR
- 1.00
- GRM
- 9.3
CMA / ARV
- ARV (median comp)
- $480,025
- List price
- $460,000
- Delta
- -4.17%
- Verdict
- FAIR
- Comps
- 20 within 1.0 mi
Show comp detail 2 sales within ~0.75 mi
| Address | Dist | Beds/Ba | Sqft | Sold | Price | $/sf | Match |
|---|---|---|---|---|---|---|---|
| 402 Newport Ave | 0.31mi | —/— | 3,456 (+3%) | 3mo | $435,000 | $126 | 79 |
| 419 Teague Ave | 0.25mi | —/— | 3,840 (+14%) | 15mo | $475,000 | $124 | 52 |
Match score weights: distance 35% · size 25% · config 20% · recency 20%. Top-matched comps best support the ARV.
Projected returns pro-forma
-3.0% appreciation · 0.0% rent growth · sell at horizon
- IRR
- -20.8%
- Equity multiple
- 0.30×
- Total profit
- $-90,456
- Equity at exit
- $68,587
- IRR
- -23.4%
- Equity multiple
- -0.01×
- Total profit
- $-129,868
- Equity at exit
- $39,772
Cash invested: $128,800 (down + closing). Projections, not guarantees.
Landlord ↔ Tenant lean methodology
- Overall (STATE)
- 87 Strongly Landlord-Friendly
- State Texas
- 87 Strongly Landlord-Friendly · R+5
- County
- — inherits STATE
- City
- — inherits STATE
ZIP-level market 78539
- Home prices YoY
- -19.6%
- Rents YoY
- -0.5%
- Active inventory
- 411
- Price-to-rent
- 38.6×
Monthly cashflow live
- Estimated rent
- $4,104 high interval (Pro) →
- Mortgage (P&I)
- −$2,412
- Tax est. 1.5%
- −$575 /mo · $6,900/yr
- Insurance
- −$192
- Flood insurance flood zone
- −$66 /mo · $798/yr
- HOA
- −$60
- Vacancy / Maint / Mgmt
- −$862
- Net cashflow
- $-63
Break-even live
Sensitivity live
| Price | -10% $255 | -5% $96 | +0% $-63 | +5% $-222 | +10% $-381 |
|---|---|---|---|---|---|
| Rent | -10% $-387 | -5% $-225 | +0% $-63 | +5% $99 | +10% $261 |
| Rate | -1.0pp $168 | -0.5pp $54 | base $-63 | +0.5pp $-182 | +1.0pp $-304 |
4-unit breakdown (identical units grouped — click to expand)
| Units | Beds | Baths | Est. rent |
|---|---|---|---|
| 2× units | 1 | 1 | $1,984 |
| #1 | 1 | 1 | $992 |
| #2 | 1 | 1 | $992 |
| 2× units | 2 | 2 | $2,120 |
| #3 | 2 | 2 | $1,060 |
| #4 | 2 | 2 | $1,060 |
| Total (4 units) | $4,104 | ||
UW: 25.0% down · 7.5% · 30yr · 1.5% tax · 5.0% vac · 8.0% maint · 8.0% mgmt
Financing live
Cash to close
- Down payment
- $115,000
- Closing costs
- $13,800
- Reserves months
- —
- Total cash needed
- —
Loan-product check · same deal, 3 products live
Conventional
25% down · 7.5% · 30yr
- Down + closing
- —
- Monthly P&I
- —
- Monthly cashflow
- —
- DSCR
- —
- Eligible?
- —
Personal DTI + credit; lowest rate.
DSCR
20% down · 8.5% · 30yr
- Down + closing
- —
- Monthly P&I
- —
- Monthly cashflow
- —
- DSCR
- —
- Eligible?
- —
No personal income docs; deal must DSCR.
Hard money
10% down · 12.0% · 12mo
- Down + closing
- —
- Monthly P&I
- —
- Monthly cashflow
- —
- DSCR
- —
- Eligible?
- —
Short-term bridge; refi at stabilization.
Rent comps 14 comps
| Address | Beds | Baths | Sqft | Rent | $/sqft | DOM | Units | Dist |
|---|---|---|---|---|---|---|---|---|
| 702 S Logan Dr Unit 3 Edinburg, TX | 2.0 | 2.5 | 4488 | $950 | $0.21 | 46d | 1 | 0.28mi |
| 2714 S Ringold Cir Unit 4 Edinburg, TX | 2.0 | 2.0 | 3360 | $850 | $0.25 | 46d | 1 | 0.72mi |
| 408 N Emerald Ave Edinburg, TX | 3.0 | 2.0 | 4200 | $1,250 | $0.30 | 46d | 1 | 0.91mi |
| 506 N McColl Rd Edinburg, TX | 2.0 | 1.0 | 3700 | $650 | $0.18 | 46d | 1 | 1.07mi |
| 619 La Mancha Dr Unit 1 Edinburg, TX | 2.0 | 2.0 | 3944 | $850 | $0.22 | 16d | 1 | 1.19mi |
| 822 N Blair Ave Unit 1 Edinburg, TX | 2.0 | 2.0 | 4084 | $1,075 | $0.26 | 46d | 1 | 1.30mi |
| 3624 W Sarah Evans St Unit 2 Edinburg, TX | 3.0 | 3.0 | 4662 | $975 | $0.21 | 25d | 1 | 1.33mi |
| 3816 W Sarah Evans St Unit 1 Edinburg, TX | 3.0 | 2.0 | 4320 | $1,095 | $0.25 | 16d | 1 | 1.33mi |
| 604 Horizon Peak Unit 1 Edinburg, TX | 3.0 | 2.0 | 4704 | $950 | $0.20 | 46d | 1 | 1.33mi |
| 618 Gastel Cir Unit A,B Edinburg, TX | 2.0 | 2.0 | 4448 | $700 | $0.16 | 46d | 1 | 1.34mi |
| 901 N Woodson Ave Unit 3 Edinburg, TX | 3.0 | 2.0 | 4200 | $1,095 | $0.26 | 46d | 1 | 1.34mi |
| 1000 N Blair Ave Unit 4 Edinburg, TX | 2.0 | 2.0 | 4020 | $1,075 | $0.27 | 46d | 1 | 1.34mi |
| 1313 N Sal St Unit 4 Edinburg, TX | 2.0 | 2.0 | 3780 | $825 | $0.22 | 16d | 1 | 1.36mi |
| 1000 N Woodson Ave Unit 2 Edinburg, TX | 2.0 | 2.0 | 4200 | $995 | $0.24 | 16d | 1 | 1.38mi |
HOA detail
- Monthly dues
- $60 · $720/yr
Listing history 18 events
-
2026-06-21days on market $460,000 Active 94 DOM
-
2026-06-18days on market $460,000 Active 91 DOM
-
2026-06-17days on market $460,000 Active 90 DOM
-
2026-06-16days on market $460,000 Active 89 DOM
-
2026-06-15days on market $460,000 Active 88 DOM
-
2026-06-14days on market $460,000 Active 86 DOM
-
2026-06-13days on market $460,000 Active 85 DOM
-
2026-06-10days on market $460,000 Active 83 DOM
-
2026-06-09days on market $460,000 Active 82 DOM
-
2026-06-08days on market $460,000 Active 81 DOM
-
2026-06-07days on market $460,000 Active 80 DOM
-
2026-06-03days on market $460,000 Active 76 DOM
-
2026-06-02days on market $460,000 Active 75 DOM
-
2026-06-01days on market $460,000 Active 74 DOM
-
2026-05-31remarks 565-char remark
-
2026-05-31days on market $460,000 Active 73 DOM
-
2026-05-31pricedays on market $460,000 Active 72 DOM
-
2026-03-19$480,000 Active 564-char remark
Show marketing remark (564 chars)
Property consists of 4 units. Building 1 includes two 1 bed/1 bath units. Building 2 includes 2 bed/2 bath units. Total of 6 bedrooms and 6 bathrooms across all units. Three units are currently leased, with one vacant unit offering immediate income potential or owner-occupant flexibility. Well maintained fourplex with strong rental demand in the area. Located in Sprague Village in Edinburg, within Edinburg CISD. Conveniently located near shopping, dining, and major roadways. Ideal opportunity for investors seeking steady cash flow with upside potential.
ⓘ Source: listings_history table (triggers on properties + properties_extension) + one-shot
backfill from property_details.listing_events for pre-trigger history.
Climate risk First Street
- Flood 9/10 Extreme FEMA zone X (shaded) · 99% chance over 30 yrs
- Wildfire 5/10 Major
- Heat 9/10 Extreme 7 d/yr ≥111°F today · 23 d/yr by 30 yrs out
- Wind 8/10 Severe 99% chance of damaging wind over 30 yrs
- Air quality 2/10 Low 0 unhealthy d/yr today · 1 by 30 yrs out
Nearby sold comps map
Loading sold comps map…
Walkable amenities ~0.75 mi
Loading nearby amenities…
Taxation est. · year 1
- Rental income
- $49,248
- − Mortgage interest
- −$25,767
- − Property taxes
- −$6,900
- − Insurance
- −$3,098
- − Repairs & maintenance
- −$3,940
- − Management
- −$3,940
- − HOA
- −$720
- − Depreciation
- −$13,382
- Taxable loss
- −$8,498
- Est. tax savings @ 24.0%
- +$2,040
- After-tax cash flow
- $1,280/yr
For passive investors: Depreciation is non-cash, so a rental often shows a tax loss while cash-flowing — sheltering income. Rental losses are passive: they offset passive income freely, and up to $25,000/yr can offset ordinary (W-2) income if you actively participate and your MAGI is under $100k (phasing out to $0 by $150k); unused losses carry forward. On sale, claimed depreciation is recaptured at up to 25%, and gains may owe capital-gains tax (a 1031 exchange can defer both). Figures are a year-1 estimate at your 24.0% rate — not tax advice; consult a CPA.
Condition & rehab AI · 13 photos
This fourplex is in good condition with modern amenities and a well-maintained exterior. It offers a great opportunity for investors seeking steady cash flow with potential for value appreciation.
Value-add opportunities
- Both Painting the exterior and interior walls — Fresh paint can enhance curb appeal and interior aesthetics.
- Both Landscaping improvements — Enhanced landscaping can improve curb appeal and attract more tenants.
- Both Upgrading the kitchen appliances — Modern appliances can increase the home's appeal and value.
- Both Adding smart home features — Smart home features can increase convenience and attract more tenants.
- Both Upgrading the HVAC system — A more efficient HVAC system can improve comfort and reduce energy costs.
Renovation cost estimate screening
Value-add ROI direction
- Both Painting the exterior and interior walls — Fresh paint can enhance curb appeal and interior aesthetics. ↑
- Both Landscaping improvements — Enhanced landscaping can improve curb appeal and attract more tenants. ↑
- Both Upgrading the kitchen appliances — Modern appliances can increase the home's appeal and value. ↑
- Both Adding smart home features — Smart home features can increase convenience and attract more tenants. ↑
- Both Upgrading the HVAC system — A more efficient HVAC system can improve comfort and reduce energy costs. ↑
ⓘ Cost ranges are severity-bucket heuristics (US national rule-of-thumb). Get contractor quotes + a written scope before underwriting a rehab budget.
Schools (NCES district)
- District
- Edinburg CISD
- NCES district ID
- 4818180
- Math proficiency
- 20% ▼ -34.00%
- Reading proficiency
- 34% ▼ -11.00%
- Median HH income
- $36,985
- Composite
- 22.42/100
- National rank
- #8114
- State rank
- #699 of 826 in TX
Livability — Edinburg
- Score
- 64/100
- State rank
- #784
- US rank
- #14319
Category grades
Schools grade is shown separately in the Schools card above.
Census & demographics
- Census place
- Edinburg, TX
- County
- Hidalgo County · 623,128 people
- City population
- 178,279
- Metro
- McAllen-Edinburg-Mission, TX
- Population (ZIP)
- 37,168
- Household income
- $66,967
- Rent vs Own
- Severe rent burden
- 1525.0
Population outlook (Hidalgo County) Hauer SSP2
- Today (2025)
- 955,232 people
- By 2030
- 1,009,774 · +5.7%
- By 2040
- 1,120,332 · +17.3%
- By 2050
- 1,225,036 · +28.2%
- By 2075
- 1,439,189 · +50.7%
- By 2100
- 1,533,429 · +60.5%
Race, ethnicity, and origin ACS 2023
- Neighborhood character
- Predominantly Hispanic (85%)
- Race & ethnicity
- Hispanic / Latino 85% Two or more races 45% White 10% Asian 4%
- Hispanic origin (detail)
- Mexican 77% Puerto Rican 1%
- Common ancestry
- Lithuanian 1% Italian 1% Romanian 1%
- Foreign-born
- 19% · Canada
- Languages at home
- 32% English-only · Spanish 64% Tagalog/Filipino 2% Other Asian/Pacific 1%
Political lean MEDSL · Hidalgo
- 2024 margin
- Toss-up / Even · D 48.1% · R 51.0%
- 2008→2024 swing
- -41.6pp toward R · 2008: 38.7pp · 2024: -2.9pp
- All cycles
- 2024: R+2.9 2020: D+17.1 2016: D+40.5 2012: D+41.8 2008: D+38.7
Not yet ingested
- Civics
- —
Market trends
- HPI YoY
- ▼ -51.52%
- Current HPI
- 211.4723
- Rent YoY
- ▼ -0.52%
- Metro
- McAllen-Edinburg-Mission, TX
- State GDP YoY
- ▲ 3.95%
- F500 in state
- 110
Industry mix (Fortune 500 HQ in TX)
| Industry | F500 HQs | Revenue |
|---|---|---|
| Energy | 16 | $1,198B |
|
||
| Technology | 5 | $198B |
|
||
| Engineering / Construction | 4 | $72B |
|
||
| Energy Services | 3 | $60B |
|
||
| Utilities | 3 | $41B |
|
||
| Healthcare | 2 | $330B |
|
||
Price history
1 event — show timeline
- 2026-03-19 Listed $480,000 MCALLENMLS
Cash-flow waterfall
monthlySold comps — $/sqft
last 12 mo · ≤1 miLoading sold comps…