29927 Guilford Cir · Chesterfield, MI
Flood risk No data
- FEMA flood zone
- —
- Chance of flooding over 30 yrs
- —
- Est. flood insurance / yr
- —
Fire risk No data
- Est. fire insurance / yr
- —
Heat risk No data
- Hot days now (above threshold)
- —
- Hot days in 30 yrs
- —
Wind risk No data
- Chance of severe wind over 30 yrs
- —
Air-quality risk No data
- Unhealthy air days now
- —
- Unhealthy air days in 30 yrs
- —
Risk factors via First Street. Map © Google.
Why this score? — see what drove the D grade
The composite is a weighted blend of 9 inputs, each scored 0–100. Each bar is that input's sub-score; the figure is the points it added to the 100-point composite (weight × sub-score).
- Cash flow +15.0/30.0
- ARV discount +7.5/15.0
- 1% rule +5.0/10.0
- DSCR +5.0/10.0
- Schools +3.6/10.0
- Rent growth +2.5/5.0
- Livability +2.5/5.0
- Condition / age +2.5/5.0
- Appreciation +0.0/10.0
$30,000
🖨 Deal sheet 📄 Offer letter ✓ Due diligence
Listing remarks MLS
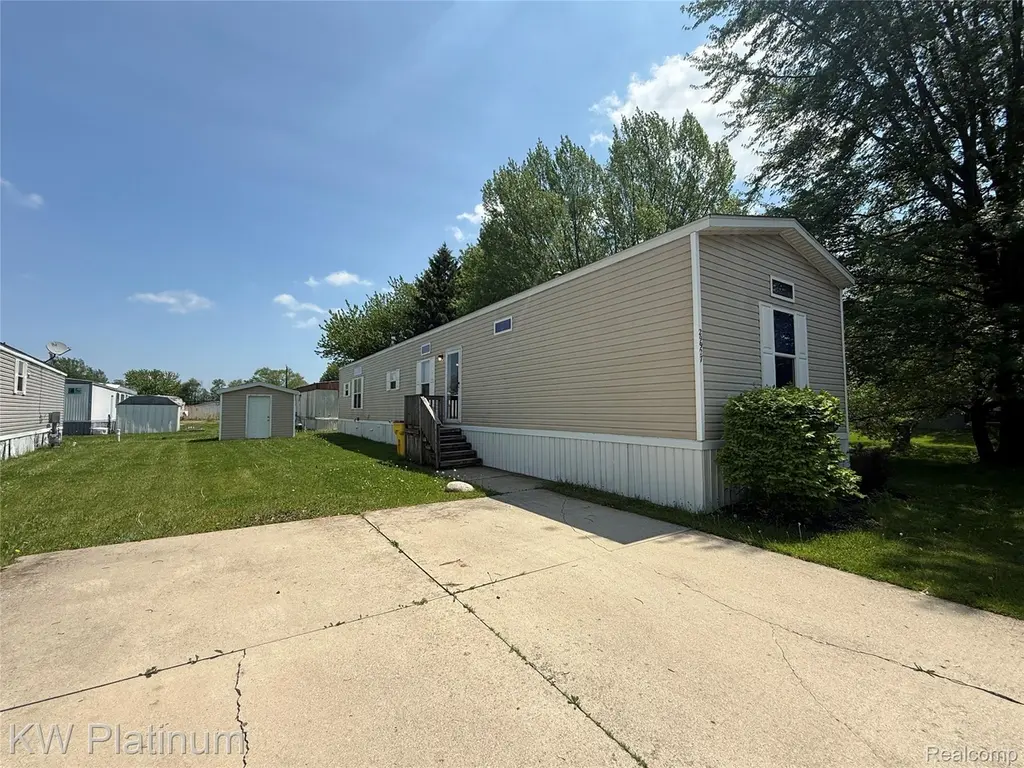
Welcome home to this beautifully maintained manufactured home located in the desirable Carriage Way community in Chesterfield! Built in 2013, this spacious home offers over 1,100 square feet of comfortable living space with impressive 9-foot ceilings throughout. Featuring 3 bedrooms and 2 full bathrooms, this home has a bright and open layout perfect for everyday living. Enjoy newer carpet, a generous 10x10 shed for extra storage, and a great location close to dining, shopping, parks, and major freeways for an easy commute. A wonderful opportunity to enjoy affordable living in a convenient location!
Key facts
- Manufactured home
- Convenient location
- 10x10 shed
Tags
Property features AI
Finance
- Other: Pets allowed — contact association for details; Directions: South of 24 Mile Road, east of Gratiot Ave. (Cross: 24 Mile // Gratiot)
- HOA & community: Homeowners association with monthly fee of $897; Association fee covers grounds maintenance
Exterior
- Parking: No garage
- Utilities: Public water; Public sewer
- Home design: Single family residence; One-level home; Ground-level entry with steps; Vinyl siding
- Construction: Vinyl siding construction
- Exterior features: Outdoor in-ground community pool; Clubhouse; Shed(s); Paved road; Irregular-shaped lot
Interior
- Kitchen: Dishwasher; Free-standing electric oven; Free-standing electric range; Free-standing refrigerator
- Bathrooms: 2 full bathrooms
- Heating & cooling: Central air conditioning; Forced air heating; Natural gas heating
- Interior features: Gas water heater; Crawl space basement; Laundry room; 6 total rooms
- Laundry & utility: Washer; Dryer; Laundry room
Neighborhood map
What this means for you Summary
Snapshot
- This is a 3-bed/2.0-bath manufactured listed at $30k.
Deal economics
- At list price, monthly cash flow is $128 ($2k/yr) — positive.
- The deal already cash-flows at list — no discount required.
- Meets the 1% rule at list price ($2k rent vs $30k).
- Recommended offer: $30k (1.5% below list) — sets the bar for market timing.
Location & tenants
- Location reads: area grade D — affects rentability + tenant quality, not the cash-flow math above.
- L'Anse Creuse Public Schools (suburban): math 31% / reading 51% proficiency, ranked #184 of 540 in MI (top 34%) — families likely to look elsewhere, expect single-tenant / working-renter base with shorter leases.
- Market conditions: 140 active listings in the ZIP; 20 comparable units currently listed for rent nearby; rentals leasing fast (median 5d on market — plan ~1-2 weeks tenant-placement turnaround); 1,321 units permitted in Macomb County in 2024 (86 in 5+ unit buildings).
Forward outlook
- Local home prices are declining (-3.0%/yr); year-one equity from $207 of loan paydown is wiped out by about $900 of value loss. Plan a longer hold.
- Macomb County population projected at +9% by 2050 — modest demand growth; plan on rents tracking national, not racing it.
- At projected returns (-3.0% appreciation + 3.0% rent growth), your $8k cash investment doubles in ~7 years — after that, you're playing with house money.
Negotiation context
- It's been on market 29 days — a 2% lower offer ($30k) is reasonable based on typical stale-listing flexibility.
- 18 sale attempts since 13y ago with the ask held roughly flat each time — persistent listings suggest the price (not the market) is what's stuck; bring a comps-based counter.
Risks & watch-outs
- Watch-outs: HOA is 57% of rent.
Questions for the listing agent
- What does the HOA fee cover, when was the last increase, and are there any pending special assessments or reserve-fund shortfalls?
- Is there a deadline driving the sale (1031 exchange, divorce, estate, relocation)? That informs how much negotiation room exists.
- The area grade is low — what's the realistic commute time and amenity access for the typical tenant pool here? Any planned neighborhood developments (good or bad) we should know about?
- What's the average days-on-market for RENTAL listings here right now (not sales)? A rising rental-DOM trend means longer vacancies and softer asking-rent achievability than the comps imply.
- What's the recent tenant-quality profile in this submarket — average credit score on applications, eviction rate, late-payment / NSF rate, and stable-employment percentage? A property-management company in the area should have these aggregated.
- How much new for-sale + rental construction is in the pipeline within 1–3 miles? Heavy new supply typically softens prices + rents 12–24 months out; constrained supply supports both.
Investment metrics
- 1% rule
- 5.20% ✓
- Cap rate
- 11.43%
- Cash-on-cash
- 18.35%
- DSCR
- 1.82
- GRM
- 1.6
CMA / ARV
No comps found within radius.
Projected returns pro-forma
-3.0% appreciation · 3.0% rent growth · sell at horizon
- IRR
- 11.5%
- Equity multiple
- 1.46×
- Total profit
- $3,893
- Equity at exit
- $4,473
- IRR
- 21.5%
- Equity multiple
- 2.94×
- Total profit
- $16,258
- Equity at exit
- $2,594
Cash invested: $8,400 (down + closing). Projections, not guarantees.
Landlord ↔ Tenant lean methodology
- Overall (STATE)
- 62 Landlord-Friendly
- State Michigan
- 62 Landlord-Friendly · EVEN
- County
- — inherits STATE
- City
- — inherits STATE
ZIP-level market 48051
- Home prices YoY
- -31.8%
- Active inventory
- 140
- Price-to-rent
- 1.6×
Monthly cashflow live
- Estimated rent
- $1,560 high interval (Pro) →
- Mortgage (P&I)
- −$157
- Tax est. 1.5%
- −$38 /mo · $450/yr
- Insurance
- −$12
- HOA
- −$897
- Vacancy / Maint / Mgmt
- −$328
- Net cashflow
- $128
Break-even live
UW: 25.0% down · 7.5% · 30yr · 1.5% tax · 5.0% vac · 8.0% maint · 8.0% mgmt
Financing live
Cash to close
- Down payment
- $7,500
- Closing costs
- $900
- Reserves months
- —
- Total cash needed
- —
Loan-product check · same deal, 3 products live
Conventional
25% down · 7.5% · 30yr
- Down + closing
- —
- Monthly P&I
- —
- Monthly cashflow
- —
- DSCR
- —
- Eligible?
- —
Personal DTI + credit; lowest rate.
DSCR
20% down · 8.5% · 30yr
- Down + closing
- —
- Monthly P&I
- —
- Monthly cashflow
- —
- DSCR
- —
- Eligible?
- —
No personal income docs; deal must DSCR.
Hard money
10% down · 12.0% · 12mo
- Down + closing
- —
- Monthly P&I
- —
- Monthly cashflow
- —
- DSCR
- —
- Eligible?
- —
Short-term bridge; refi at stabilization.
Rent comps 20 comps
| Address | Beds | Baths | Sqft | Rent | $/sqft | DOM | Units | Dist |
|---|---|---|---|---|---|---|---|---|
| 29909 Flushing Dr Unit 71 New Baltimore, MI | 3.0 | 2.0 | 1440 | $1,669 | $1.16 | 17d | 1 | 0.05mi |
| 29811 W Essex Ct Unit 114 New Baltimore, MI | 3.0 | 2.0 | 1456 | $1,729 | $1.19 | 44d | 1 | 0.11mi |
| 52436 Winston Ct Unit 209 Chesterfield, MI | 3.0 | 2.0 | 1056 | $1,479 | $1.40 | 44d | 1 | 0.12mi |
| 29778 W Essex Ct Unit 109 New Baltimore, MI | 3.0 | 2.0 | 1056 | $1,469 | $1.39 | 44d | 1 | 0.12mi |
| 29805 Jamestown Dr Unit 435 New Baltimore, MI | 3.0 | 2.0 | 1344 | $1,739 | $1.29 | 1d | 1 | 0.13mi |
| 29810 W Essex Ct Unit 107 New Baltimore, MI | 3.0 | 2.0 | 1056 | $1,439 | $1.36 | 5d | 1 | 0.13mi |
| 52780 S Zacharias Ct Unit 152 Chesterfield, MI | 3.0 | 2.0 | 1056 | $1,499 | $1.42 | 2d | 1 | 0.19mi |
| 52792 S Zacharias Ct Unit 151 Chesterfield, MI | 3.0 | 2.0 | 1056 | $1,479 | $1.40 | 2d | 1 | 0.20mi |
| 52758 S Yorktown Ct Unit 176 New Baltimore, MI | 2.0 | 2.0 | 960 | $1,449 | $1.51 | 2d | 1 | 0.21mi |
| 29649 Cambridge Ct Unit 256 New Baltimore, MI | 3.0 | 2.0 | 1152 | $1,579 | $1.37 | 2d | 1 | 0.23mi |
| 52871 N Zacharias Ct Unit 161 Chesterfield, MI | 3.0 | 2.0 | 1152 | $1,519 | $1.32 | 2d | 1 | 0.25mi |
| 52705 Van Buren Dr Unit 297 Chesterfield, MI | 3.0 | 2.0 | 1056 | $1,479 | $1.40 | 2d | 1 | 0.25mi |
| 52962 N Yorktown Ct Unit 168 Chesterfield, MI | 3.0 | 2.0 | 1056 | $1,519 | $1.44 | 2d | 1 | 0.28mi |
| 29890 Donna Ln New Baltimore, MI | 2.0 | 1.5 | 1120 | $1,500 | $1.34 | 1d | 1 | 0.54mi |
| 28346 Adler Park Dr S #246 Chesterfield, MI | 2.0 | 2.0 | 1332 | $1,750 | $1.31 | 44d | 1 | 0.78mi |
| 28218 S Pointe Ln New Baltimore, MI | 2.0 | 2.0 | 1427 | $1,850 | $1.30 | 5d | 1 | 0.85mi |
| 28218 S Pointe Ln New Baltimore, MI | 2.0 | 2.0 | 1425 | $2,100 | $1.47 | 24d | 1 | 0.85mi |
| 50450 Bay Run N #50 Chesterfield, MI | 2.0 | 1.5 | 1200 | $1,500 | $1.25 | 17d | 1 | 0.98mi |
| 28123 23 Mile Rd New Baltimore, MI | 1.0–2.0 | 1.0 | 800 | $1,059 | $1.32 | 2d | 5 | 1.10mi |
| 50031 S Benny Ct New Baltimore, MI | 2.0 | 1.0 | 1056 | $1,450 | $1.37 | 44d | 1 | 1.27mi |
HOA detail
- Monthly dues
- $897 · $10,764/yr
Listing history 48 events
-
2026-06-18days on market $30,000 Active 29 DOM
-
2026-06-17days on market $30,000 Active 28 DOM
-
2026-06-16days on market $30,000 Active 27 DOM
-
2026-06-15days on market $30,000 Active 26 DOM
-
2026-06-13days on market $30,000 Active 24 DOM
-
2026-06-13days on market $30,000 Active 23 DOM
-
2026-06-09days on market $30,000 Active 20 DOM
-
2026-06-08days on market $30,000 Active 19 DOM
-
2026-06-07days on market $30,000 Active 18 DOM
-
2026-06-04days on market $30,000 Active 15 DOM
-
2026-06-03days on market $30,000 Active 14 DOM
-
2026-06-02days on market $30,000 Active 13 DOM
-
2026-06-01days on market $30,000 Active 12 DOM
-
2026-05-31days on market $30,000 Active 11 DOM
-
2026-05-20$30,000 Active 606-char remark
Show marketing remark (606 chars)
Welcome home to this beautifully maintained manufactured home located in the desirable Carriage Way community in Chesterfield! Built in 2013, this spacious home offers over 1,100 square feet of comfortable living space with impressive 9-foot ceilings throughout. Featuring 3 bedrooms and 2 full bathrooms, this home has a bright and open layout perfect for everyday living. Enjoy newer carpet, a generous 10x10 shed for extra storage, and a great location close to dining, shopping, parks, and major freeways for an easy commute. A wonderful opportunity to enjoy affordable living in a convenient location!
-
2026-05-20$30,000 Active
Show marketing remark (606 chars)
Welcome home to this beautifully maintained manufactured home located in the desirable Carriage Way community in Chesterfield! Built in 2013, this spacious home offers over 1,100 square feet of comfortable living space with impressive 9-foot ceilings throughout. Featuring 3 bedrooms and 2 full bathrooms, this home has a bright and open layout perfect for everyday living. Enjoy newer carpet, a generous 10x10 shed for extra storage, and a great location close to dining, shopping, parks, and major freeways for an easy commute. A wonderful opportunity to enjoy affordable living in a convenient location!
-
2015-03-19historical
-
2015-03-19historical
-
2015-01-18$39,999 Active
-
2015-01-18$39,999
-
2014-12-01historical
-
2014-10-11historical
-
2014-10-10$39,999
-
2014-09-10$39,999
-
2014-08-25historical
-
2014-08-04$48,900
-
2014-07-29historical
-
2014-07-12$48,900
-
2014-07-10historical
-
2014-07-03$48,900
-
2014-07-01historical
-
2014-06-09$48,900
-
2014-06-01historical
-
2014-05-18$48,900
-
2014-05-01historical
-
2014-04-18$48,900
-
2014-04-18historical
-
2014-04-09$48,900
-
2014-02-20historical
-
2014-02-10$48,900
-
2014-01-29historical
-
2014-01-27$48,900
-
2014-01-27historical
-
2013-12-18$48,900
-
2013-12-01historical
-
2013-10-17$48,900
-
2013-10-17historical
-
2013-09-10$48,900
ⓘ Source: listings_history table (triggers on properties + properties_extension) + one-shot
backfill from property_details.listing_events for pre-trigger history.
Nearby sold comps map
Loading sold comps map…
Walkable amenities ~0.75 mi
Loading nearby amenities…
Taxation est. · year 1
- Rental income
- $18,725
- − Mortgage interest
- −$1,680
- − Property taxes
- −$450
- − Insurance
- −$150
- − Repairs & maintenance
- −$1,498
- − Management
- −$1,498
- − HOA
- −$10,764
- − Depreciation
- −$873
- Taxable income
- $1,812
- Est. tax owed @ 24.0%
- −$435
- After-tax cash flow
- $1,106/yr
For passive investors: Depreciation is non-cash, so a rental often shows a tax loss while cash-flowing — sheltering income. Rental losses are passive: they offset passive income freely, and up to $25,000/yr can offset ordinary (W-2) income if you actively participate and your MAGI is under $100k (phasing out to $0 by $150k); unused losses carry forward. On sale, claimed depreciation is recaptured at up to 25%, and gains may owe capital-gains tax (a 1031 exchange can defer both). Figures are a year-1 estimate at your 24.0% rate — not tax advice; consult a CPA.
Schools (NCES district)
- District
- L'Anse Creuse Public Schools
- NCES district ID
- 2621870
- Math proficiency
- 31% ▼ -8.00%
- Reading proficiency
- 51% ▼ -2.00%
- Median HH income
- $57,757
- Composite
- 35.99/100
- National rank
- #4790
- State rank
- #184 of 540 in MI
Livability — Chesterfield
No livability data for this city. (Only ~50 U.S. cities are tracked.)
Census & demographics
- City population
- 40,302
- Population (ZIP)
- 17,716
Population outlook (Macomb County) Hauer SSP2
- Today (2025)
- 925,296 people
- By 2030
- 948,226 · +2.5%
- By 2040
- 983,961 · +6.3%
- By 2050
- 1,010,200 · +9.2%
- By 2075
- 1,076,222 · +16.3%
- By 2100
- 1,077,065 · +16.4%
Race, ethnicity, and origin ACS 2023
- Neighborhood character
- Predominantly White (79%)
- Race & ethnicity
- White 79% Black 8% Two or more races 7% Hispanic / Latino 5%
- Common ancestry
- Romanian 18% Lithuanian 5% Slovak 1%
- Foreign-born
- 4% · Canada
- Languages at home
- 94% English-only · Spanish 4% Other Indo-European 1%
Political lean MEDSL · Macomb
- 2024 margin
- R (+13.7) · D 42.2% · R 55.9% · Other 1.9%
- 2008→2024 swing
- -22.3pp toward R · 2008: 8.6pp · 2024: -13.7pp
- All cycles
- 2024: R+13.7 2020: R+8.1 2016: R+11.6 2012: D+4.0 2008: D+8.6
Not yet ingested
- Civics
- —
Market trends
- HPI YoY
- ▼ -98.06%
- Current HPI
- 210.6017
- Rent YoY
- —
- Metro
- —
- State GDP YoY
- ▲ 1.37%
- F500 in state
- 28
Industry mix (Fortune 500 HQ in MI)
| Industry | F500 HQs | Revenue |
|---|---|---|
| Automotive Parts | 3 | $48B |
|
||
| Automotive | 2 | $372B |
|
||
| Chemicals | 1 | $45B |
|
||
| Automotive Retail | 1 | $29B |
|
||
| Healthcare / Medical Devices | 1 | $23B |
|
||
| Automotive Technology | 1 | $20B |
|
||
Price history
-38.7% since first listed34 events — show timeline
- 2026-05-20 Listed $30,000 REALCOMP
- 2026-05-20 Listed $30,000 MiRealSource-MiMLS
- 2015-03-19 Listing Removed — REALCOMP
- 2015-03-19 Listing Removed — MiRealSource-MiMLS
- 2015-01-18 Listed $39,999 MiRealSource-MiMLS
- 2015-01-18 Listed $39,999 REALCOMP
- 2014-12-01 Listing Removed — MiRealSource-MiMLS
- 2014-10-11 Listing Removed — MiRealSource-MiMLS
- 2014-10-10 Listed $39,999 MiRealSource-MiMLS
- 2014-09-10 Listed $39,999 MiRealSource-MiMLS
- 2014-08-25 Listing Removed — MiRealSource-MiMLS
- 2014-08-04 Listed $48,900 MiRealSource-MiMLS
- 2014-07-29 Listing Removed — MiRealSource-MiMLS
- 2014-07-12 Listed $48,900 MiRealSource-MiMLS
- 2014-07-10 Listing Removed — MiRealSource-MiMLS
- 2014-07-03 Listed $48,900 MiRealSource-MiMLS
- 2014-07-01 Listing Removed — MiRealSource-MiMLS
- 2014-06-09 Listed $48,900 MiRealSource-MiMLS
- 2014-06-01 Listing Removed — MiRealSource-MiMLS
- 2014-05-18 Listed $48,900 MiRealSource-MiMLS
- 2014-05-01 Listing Removed — MiRealSource-MiMLS
- 2014-04-18 Listing Removed — MiRealSource-MiMLS
- 2014-04-18 Listed $48,900 MiRealSource-MiMLS
- 2014-04-09 Listed $48,900 MiRealSource-MiMLS
- 2014-02-20 Listing Removed — MiRealSource-MiMLS
- 2014-02-10 Listed $48,900 MiRealSource-MiMLS
- 2014-01-29 Listing Removed — MiRealSource-MiMLS
- 2014-01-27 Listing Removed — MiRealSource-MiMLS
- 2014-01-27 Listed $48,900 MiRealSource-MiMLS
- 2013-12-18 Listed $48,900 MiRealSource-MiMLS
- 2013-12-01 Listing Removed — MiRealSource-MiMLS
- 2013-10-17 Listing Removed — MiRealSource-MiMLS
- 2013-10-17 Listed $48,900 MiRealSource-MiMLS
- 2013-09-10 Listed $48,900 MiRealSource-MiMLS
Cash-flow waterfall
monthlySold comps — $/sqft
last 12 mo · ≤1 miLoading sold comps…