 🏷️ Likely Rental
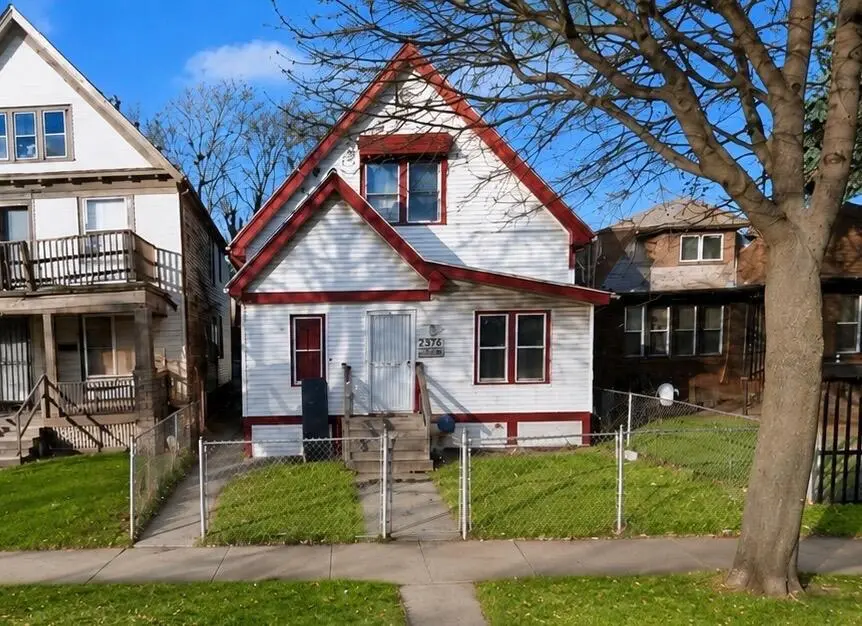
3265 N 30th St · Milwaukee, WI
Flood risk 1/10 · Minimal
- FEMA flood zone
- X (unshaded)
- Chance of flooding over 30 yrs
- 0.0%
- Est. flood insurance / yr
- $473 – $860
Fire risk 1/10 · Minimal
- Est. fire insurance / yr
- $636 – $1,182
Heat risk 2/10 · Minimal
- Hot days now (above 98°F)
- 7 days/yr
- Hot days in 30 yrs
- 13 days/yr
Wind risk 2/10 · Minimal
- Chance of severe wind over 30 yrs
- —
Air-quality risk 2/10 · Minimal
- Unhealthy air days now
- 2 days/yr
- Unhealthy air days in 30 yrs
- 2 days/yr
Risk factors via First Street. Map © Google.
Why this score? — see what drove the A- grade
The composite is a weighted blend of 9 inputs, each scored 0–100. Each bar is that input's sub-score; the figure is the points it added to the 100-point composite (weight × sub-score).
- Cash flow +30.0/30.0
- ARV discount +15.0/15.0
- DSCR +10.0/10.0
- 1% rule +8.0/10.0
- Appreciation +5.7/10.0
- Rent growth +4.3/5.0
- Livability +4.0/5.0
- Condition / age +2.5/5.0
- Schools +1.2/10.0
$99,000
🖨 Deal sheet (PDF) 📄 Offer letter ✓ Due diligence
Listing remarks MLS
A great opportunity has arrived, welcome investors! We have a 3 bedroom and 1 bath single family home awaiting its new owner. The property is tenant occupied. Rental fee is $950 mtm, with a security deposit of $950. Call or schedule a showing today!
Key facts
- 3,484 sq ft lot
- Garage
- Built 1909
Property features AI
Exterior
- Parking: Detached 1-car garage; One parking space
- Utilities: Municipal water; Municipal sewer; Natural gas
- Home design: Two-story single-family home; Assessor/public record used for year built
- Construction: Less than 1/2 acre lot (approximately 0.08 acre); Zoning: RT3
- Exterior features: Patio; Vinyl exterior
Interior
- Kitchen: Kitchen on main level (11 x 10)
- Bedrooms: Master bedroom on upper level (13 x 13); Second bedroom on upper level (11 x 9); Third bedroom on upper level (16 x 9)
- Bathrooms: One full bathroom with shower over tub
- Heating & cooling: Forced air heating (natural gas)
- Interior features: Full basement; Den/office on main level (19 x 13); Living room on main level (12 x 17); Dining room on main level (13 x 11); Additional main-level room (12 x 8)
Neighborhood map
What this means for you Summary
Snapshot
- This is a 3-bed/1.0-bath single-family listed at $99k.
Deal economics
- At list price, monthly cash flow is $369 ($4k/yr) — positive.
- The deal already cash-flows at list — no discount required.
- Meets the 1% rule at list price ($1k rent vs $99k).
- Cap rate 10.8% vs local median 5.1% in Milwaukee — top-decile yield for the area; either an underpriced asset or a hidden risk that comps aren't pricing in. Stress-test before assuming the spread holds.
Location & tenants
- Location reads 81/100 on livability (#55 in WI, #1,534 nationally) — a professional / high-income tenant draw. Strengths: amenities A+, commute A+, cost of living A+; Watch: employment D+, schools F, crime F.
- Milwaukee School District (urban): math 10% / reading 18% proficiency, ranked #337 of 342 in WI (top 98%) — low school quality limits family demand, transient renter base, plan for 1-2y turnover; 77% free/reduced lunch — lower-income household profile, screen leases tightly.
- Market conditions: Rents rising fast (+7.0%/yr); 126 active listings in the ZIP; 40 comparable units currently listed for rent nearby; rentals at typical pace (median 21d on market — plan ~3-4 weeks tenant-placement turnaround); 1,017 units permitted in Milwaukee County in 2024 (803 in 5+ unit buildings).
- This rent runs 33% of the median local income ($47k/yr) — at the standard rent-burdened threshold; future hikes will face affordability resistance.
Forward outlook
- In year one you build about $2k of equity ($684 loan paydown + $1k appreciation (1.3% local appreciation)).
- Milwaukee County population projected at +4% by 2050 — modest demand growth; plan on rents tracking national, not racing it.
- At projected returns (1.3% appreciation + 7.0% rent growth), your $28k cash investment doubles in ~4 years — after that, you're playing with house money.
Negotiation context
- Only 6 days on market — expect competitive offers; lowballing is unlikely to land.
- 2 sale attempts since 4y ago with the ask held roughly flat each time — persistent listings suggest the price (not the market) is what's stuck; bring a comps-based counter.
- Current owner paid $50k; list at $99k implies a 99% gain — meaningful room to come down on a strong offer.
Risks & watch-outs
- Watch-outs: built in 1909 — expect roof / HVAC / electrical / plumbing capex.
Questions for the listing agent
- Built in 1909 — when were the roof, HVAC, electrical panel, plumbing, and water heater last replaced?
- Is there a deadline driving the sale (1031 exchange, divorce, estate, relocation)? That informs how much negotiation room exists.
- Schools are F-rated, which usually means shorter tenancies and higher turnover. Who's the typical renter profile here, and what's been the actual vacancy rate?
- Crime grade is F in this area — have there been break-ins, vandalism, or insurance claims at this property in the last 3 years? What carrier currently insures it and at what premium?
- What's the average days-on-market for RENTAL listings here right now (not sales)? A rising rental-DOM trend means longer vacancies and softer asking-rent achievability than the comps imply.
- What's the recent tenant-quality profile in this submarket — average credit score on applications, eviction rate, late-payment / NSF rate, and stable-employment percentage? A property-management company in the area should have these aggregated.
- How much new for-sale + rental construction is in the pipeline within 1–3 miles? Heavy new supply typically softens prices + rents 12–24 months out; constrained supply supports both.
Investment metrics
- 1% rule
- 1.30% ✓
- Cap rate
- 10.76%
- Cash-on-cash
- 15.96%
- DSCR
- 1.71
- GRM
- 6.4
CMA / ARV
- ARV (on-the-fly)
- $130,560
- Comps found
- 12
Show comp detail 12 sales within ~0.75 mi
| Address | Dist | Beds/Ba | Sqft | Sold | Price | $/sf | Match |
|---|---|---|---|---|---|---|---|
| 2865 N 36th St | 0.64mi | 3/2.0 | 1,292 (+1%) | 2mo | $132,000 | $102 | 63 |
| 4018 W Burliegh St | 0.68mi | 3/1.0 | 1,258 (-2%) | 4mo | $55,000 | $44 | 62 |
| 3052 N 40th St | 0.66mi | 3/1.0 | 1,240 (-3%) | 4mo | $75,000 | $60 | 61 |
| 3221 N 38th St | 0.51mi | 3/1.0 | 1,174 (-8%) | 3mo | $75,000 | $64 | 60 |
| 3812 N 27th St | 0.60mi | 3/1.0 | 1,372 (+7%) | 3mo | $79,900 | $58 | 58 |
| 2929 N 25th St | 0.53mi | 3/2.5 | 1,349 (+5%) | 4mo | $200,000 | $148 | 57 |
| 3741 N 25th St | 0.58mi | 3/2.0 | 1,397 (+9%) | 2mo | $195,000 | $140 | 52 |
| 3828 N 26th St | 0.64mi | 3/1.0 | 1,177 (-8%) | 7mo | $25,000 | $21 | 51 |
| 3724 N 37th St | 0.61mi | 3/2.0 | 1,440 (+12%) | 0mo | $175,000 | $122 | 46 |
| 3144 N 38th St | 0.50mi | 2/1.0 (-1) | 1,090 (-15%) | 4mo | $120,000 | $110 | 43 |
| 2920 N 22nd St | 0.74mi | 3/1.0 | 1,118 (-13%) | 2mo | $105,000 | $94 | 43 |
| 3448 N 41st St | 0.70mi | 3/2.0 | 1,104 (-14%) | 6mo | $233,000 | $211 | 35 |
Match score weights: distance 35% · size 25% · config 20% · recency 20%. Top-matched comps best support the ARV.
Projected returns pro-forma
1.33% appreciation · 7.01% rent growth · sell at horizon
- IRR
- 21.7%
- Equity multiple
- 2.17×
- Total profit
- $32,305
- Equity at exit
- $35,499
- IRR
- 26.6%
- Equity multiple
- 4.71×
- Total profit
- $102,920
- Equity at exit
- $48,521
Cash invested: $27,720 (down + closing). Projections, not guarantees.
Landlord ↔ Tenant lean methodology
- Overall (STATE)
- 73 Landlord-Friendly
- State Wisconsin
- 73 Landlord-Friendly · R+2
- County
- — inherits STATE
- City
- — inherits STATE
ZIP-level market 53216
- Home prices YoY
- 0.3%
- Rents YoY
- 7.0%
- Active inventory
- 126
- Price-to-rent
- 6.4×
Monthly cashflow live
- Estimated rent
- $1,282 high interval (Pro) →
- Mortgage (P&I)
- −$519
- Tax from tax record
- −$84 /mo · $1,009/yr
- Insurance
- −$41
- HOA
- −$0
- Vacancy / Maint / Mgmt
- −$269
- Net cashflow
- $369
Break-even live
Sensitivity live
| Price | -10% $425 | -5% $397 | +0% $369 | +5% $341 | +10% $313 |
|---|---|---|---|---|---|
| Rent | -10% $267 | -5% $318 | +0% $369 | +5% $419 | +10% $470 |
| Rate | -1.0pp $418 | -0.5pp $394 | base $369 | +0.5pp $343 | +1.0pp $317 |
UW: 25.0% down · 7.5% · 30yr · 1.5% tax · 5.0% vac · 8.0% maint · 8.0% mgmt
Financing live
Cash to close
- Down payment
- $24,750
- Closing costs
- $2,970
- Reserves months
- —
- Total cash needed
- —
Loan-product check · same deal, 3 products live
Conventional
25% down · 7.5% · 30yr
- Down + closing
- —
- Monthly P&I
- —
- Monthly cashflow
- —
- DSCR
- —
- Eligible?
- —
Personal DTI + credit; lowest rate.
DSCR
20% down · 8.5% · 30yr
- Down + closing
- —
- Monthly P&I
- —
- Monthly cashflow
- —
- DSCR
- —
- Eligible?
- —
No personal income docs; deal must DSCR.
Hard money
10% down · 12.0% · 12mo
- Down + closing
- —
- Monthly P&I
- —
- Monthly cashflow
- —
- DSCR
- —
- Eligible?
- —
Short-term bridge; refi at stabilization.
Rent comps 40 comps
| Address | Beds | Baths | Sqft | Rent | $/sqft | DOM | Units | Dist |
|---|---|---|---|---|---|---|---|---|
| 2821 W Concordia Ave Milwaukee, WI | 3.0 | 1.5 | 1098 | $1,595 | $1.45 | 2d | 1 | 0.11mi |
| 3347 N 29th St Unit 3347A Milwaukee, WI | 2.0 | 1.0 | 950 | $845 | $0.89 | 15d | 1 | 0.16mi |
| 3124 N 33rd St Milwaukee, WI | 2.0 | 1.0 | 1200 | $1,200 | $1.00 | 44d | 1 | 0.25mi |
| 3388 N 27th St Unit 3388 Front House Milwaukee, WI | 4.0 | 1.0 | 1212 | $1,550 | $1.28 | 5d | 1 | 0.29mi |
| 2931 W Chambers St Milwaukee, WI | 2.0 | 1.0 | 1400 | $1,050 | $0.75 | 24d | 1 | 0.33mi |
| 2870 N 29th St #2872 Milwaukee, WI | 3.0 | 1.0 | 1300 | $1,250 | $0.96 | 44d | 1 | 0.47mi |
| 3148 N 39th St Milwaukee, WI | 2.0 | 1.0 | 1100 | $1,100 | $1.00 | 44d | 1 | 0.55mi |
| 3148 N 39th St Unit 1 Milwaukee, WI | 2.0 | 1.0 | 1000 | $1,100 | $1.10 | 15d | 1 | 0.56mi |
| 2945 N 23rd St Milwaukee, WI | 3.0 | 1.0 | 1014 | $1,195 | $1.18 | 44d | 1 | 0.62mi |
| 3630 W Nash St Milwaukee, WI | 2.0 | 1.0 | 1000 | $1,200 | $1.20 | 24d | 1 | 0.62mi |
| 2765 N 26th St Unit 1 Milwaukee, WI | 3.0 | 1.0 | 1125 | $1,200 | $1.07 | 5d | 1 | 0.64mi |
| 2765 N 26th St Unit 2 Milwaukee, WI | 2.0 | 1.0 | 1100 | $1,100 | $1.00 | 5d | 1 | 0.64mi |
| 3214 N 41st St Milwaukee, WI | 2.0 | 1.0 | 900 | $1,250 | $1.39 | 44d | 1 | 0.67mi |
| 3100 W Center St Milwaukee, WI | 3.0 | 2.0 | 1174 | $1,531 | $1.30 | 2d | 1 | 0.70mi |
| 2106A W Keefe Ave Unit 2106 Lower Milwaukee, WI | 3.0 | 1.0 | 1300 | $1,100 | $0.85 | 17d | 1 | 0.70mi |
| 3122 N 42nd St Milwaukee, WI | 3.0 | 1.0 | 1323 | $1,495 | $1.13 | 5d | 1 | 0.74mi |
| 3606 N 41st St Unit 3608 Milwaukee, WI | 2.0 | 1.0 | 1095 | $975 | $0.89 | 44d | 1 | 0.76mi |
| 3871-3873 N 36th St Unit 3871 Milwaukee, WI | 2.0 | 1.0 | 987 | $950 | $0.96 | 24d | 1 | 0.76mi |
| 3123 N 42nd St Milwaukee, WI | 4.0 | 1.0 | 1500 | $1,700 | $1.13 | 24d | 1 | 0.77mi |
| 2741 N 23rd St Unit 2 Milwaukee, WI | 3.0 | 1.0 | 1000 | $1,100 | $1.10 | 17d | 1 | 0.80mi |
| 2741 N 23rd St Milwaukee, WI | 3.0 | 1.0 | 900 | $1,050 | $1.17 | 15d | 1 | 0.80mi |
| 2809 W Clarke St Unit 12811 Milwaukee, WI | 3.0 | 1.0 | 1400 | $1,200 | $0.86 | 17d | 1 | 0.85mi |
| 3340 N 44th St Milwaukee, WI | 2.0 | 1.0 | 900 | $1,295 | $1.44 | 13d | 1 | 0.88mi |
| 2630 N 24th St Milwaukee, WI | 2.0 | 1.0 | 934 | $1,450 | $1.55 | 20d | 1 | 0.89mi |
| 2955 N 17th St Unit B UPSTAIRS Milwaukee, WI | 2.0 | 1.0 | 1000 | $900 | $0.90 | 17d | 1 | 0.91mi |
| 2308 W Clarke St Milwaukee, WI | 4.0 | 2.0 | 1545 | $1,750 | $1.13 | 24d | 1 | 0.94mi |
| 3646 N 19th St Milwaukee, WI | 2.0 | 1.0 | 935 | $1,100 | $1.18 | 5d | 1 | 0.96mi |
| 3416 N 17th St Unit 1 Milwaukee, WI | 3.0 | 1.0 | 1200 | $1,100 | $0.92 | 44d | 1 | 0.98mi |
| 3911 N 20th St Unit 3913 Milwaukee, WI | 2.0 | 1.0 | 950 | $995 | $1.05 | 24d | 1 | 0.99mi |
| 2530 N 37th St Milwaukee, WI | 2.0 | 1.0 | 1037 | $1,000 | $0.96 | 15d | 1 | 1.00mi |
| 3925 N 42nd St Milwaukee, WI | 2.0 | 1.0 | 985 | $1,400 | $1.42 | 24d | 1 | 1.04mi |
| 3925 N 42nd St Milwaukee, WI | 3.0 | 1.0 | 1300 | $1,675 | $1.29 | 44d | 1 | 1.04mi |
| 3890 N Sherman Blvd Milwaukee, WI | 2.0 | 1.0 | 950 | $1,100 | $1.16 | 13d | 1 | 1.05mi |
| 4227 N 26th St Milwaukee, WI | 2.0 | 1.0 | 950 | $1,000 | $1.05 | 17d | 1 | 1.09mi |
| 2712 N 44th St Unit 2712A Milwaukee, WI | 2.0 | 1.0 | 911 | $995 | $1.09 | 24d | 1 | 1.11mi |
| 2713 N 44th St Milwaukee, WI | 3.0 | 1.0 | 1450 | $1,350 | $0.93 | 44d | 1 | 1.14mi |
| 2116 W Atkinson Ave Unit A Milwaukee, WI | 4.0 | 1.0 | 1707 | $2,000 | $1.17 | 2d | 1 | 1.14mi |
| 3747 N 16th St Milwaukee, WI | 2.0 | 1.0 | 1200 | $875 | $0.73 | 44d | 1 | 1.14mi |
| 2512 N 41st St #2514 Milwaukee, WI | 2.0 | 1.0 | 1007 | $1,200 | $1.19 | 44d | 1 | 1.14mi |
| 1326 W Burleigh St Unit 1326 Lower Milwaukee, WI | 2.0 | 1.0 | 900 | $825 | $0.92 | 2d | 1 | 1.17mi |
Listing history 5 events
-
2026-06-15days on market $99,000 Active 6 DOM
-
2026-06-13days on market $99,000 Active 4 DOM
-
2026-06-13days on market $99,000 Active 3 DOM
-
2026-06-10remarks 135-char remark
-
2026-06-10$99,000 Active 1 DOM
ⓘ Source: listings_history table (triggers on properties + properties_extension) + one-shot
backfill from property_details.listing_events for pre-trigger history.
Tax reassessment forecast WI · Partial reset (capped growth)
- Current annual tax
- $1,009 · $84/mo
- Projected year-2 tax
- $1,420 · $118/mo
- Expected delta
- +$411/yr (+$34/mo · 40.8%)
ⓘ Screening estimate from a state-policy table — verify with the county assessor before closing.
Climate risk First Street
- Flood 1/10 Low FEMA zone X (unshaded) · 0% chance over 30 yrs
- Wildfire 1/10 Low
- Heat 2/10 Low 7 d/yr ≥98°F today · 13 d/yr by 30 yrs out
- Wind 2/10 Low
- Air quality 2/10 Low 2 unhealthy d/yr today · 2 by 30 yrs out
Nearby sold comps map
Loading sold comps map…
Walkable amenities ~0.75 mi
Loading nearby amenities…
Taxation est. · year 1
- Rental income
- $15,389
- − Mortgage interest
- −$5,546
- − Property taxes
- −$1,009
- − Insurance
- −$495
- − Repairs & maintenance
- −$1,231
- − Management
- −$1,231
- − Depreciation
- −$2,880
- Taxable income
- $2,997
- Est. tax owed @ 24.0%
- −$719
- After-tax cash flow
- $3,704/yr
For passive investors: Depreciation is non-cash, so a rental often shows a tax loss while cash-flowing — sheltering income. Rental losses are passive: they offset passive income freely, and up to $25,000/yr can offset ordinary (W-2) income if you actively participate and your MAGI is under $100k (phasing out to $0 by $150k); unused losses carry forward. On sale, claimed depreciation is recaptured at up to 25%, and gains may owe capital-gains tax (a 1031 exchange can defer both). Figures are a year-1 estimate at your 24.0% rate — not tax advice; consult a CPA.
Schools (NCES district)
- District
- Milwaukee School District
- NCES district ID
- 5509600
- Math proficiency
- 10% ▼ -5.00%
- Reading proficiency
- 18% ▬ 0.00%
- Median HH income
- $36,339
- Composite
- 11.61/100
- National rank
- #9696
- State rank
- #337 of 342 in WI
Livability — Milwaukee
- Score
- 81/100
- State rank
- #55
- US rank
- #1534
Category grades
Schools grade is shown separately in the Schools card above.
Census & demographics
- Census place
- Milwaukee, WI
- County
- Milwaukee County · 926,379 people
- City population
- 573,768
- Metro
- Milwaukee-Waukesha, WI
- Population (ZIP)
- 30,345
- Household income
- $46,752
- Rent vs Own
- Severe rent burden
- 2202.0
Population outlook (Milwaukee County) Hauer SSP2
- Today (2025)
- 995,758 people
- By 2030
- 1,009,124 · +1.3%
- By 2040
- 1,028,128 · +3.3%
- By 2050
- 1,040,066 · +4.4%
- By 2075
- 1,057,849 · +6.2%
- By 2100
- 1,039,774 · +4.4%
Race, ethnicity, and origin ACS 2023
- Neighborhood character
- Predominantly Black (81%)
- Race & ethnicity
- Black 81% White 9% Hispanic / Latino 5% Two or more races 5% Asian 3%
- Hispanic origin (detail)
- Mexican 2% Puerto Rican 3%
- Common ancestry
- Romanian 1%
- Foreign-born
- 3% · Canada, Philippines, China
- Languages at home
- 93% English-only · Spanish 4% Other Asian/Pacific 2%
Political lean MEDSL · Milwaukee
- 2024 margin
- Solid D (+38.5) · D 68.3% · R 29.8% · Other 1.8%
- 2008→2024 swing
- +2.7pp toward D · 2008: 35.9pp · 2024: 38.5pp
- All cycles
- 2024: D+38.5 2020: D+39.9 2016: D+37.5 2012: D+34.6 2008: D+35.9
Not yet ingested
- Civics
- —
Market trends
- HPI YoY
- ▲ 1.33%
- Current HPI
- 381.0954
- Rent YoY
- ▲ 7.01%
- Metro
- Milwaukee-Waukesha, WI
- State GDP YoY
- ▲ 2.10%
- F500 in state
- 20
Industry mix (Fortune 500 HQ in WI)
| Industry | F500 HQs | Revenue |
|---|---|---|
| Industrial Machinery | 4 | $23B |
|
||
| Industrial Technology | 2 | $36B |
|
||
| Insurance | 1 | $36B |
|
||
| Professional Services | 1 | $19B |
|
||
| Utilities | 1 | $9B |
|
||
| Consumer Goods | 1 | $3B |
|
||
Price history
+725.0% since first listed6 events — show timeline
- 2026-06-09 Listed $99,000 METROMLS
- 2023-02-14 Listing Removed — METROMLS
- 2022-08-17 Listed $75,000 METROMLS
- 2007-01-19 Sold (Public Records) $49,800 Public Records
- 2006-12-29 Sold (MLS) $48,900 METROMLS
- 1973-02-01 Sold (Public Records) $12,000 Public Records
Property tax history
-3.8%/yrLatest (2024): $1,009 · -0.6% YoY. Source: county tax records.
Cash-flow waterfall
monthlySold comps — $/sqft
last 12 mo · ≤1 miLoading sold comps…