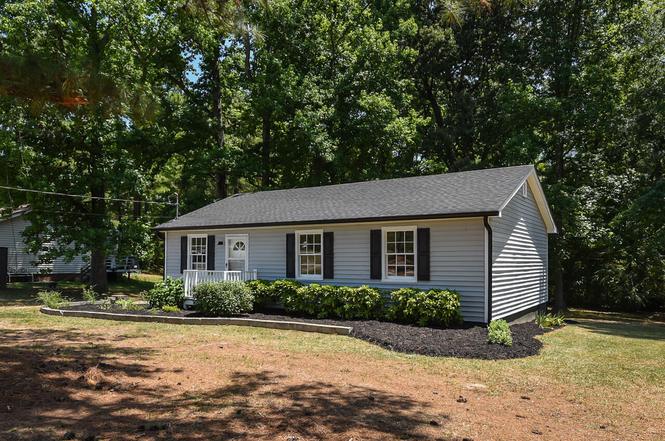
939 Cheves Rd · Zebulon, NC
Flood risk 1/10 · Minimal
- FEMA flood zone
- X (unshaded)
- Chance of flooding over 30 yrs
- 0.0%
- Est. flood insurance / yr
- $507 – $1,088
Fire risk 3/10 · Minor
- Est. fire insurance / yr
- $906 – $1,684
Heat risk 7/10 · Major
- Hot days now (above 106°F)
- 7 days/yr
- Hot days in 30 yrs
- 16 days/yr
Wind risk 6/10 · Moderate
- Chance of severe wind over 30 yrs
- 56.0%
Air-quality risk 2/10 · Minimal
- Unhealthy air days now
- 1 days/yr
- Unhealthy air days in 30 yrs
- 1 days/yr
Risk factors via First Street. Map © Google.
Why this score? — see what drove the D grade
The composite is a weighted blend of 9 inputs, each scored 0–100. Each bar is that input's sub-score; the figure is the points it added to the 100-point composite (weight × sub-score).
- Cash flow +14.5/30.0
- ARV discount +10.1/15.0
- DSCR +4.4/10.0
- Livability +3.3/5.0
- Schools +3.0/10.0
- 1% rule +2.9/10.0
- Rent growth +2.9/5.0
- Condition / age +2.5/5.0
- Appreciation +0.0/10.0
$235,000
🖨 Deal sheet 📄 Offer letter ✓ Due diligence
Listing remarks
Updated and beautifully refreshed, nestled on 0.76 acres - 939 Cheves is move-In Ready! No HOA or covenants. Rent and lease/option rent to own terms are also available! Welcome to 939 Cheves Rd -- blending modern finishes with comfortable, everyday living. This delightful 3-bed, 1-bath residence offers 1,062 sq. ft. of thoughtfully renovated space and plenty of outdoor room to enjoy. Step inside to discover a freshly painted interior with stylish luxury vinyl flooring, smooth ceilings, and abundant natural light. The heart of the home is the modern kitchen, featuring quartz countertops, stainless steel appliances, and bright fixtures -- ideal for casual meals or entertaining. The 3 well-pr
Key facts
- Quartz countertops
- Move in ready
- Modern kitchen
Tags
Property features AI
Finance
- HOA & community: No association
Exterior
- Parking: Open parking for 2 vehicles; Gravel, unpaved parking
- Utilities: Shared well water; Septic tank; Electricity connected; Water and septic connected
- Home design: Single-story house; Entry on front or side doors; No common walls
- Construction: Vinyl siding; Shingle roof; Crawl space basement; Built/structured as a house
- Exterior features: Front porch; Side porch; Exterior storage; Property partially wooded with cleared and grassed areas
Interior
- Kitchen: Dishwasher; Electric range; Microwave
- Bedrooms: Three bedrooms (all on the main level)
- Flooring: Luxury vinyl
- Bathrooms: One full bathroom
- Heating & cooling: Electric heating with heat pump; Central air conditioning
- Interior features: Updated/remodeled interior; Storage space
- Laundry & utility: Inside laundry in a laundry closet on the main level
Neighborhood map
What this means for you Summary
Snapshot
- This is a 3-bed/1.0-bath single-family listed at $235k.
Deal economics
- At list price, monthly cash flow is $53 ($637/yr) — positive.
- The deal already cash-flows at list — no discount required.
- To meet the 1% rule (rent ≥ 1% of price), the offer needs to be $186k (20.9% below list).
- Recommended offer: $186k (20.9% below list) — sets the bar for 1% rule.
- Cap rate 6.6% vs local median 3.6% in Zebulon — top-decile yield for the area; either an underpriced asset or a hidden risk that comps aren't pricing in. Stress-test before assuming the spread holds.
Location & tenants
- Location reads 66/100 on livability (#264 in NC) — a middle-class / working-renter tenant base. Strengths: cost of living A+, health & safety A+, housing A-; Watch: crime D+, schools D-, amenities F.
- Franklin County Schools (rural): math 34% / reading 37% proficiency, ranked #128 of 178 in NC (top 72%) — families likely to look elsewhere, expect single-tenant / working-renter base with shorter leases.
- Market conditions: Rents rising (+1.5%/yr); 657 active listings in the ZIP; solid renter incomes; 948 units permitted in Franklin County in 2024 (0 in 5+ unit buildings).
Forward outlook
- Local home prices are declining (-3.0%/yr); year-one equity from $2k of loan paydown is wiped out by about $7k of value loss. Plan a longer hold.
- Franklin County population projected at +13% by 2050 — modest demand growth; plan on rents tracking national, not racing it.
Negotiation context
- Only 3 days on market — expect competitive offers; lowballing is unlikely to land.
- 3 sale attempts with the ask held roughly flat each time — persistent listings suggest the price (not the market) is what's stuck; bring a comps-based counter.
- Current owner paid $111k; list at $235k implies a 112% gain — meaningful room to come down on a strong offer.
Risks & watch-outs
- Climate carrying-cost: major wind risk, 56% chance of damaging wind over 30y; extreme-heat days projected 7→16/yr by 2055 (HVAC capex compounding) — expect insurance premiums to compound above CPI over the hold.
Questions for the listing agent
- Is there a deadline driving the sale (1031 exchange, divorce, estate, relocation)? That informs how much negotiation room exists.
- Schools are D-rated, which usually means shorter tenancies and higher turnover. Who's the typical renter profile here, and what's been the actual vacancy rate?
- Crime grade is D in this area — have there been break-ins, vandalism, or insurance claims at this property in the last 3 years? What carrier currently insures it and at what premium?
- The area grade is low — what's the realistic commute time and amenity access for the typical tenant pool here? Any planned neighborhood developments (good or bad) we should know about?
- What's the average days-on-market for RENTAL listings here right now (not sales)? A rising rental-DOM trend means longer vacancies and softer asking-rent achievability than the comps imply.
- What's the recent tenant-quality profile in this submarket — average credit score on applications, eviction rate, late-payment / NSF rate, and stable-employment percentage? A property-management company in the area should have these aggregated.
- How much new for-sale + rental construction is in the pipeline within 1–3 miles? Heavy new supply typically softens prices + rents 12–24 months out; constrained supply supports both.
Investment metrics
- 1% rule
- 0.79% ✗
- Cap rate
- 6.56%
- Cash-on-cash
- 0.97%
- DSCR
- 1.04
- GRM
- 10.5
CMA / ARV
- ARV (on-the-fly)
- $249,600
- Comps found
- 1
Show comp detail 1 sale within ~0.75 mi
| Address | Dist | Beds/Ba | Sqft | Sold | Price | $/sf | Match |
|---|---|---|---|---|---|---|---|
| 879 Cheves Rd | 0.12mi | 3/1.0 | 1,040 (0%) | 13mo | $250,000 | $240 | 84 |
Match score weights: distance 35% · size 25% · config 20% · recency 20%. Top-matched comps best support the ARV.
Projected returns pro-forma
-3.0% appreciation · 1.54% rent growth · sell at horizon
- IRR
- -16.3%
- Equity multiple
- 0.43×
- Total profit
- $-37,490
- Equity at exit
- $35,039
- IRR
- -10.5%
- Equity multiple
- 0.40×
- Total profit
- $-39,425
- Equity at exit
- $20,319
Cash invested: $65,800 (down + closing). Projections, not guarantees.
Landlord ↔ Tenant lean methodology
- Overall (STATE)
- 85 Strongly Landlord-Friendly
- State North Carolina
- 85 Strongly Landlord-Friendly · R+3
- County
- — inherits STATE
- City
- — inherits STATE
ZIP-level market 27597
- Home prices YoY
- -30.1%
- Rents YoY
- 1.5%
- Active inventory
- 657
- Price-to-rent
- 10.5×
Monthly cashflow live
- Estimated rent
- $1,859 medium interval (Pro) →
- Mortgage (P&I)
- −$1,232
- Tax from tax record
- −$86 /mo · $1,027/yr
- Insurance
- −$98
- HOA
- −$0
- Vacancy / Maint / Mgmt
- −$390
- Net cashflow
- $53
Break-even live
UW: 25.0% down · 7.5% · 30yr · 1.5% tax · 5.0% vac · 8.0% maint · 8.0% mgmt
Financing live
Cash to close
- Down payment
- $58,750
- Closing costs
- $7,050
- Reserves months
- —
- Total cash needed
- —
Loan-product check · same deal, 3 products live
Conventional
25% down · 7.5% · 30yr
- Down + closing
- —
- Monthly P&I
- —
- Monthly cashflow
- —
- DSCR
- —
- Eligible?
- —
Personal DTI + credit; lowest rate.
DSCR
20% down · 8.5% · 30yr
- Down + closing
- —
- Monthly P&I
- —
- Monthly cashflow
- —
- DSCR
- —
- Eligible?
- —
No personal income docs; deal must DSCR.
Hard money
10% down · 12.0% · 12mo
- Down + closing
- —
- Monthly P&I
- —
- Monthly cashflow
- —
- DSCR
- —
- Eligible?
- —
Short-term bridge; refi at stabilization.
Listing history 5 events
-
2026-06-18status $235,000 Pending 3 DOM
-
2026-06-17days on market $235,000 Active 3 DOM
-
2026-06-16days on market $235,000 Active 2 DOM
-
2026-06-15remarks 699-char remark
-
2026-06-15$235,000 Active 1 DOM
ⓘ Source: listings_history table (triggers on properties + properties_extension) + one-shot
backfill from property_details.listing_events for pre-trigger history.
Tax reassessment forecast NC · Resets to sale price
- Current annual tax
- $1,027 · $86/mo
- Projected year-2 tax
- $1,927 · $161/mo
- Expected delta
- +$900/yr (+$75/mo · 87.7%)
ⓘ Screening estimate from a state-policy table — verify with the county assessor before closing.
Climate risk First Street
- Flood 1/10 Low FEMA zone X (unshaded) · 0% chance over 30 yrs
- Wildfire 3/10 Moderate
- Heat 7/10 Severe 7 d/yr ≥106°F today · 16 d/yr by 30 yrs out
- Wind 6/10 Major 56% chance of damaging wind over 30 yrs
- Air quality 2/10 Low 1 unhealthy d/yr today · 1 by 30 yrs out
Nearby sold comps map
Loading sold comps map…
Walkable amenities ~0.75 mi
Loading nearby amenities…
Taxation est. · year 1
- Rental income
- $22,313
- − Mortgage interest
- −$13,164
- − Property taxes
- −$1,027
- − Insurance
- −$1,175
- − Repairs & maintenance
- −$1,785
- − Management
- −$1,785
- − Depreciation
- −$6,836
- Taxable loss
- −$3,459
- Est. tax savings @ 24.0%
- +$830
- After-tax cash flow
- $1,467/yr
For passive investors: Depreciation is non-cash, so a rental often shows a tax loss while cash-flowing — sheltering income. Rental losses are passive: they offset passive income freely, and up to $25,000/yr can offset ordinary (W-2) income if you actively participate and your MAGI is under $100k (phasing out to $0 by $150k); unused losses carry forward. On sale, claimed depreciation is recaptured at up to 25%, and gains may owe capital-gains tax (a 1031 exchange can defer both). Figures are a year-1 estimate at your 24.0% rate — not tax advice; consult a CPA.
Schools (NCES district)
- District
- Franklin County Schools
- NCES district ID
- 3701530
- Math proficiency
- 34% ▬ 0.00%
- Reading proficiency
- 37% ▼ -4.00%
- Median HH income
- $44,630
- Composite
- 30.25/100
- National rank
- #6286
- State rank
- #128 of 178 in NC
Livability — Zebulon
- Score
- 66/100
- State rank
- #264
- US rank
- #11505
Category grades
Schools grade is shown separately in the Schools card above.
Census & demographics
- County
- Wake County · 1,216,256 people
- City population
- 30,184
- Metro
- Raleigh-Cary, NC
- Population (ZIP)
- 30,184
- Household income
- $84,625
- Rent vs Own
- Severe rent burden
- 592.0
Population outlook (Franklin County) Hauer SSP2
- Today (2025)
- 69,848 people
- By 2030
- 72,480 · +3.8%
- By 2040
- 76,682 · +9.8%
- By 2050
- 78,993 · +13.1%
- By 2075
- 82,888 · +18.7%
- By 2100
- 80,784 · +15.7%
Race, ethnicity, and origin ACS 2023
- Neighborhood character
- Diverse neighborhood (Simpson 0.61)
- Race & ethnicity
- White 55% Black 24% Hispanic / Latino 15% Two or more races 10%
- Hispanic origin (detail)
- Mexican 9% Puerto Rican 1%
- Common ancestry
- Romanian 4% Slovak 3% Italian 1%
- Foreign-born
- 9% · Canada
- Languages at home
- 87% English-only · Spanish 12%
Political lean MEDSL · Franklin
- 2024 margin
- R (+13.6) · D 42.7% · R 56.3%
- 2008→2024 swing
- -12.9pp toward R · 2008: -0.7pp · 2024: -13.6pp
- All cycles
- 2024: R+13.6 2020: R+13.4 2016: R+11.7 2012: R+4.2 2008: R+0.7
Not yet ingested
- Civics
- —
Market trends
- HPI YoY
- ▼ -94.86%
- Current HPI
- 220.7242
- Rent YoY
- ▲ 1.54%
- Metro
- Raleigh-Cary, NC
- State GDP YoY
- ▲ 3.28%
- F500 in state
- 26
Industry mix (Fortune 500 HQ in NC)
| Industry | F500 HQs | Revenue |
|---|---|---|
| Financial Services | 2 | $213B |
|
||
| Retail | 2 | $95B |
|
||
| Industrial Conglomerate | 1 | $38B |
|
||
| Metals / Steel | 1 | $35B |
|
||
| Utilities | 1 | $30B |
|
||
| Industrial Machinery | 1 | $19B |
|
||
Price history
+111.7% since first listed11 events — show timeline
- 2026-06-14 Listed $235,000 TMLS
- 2026-04-16 Listing Removed — TMLS
- 2026-04-04 Price Changed $225,000 TMLS
- 2026-03-04 Price Changed $230,000 TMLS
- 2026-02-12 Relisted — TMLS
- 2026-02-02 Pending — TMLS
- 2026-01-18 Price Changed $235,000 TMLS
- 2026-01-07 Price Changed $240,000 TMLS
- 2025-11-25 Price Changed $249,000 TMLS
- 2025-11-05 Listed $260,000 TMLS
- 2025-06-30 Sold (Public Records) $111,000 Public Records
Property tax history
+3.5%/yrLatest (2025): $1,027 · +1.6% YoY. Source: county tax records.
Cash-flow waterfall
monthlySold comps — $/sqft
last 12 mo · ≤1 miLoading sold comps…