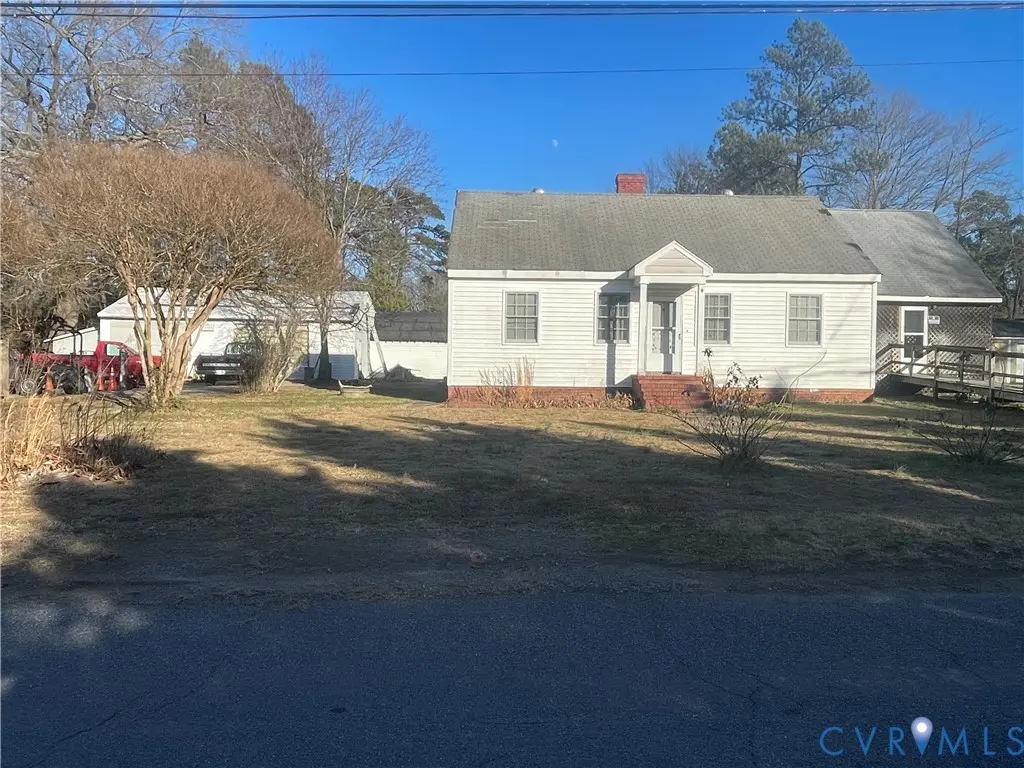
10211 Elokomin Ave · Bellwood, VA
Flood risk 1/10 · Minimal
- FEMA flood zone
- X (unshaded)
- Chance of flooding over 30 yrs
- 0.0%
- Est. flood insurance / yr
- $507 – $1,088
Fire risk 2/10 · Minimal
- Est. fire insurance / yr
- $666 – $1,236
Heat risk 7/10 · Major
- Hot days now (above 107°F)
- 7 days/yr
- Hot days in 30 yrs
- 16 days/yr
Wind risk 6/10 · Moderate
- Chance of severe wind over 30 yrs
- 27.0%
Air-quality risk 2/10 · Minimal
- Unhealthy air days now
- 1 days/yr
- Unhealthy air days in 30 yrs
- 1 days/yr
Risk factors via First Street. Map © Google.
Why this score? — see what drove the C+ grade
The composite is a weighted blend of 9 inputs, each scored 0–100. Each bar is that input's sub-score; the figure is the points it added to the 100-point composite (weight × sub-score).
- Cash flow +20.4/30.0
- ARV discount +15.0/15.0
- DSCR +6.5/10.0
- Schools +5.2/10.0
- 1% rule +5.1/10.0
- Livability +3.1/5.0
- Rent growth +2.5/5.0
- Condition / age +2.5/5.0
- Appreciation +0.0/10.0
$239,900
🖨 Deal sheet 📄 Offer letter ✓ Due diligence
Listing remarks MLS
Subject is being sold in an upcoming Xome auction. "No Trespassing! Do Not Disturb Occupant! No Showings Permitted!" . HALFWAY HOUSE HGTS L1-7 BK 2 includes 795-66-65-53-100-000 and 795-66-65-82-300-000 +/- . 524 acres
Key facts
- 0.52 acre lot
- 2 garage spots
- Built 1945
Neighborhood map
What this means for you Summary
Snapshot
- This is a 4-bed/2.0-bath single-family listed at $240k.
Deal economics
- At list price, monthly cash flow is $313 ($4k/yr) — positive.
- The deal already cash-flows at list — no discount required.
- Meets the 1% rule at list price ($2k rent vs $240k).
- Recommended offer: $211k (12.0% below list) — sets the bar for market timing.
Location & tenants
- Location reads 61/100 on livability (#426 in VA) — a middle-class / working-renter tenant base. Strengths: cost of living A+, housing A+; Watch: amenities F, commute F, employment D-.
- Chesterfield County Public School District (suburban): math 52% / reading 64% proficiency, ranked #57 of 131 in VA (top 44%) — acceptable for families but not a draw, mixed tenant base, ~2y average lease.
- Market conditions: 134 active listings in the ZIP; 1 comparable units currently listed for rent nearby; solid renter incomes; 2,307 units permitted in Chesterfield County in 2024 (462 in 5+ unit buildings).
- This rent runs 36% of the median local income ($80k/yr) — at the standard rent-burdened threshold; future hikes will face affordability resistance.
Forward outlook
- Local home prices are declining (-3.0%/yr); year-one equity from $2k of loan paydown is wiped out by about $7k of value loss. Plan a longer hold.
- Chesterfield County population projected at +20% by 2050 — long-run rental-demand tailwind backs the buy-and-hold thesis.
Negotiation context
- It's been on market 170 days — a 12% lower offer ($211k) is reasonable based on typical stale-listing flexibility.
- Current owner paid $195k; 23% above their basis — modest negotiation headroom, anchor on the comps not their cost.
Risks & watch-outs
- Watch-outs: built in 1945 — expect roof / HVAC / electrical / plumbing capex.
- Climate carrying-cost: major wind risk, 27% chance of damaging wind over 30y; extreme-heat days projected 7→16/yr by 2055 (HVAC capex compounding) — expect insurance premiums to compound above CPI over the hold.
Questions for the listing agent
- It's been on market 170 days. Have you received any prior offers? Is the seller open to a 12% concession, seller financing, or rate buy-down credit?
- Built in 1945 — when were the roof, HVAC, electrical panel, plumbing, and water heater last replaced?
- Why hasn't it sold? Are there any deal-killer items the seller is aware of (foundation, flood, title, zoning, code violations)?
- Is there a deadline driving the sale (1031 exchange, divorce, estate, relocation)? That informs how much negotiation room exists.
- What's the average days-on-market for RENTAL listings here right now (not sales)? A rising rental-DOM trend means longer vacancies and softer asking-rent achievability than the comps imply.
- What's the recent tenant-quality profile in this submarket — average credit score on applications, eviction rate, late-payment / NSF rate, and stable-employment percentage? A property-management company in the area should have these aggregated.
- How much new for-sale + rental construction is in the pipeline within 1–3 miles? Heavy new supply typically softens prices + rents 12–24 months out; constrained supply supports both.
Investment metrics
- 1% rule
- 1.01% ✓
- Cap rate
- 7.86%
- Cash-on-cash
- 5.60%
- DSCR
- 1.25
- GRM
- 8.3
CMA / ARV
- ARV (median comp)
- $332,183
- List price
- $239,900
- Delta
- -27.78%
- Verdict
- UNDERPRICED
- Comps
- 20 within 1.0 mi
Show comp detail 5 sales within ~0.75 mi
| Address | Dist | Beds/Ba | Sqft | Sold | Price | $/sf | Match |
|---|---|---|---|---|---|---|---|
| 2725 General Blvd | 0.35mi | 4/3.5 | 2,160 (+2%) | 3mo | $415,000 | $192 | 71 |
| 2726 General Blvd | 0.38mi | 4/2.0 | 1,918 (-9%) | 1mo | $375,000 | $196 | 67 |
| 9949 Reymet Ct | 0.14mi | 3/2.0 (-1) | 1,924 (-9%) | 10mo | $352,000 | $183 | 65 |
| 10526 Buena Vista Blvd | 0.46mi | 4/2.0 | 1,796 (-15%) | 6mo | $240,000 | $134 | 48 |
| 10050 S General Blvd | 0.54mi | 4/2.0 | 1,832 (-13%) | 9mo | $399,900 | $218 | 46 |
Match score weights: distance 35% · size 25% · config 20% · recency 20%. Top-matched comps best support the ARV.
Projected returns pro-forma
-3.0% appreciation · 3.0% rent growth · sell at horizon
- IRR
- -7.6%
- Equity multiple
- 0.72×
- Total profit
- $-18,922
- Equity at exit
- $35,770
- IRR
- 1.9%
- Equity multiple
- 1.14×
- Total profit
- $9,203
- Equity at exit
- $20,742
Cash invested: $67,172 (down + closing). Projections, not guarantees.
Landlord ↔ Tenant lean methodology
- Overall (STATE)
- 55 Moderately Landlord-Leaning
- State Virginia
- 55 Moderately Landlord-Leaning · D+2
- County
- — inherits STATE
- City
- — inherits STATE
ZIP-level market 23237
- Active inventory
- 134
- Price-to-rent
- 8.3×
Monthly cashflow live
- Estimated rent
- $2,411 medium interval (Pro) →
- Mortgage (P&I)
- −$1,258
- Tax from tax record
- −$234 /mo · $2,804/yr
- Insurance
- −$100
- HOA
- −$0
- Vacancy / Maint / Mgmt
- −$506
- Net cashflow
- $313
Break-even live
UW: 25.0% down · 7.5% · 30yr · 1.5% tax · 5.0% vac · 8.0% maint · 8.0% mgmt
Financing live
Cash to close
- Down payment
- $59,975
- Closing costs
- $7,197
- Reserves months
- —
- Total cash needed
- —
Loan-product check · same deal, 3 products live
Conventional
25% down · 7.5% · 30yr
- Down + closing
- —
- Monthly P&I
- —
- Monthly cashflow
- —
- DSCR
- —
- Eligible?
- —
Personal DTI + credit; lowest rate.
DSCR
20% down · 8.5% · 30yr
- Down + closing
- —
- Monthly P&I
- —
- Monthly cashflow
- —
- DSCR
- —
- Eligible?
- —
No personal income docs; deal must DSCR.
Hard money
10% down · 12.0% · 12mo
- Down + closing
- —
- Monthly P&I
- —
- Monthly cashflow
- —
- DSCR
- —
- Eligible?
- —
Short-term bridge; refi at stabilization.
Rent comps 1 comps
| Address | Beds | Baths | Sqft | Rent | $/sqft | DOM | Units | Dist |
|---|---|---|---|---|---|---|---|---|
| 11101 Timonium Dr Chester, VA | 4.0 | 1.5 | 1428 | $2,600 | $1.82 | 44d | 1 | 1.20mi |
Listing history 18 events
-
2026-06-18days on market $239,900 Active 170 DOM
-
2026-06-17days on market $239,900 Active 169 DOM
-
2026-06-16days on market $239,900 Active 168 DOM
-
2026-06-15days on market $239,900 Active 167 DOM
-
2026-06-13days on market $239,900 Active 165 DOM
-
2026-06-13days on market $239,900 Active 164 DOM
-
2026-06-09days on market $239,900 Active 161 DOM
-
2026-06-08days on market $239,900 Active 160 DOM
-
2026-06-07days on market $239,900 Active 159 DOM
-
2026-06-05days on market $239,900 Active 156 DOM
-
2026-06-03days on market $239,900 Active 155 DOM
-
2026-06-02days on market $239,900 Active 154 DOM
-
2026-06-01days on market $239,900 Active 153 DOM
-
2026-05-31days on market $239,900 Active 152 DOM
-
2026-03-26price $239,900 229-char remark
Show marketing remark (229 chars)
Subject is being sold in an upcoming Xome auction. "No Trespassing! Do Not Disturb Occupant! No Showings Permitted!" . HALFWAY HOUSE HGTS L1-7 BK 2 includes 795-66-65-53-100-000 and 795-66-65-82-300-000 +/- . 524 acres
-
2026-01-29soldstatus $194,796
-
2025-12-30$249,900 Active 229-char remark
Show marketing remark (229 chars)
Subject is being sold in an upcoming Xome auction. "No Trespassing! Do Not Disturb Occupant! No Showings Permitted!" . HALFWAY HOUSE HGTS L1-7 BK 2 includes 795-66-65-53-100-000 and 795-66-65-82-300-000 +/- . 524 acres
-
1996-09-11soldstatus $1,957
ⓘ Source: listings_history table (triggers on properties + properties_extension) + one-shot
backfill from property_details.listing_events for pre-trigger history.
Tax reassessment forecast VA · Resets to sale price
- Current annual tax
- $2,804 · $234/mo
- Projected year-2 tax
- $2,804 · $234/mo
- Expected delta
- $0/yr ($0/mo · 0.0%)
ⓘ Screening estimate from a state-policy table — verify with the county assessor before closing.
Climate risk First Street
- Flood 1/10 Low FEMA zone X (unshaded) · 0% chance over 30 yrs
- Wildfire 2/10 Low
- Heat 7/10 Severe 7 d/yr ≥107°F today · 16 d/yr by 30 yrs out
- Wind 6/10 Major 27% chance of damaging wind over 30 yrs
- Air quality 2/10 Low 1 unhealthy d/yr today · 1 by 30 yrs out
Nearby sold comps map
Loading sold comps map…
Walkable amenities ~0.75 mi
Loading nearby amenities…
Taxation est. · year 1
- Rental income
- $28,938
- − Mortgage interest
- −$13,438
- − Property taxes
- −$2,804
- − Insurance
- −$1,200
- − Repairs & maintenance
- −$2,315
- − Management
- −$2,315
- − Depreciation
- −$6,979
- Taxable loss
- −$113
- Est. tax savings @ 24.0%
- +$27
- After-tax cash flow
- $3,787/yr
For passive investors: Depreciation is non-cash, so a rental often shows a tax loss while cash-flowing — sheltering income. Rental losses are passive: they offset passive income freely, and up to $25,000/yr can offset ordinary (W-2) income if you actively participate and your MAGI is under $100k (phasing out to $0 by $150k); unused losses carry forward. On sale, claimed depreciation is recaptured at up to 25%, and gains may owe capital-gains tax (a 1031 exchange can defer both). Figures are a year-1 estimate at your 24.0% rate — not tax advice; consult a CPA.
Schools (NCES district)
- District
- Chesterfield County Public School District
- NCES district ID
- 5100840
- Math proficiency
- 52% ▼ -30.00%
- Reading proficiency
- 64% ▼ -15.00%
- Median HH income
- $72,821
- Composite
- 51.56/100
- National rank
- #1712
- State rank
- #57 of 131 in VA
Livability — Bellwood
- Score
- 61/100
- State rank
- #426
- US rank
- #18187
Category grades
Schools grade is shown separately in the Schools card above.
Census & demographics
- Census place
- Bellwood, VA
- County
- Chesterfield County · 406,988 people
- Metro
- Richmond, VA
- Population (ZIP)
- 27,126
- Household income
- $79,606
- Rent vs Own
- Severe rent burden
- 706.0
Population outlook (Chesterfield County) Hauer SSP2
- Today (2025)
- 377,190 people
- By 2030
- 395,710 · +4.9%
- By 2040
- 427,694 · +13.4%
- By 2050
- 452,706 · +20.0%
- By 2075
- 505,533 · +34.0%
- By 2100
- 521,282 · +38.2%
Race, ethnicity, and origin ACS 2023
- Neighborhood character
- Diverse neighborhood (Simpson 0.69)
- Race & ethnicity
- White 41% Black 28% Hispanic / Latino 25% Two or more races 8% Asian 2%
- Hispanic origin (detail)
- Mexican 6% Puerto Rican 1%
- Common ancestry
- Slovak 2% Italian 1% Lithuanian 1%
- Foreign-born
- 15% · Canada, China, Jamaica
- Languages at home
- 76% English-only · Spanish 21% French/Haitian/Cajun 1%
Political lean MEDSL · Chesterfield
- 2024 margin
- Lean D (+9.0) · D 53.8% · R 44.8% · Other 1.4%
- 2008→2024 swing
- +16.4pp toward D · 2008: -7.5pp · 2024: 9.0pp
- All cycles
- 2024: D+9.0 2020: D+6.7 2016: R+2.2 2012: R+7.1 2008: R+7.5
Not yet ingested
- Civics
- —
Market trends
- HPI YoY
- ▼ -248.73%
- Current HPI
- 303.329
- Rent YoY
- —
- Metro
- Richmond, VA
- State GDP YoY
- ▲ 2.40%
- F500 in state
- 50
Industry mix (Fortune 500 HQ in VA)
| Industry | F500 HQs | Revenue |
|---|---|---|
| Aerospace / Defense | 4 | $236B |
|
||
| Technology / Defense | 3 | $32B |
|
||
| Financial Services | 2 | $176B |
|
||
| Utilities | 2 | $27B |
|
||
| Insurance | 2 | $25B |
|
||
| Technology | 2 | $15B |
|
||
Price history
+12158.6% since first listed4 events — show timeline
- 2026-03-26 Price Changed $239,900 CVRMLS
- 2026-01-29 Sold (Public Records) $194,796 Public Records
- 2025-12-30 Listed $249,900 CVRMLS
- 1996-09-11 Sold (Public Records) $1,957 Public Records
Property tax history
+6.4%/yrLatest (2025): $2,804 · +15.9% YoY. Source: county tax records.
Cash-flow waterfall
monthlySold comps — $/sqft
last 12 mo · ≤1 miLoading sold comps…