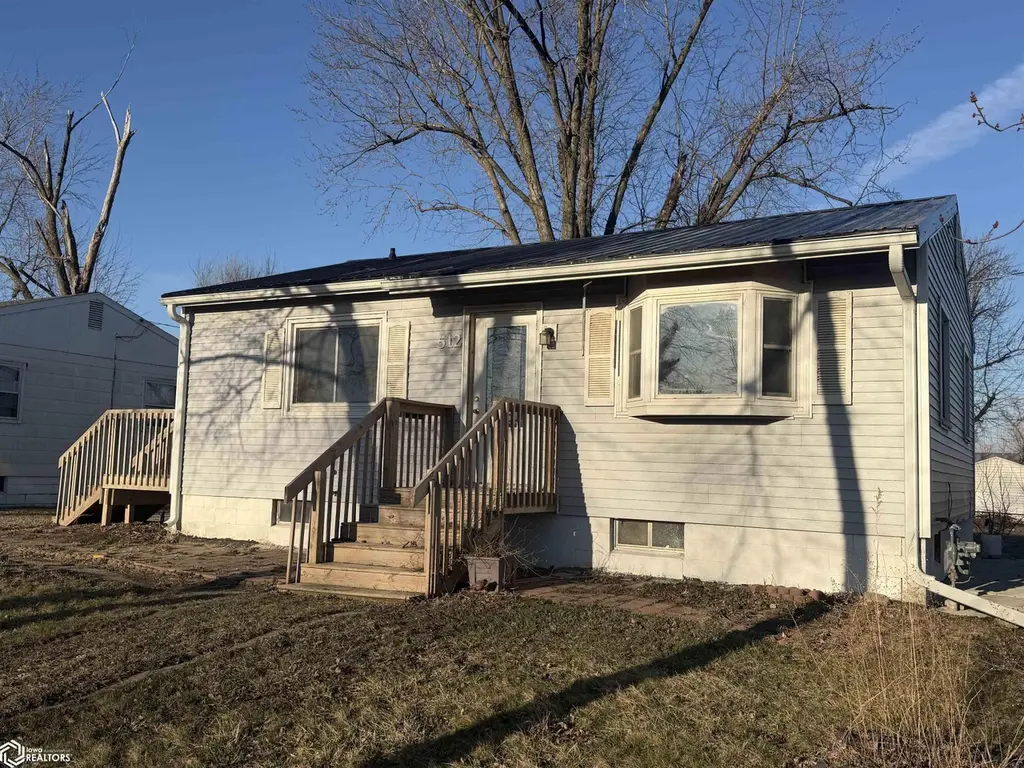
512 Sharon Ave · Marshalltown, IA
Flood risk 1/10 · Minimal
- FEMA flood zone
- X
- Chance of flooding over 30 yrs
- 0.0%
- Est. flood insurance / yr
- $473 – $860
Fire risk 4/10 · Minor
- Est. fire insurance / yr
- $902 – $1,676
Heat risk 3/10 · Minor
- Hot days now (above 104°F)
- 7 days/yr
- Hot days in 30 yrs
- 15 days/yr
Wind risk 2/10 · Minimal
- Chance of severe wind over 30 yrs
- —
Air-quality risk 1/10 · Minimal
- Unhealthy air days now
- 0 days/yr
- Unhealthy air days in 30 yrs
- 0 days/yr
Risk factors via First Street. Map © Google.
Why this score? — see what drove the B- grade
The composite is a weighted blend of 9 inputs, each scored 0–100. Each bar is that input's sub-score; the figure is the points it added to the 100-point composite (weight × sub-score).
- Cash flow +26.3/30.0
- ARV discount +10.7/15.0
- DSCR +8.9/10.0
- 1% rule +6.6/10.0
- Schools +4.3/10.0
- Livability +3.9/5.0
- Rent growth +2.5/5.0
- Condition / age +2.5/5.0
- Appreciation +0.0/10.0
$84,900
🖨 Deal sheet 📄 Offer letter ✓ Due diligence
Listing remarks
Charming 2-bedroom, 1.5-bath home with updates including newer siding and roof. All appliances are included for added convenience. Fresh paint and carpet throughout the interior. Enjoy outdoor living on a newer deck. This move-in ready home is being sold as-is—don’t miss your chance to make it yours. Schedule your tour today!
Key facts
- Newer roof
- Newer deck
- Newer siding
Tags
Neighborhood map
What this means for you Summary
Snapshot
- This is a 2-bed/1.0-bath single-family listed at $85k.
Deal economics
- At list price, monthly cash flow is $220 ($3k/yr) — positive.
- The deal already cash-flows at list — no discount required.
- Meets the 1% rule at list price ($983 rent vs $85k).
- Recommended offer: $82k (3.0% below list) — sets the bar for market timing.
- Cap rate 9.4% vs local median 4.5% in Marshalltown — top-decile yield for the area; either an underpriced asset or a hidden risk that comps aren't pricing in. Stress-test before assuming the spread holds.
Location & tenants
- Location reads 78/100 on livability (#133 in IA, #2,464 nationally) — a middle-class / working-renter tenant base. Strengths: commute A+, cost of living A+, housing A+; Watch: employment C-, amenities F.
- Marshalltown Community School District (town): math 50% / reading 52% proficiency, ranked #278 of 289 in IA (top 96%) — acceptable for families but not a draw, mixed tenant base, ~2y average lease; 60% free/reduced lunch — lower-income household profile, screen leases tightly.
- Market conditions: 161 active listings in the ZIP; 7 comparable units currently listed for rent nearby; rentals lingering (median 44d on market — plan ~5-8 weeks vacancy on turnover, expect pricing pressure); 100% of comp listings sitting > 30 days — soft ceiling on asking rent; 35 units permitted in Marshall County in 2024 (0 in 5+ unit buildings).
- This rent is only 17% of the median local income ($70k/yr) — well below the 30% rent-burden line; pricing power to push rent on renewal without tenant pushback.
Forward outlook
- Local home prices are declining (-3.0%/yr); year-one equity from $587 of loan paydown is wiped out by about $3k of value loss. Plan a longer hold.
- Marshall County population projected at +8% by 2050 — modest demand growth; plan on rents tracking national, not racing it.
- At projected returns (-3.0% appreciation + 3.0% rent growth), your $24k cash investment doubles in ~10 years — after that, you're playing with house money.
Negotiation context
- It's been on market 35 days — a 3% lower offer ($82k) is reasonable based on typical stale-listing flexibility.
- Current owner paid $53k; list at $85k implies a 60% gain — meaningful room to come down on a strong offer.
Questions for the listing agent
- It's been on market 35 days. Have you received any prior offers? Is the seller open to a 3% concession, seller financing, or rate buy-down credit?
- Built in 1961 — when were the roof, HVAC, electrical panel, plumbing, and water heater last replaced?
- Is there a deadline driving the sale (1031 exchange, divorce, estate, relocation)? That informs how much negotiation room exists.
- What's the average days-on-market for RENTAL listings here right now (not sales)? A rising rental-DOM trend means longer vacancies and softer asking-rent achievability than the comps imply.
- What's the recent tenant-quality profile in this submarket — average credit score on applications, eviction rate, late-payment / NSF rate, and stable-employment percentage? A property-management company in the area should have these aggregated.
- How much new for-sale + rental construction is in the pipeline within 1–3 miles? Heavy new supply typically softens prices + rents 12–24 months out; constrained supply supports both.
Investment metrics
- 1% rule
- 1.16% ✓
- Cap rate
- 9.40%
- Cash-on-cash
- 11.09%
- DSCR
- 1.49
- GRM
- 7.2
CMA / ARV
- ARV (on-the-fly)
- $91,392
- Comps found
- 12
Show comp detail 12 sales within ~0.75 mi
| Address | Dist | Beds/Ba | Sqft | Sold | Price | $/sf | Match |
|---|---|---|---|---|---|---|---|
| 512 Sharon Ave | 0.00mi | 2/1.5 | 768 (0%) | 1mo | $84,900 | $111 | 98 |
| 212 N 14th Ave | 0.24mi | 3/1.0 (+1) | 832 (+8%) | 1mo | $80,000 | $96 | 69 |
| 301 N 10th Ave | 0.33mi | 2/1.0 | 720 (-6%) | 14mo | $125,000 | $174 | 62 |
| 402 N 13th Ave | 0.17mi | 2/1.0 | 664 (-14%) | 9mo | $83,500 | $126 | 62 |
| 702 Woodbury St | 0.57mi | 2/1.0 | 800 (+4%) | 8mo | $95,000 | $119 | 59 |
| 208 N 7th Ave | 0.61mi | 2/1.5 | 749 (-2%) | 7mo | $30,530 | $41 | 59 |
| 432 Union St | 0.65mi | 2/1.0 | 748 (-3%) | 9mo | $32,000 | $43 | 58 |
| 610 Union St | 0.60mi | 2/1.0 | 704 (-8%) | 4mo | $109,000 | $155 | 55 |
| 607 Union St | 0.61mi | 2/1.0 | 720 (-6%) | 9mo | $110,000 | $153 | 53 |
| 611 N 5th Ave | 0.71mi | 1/1.0 (-1) | 752 (-2%) | 6mo | $25,000 | $33 | 53 |
| 707 Bromley St | 0.59mi | 3/1.0 (+1) | 712 (-7%) | 10mo | $118,000 | $166 | 47 |
| 715 N 5th Ave | 0.73mi | 2/1.0 | 864 (+12%) | 13mo | $38,000 | $44 | 34 |
Match score weights: distance 35% · size 25% · config 20% · recency 20%. Top-matched comps best support the ARV.
Projected returns pro-forma
-3.0% appreciation · 3.0% rent growth · sell at horizon
- IRR
- 0.3%
- Equity multiple
- 1.01×
- Total profit
- $234
- Equity at exit
- $12,659
- IRR
- 9.9%
- Equity multiple
- 1.77×
- Total profit
- $18,211
- Equity at exit
- $7,341
Cash invested: $23,772 (down + closing). Projections, not guarantees.
Landlord ↔ Tenant lean methodology
- Overall (STATE)
- 83 Strongly Landlord-Friendly
- State Iowa
- 83 Strongly Landlord-Friendly · R+6
- County
- — inherits STATE
- City
- — inherits STATE
ZIP-level market 50158
- Active inventory
- 161
- Price-to-rent
- 7.2×
Monthly cashflow live
- Estimated rent
- $983 high interval (Pro) →
- Mortgage (P&I)
- −$445
- Tax from tax record
- −$76 /mo · $914/yr
- Insurance
- −$35
- HOA
- −$0
- Vacancy / Maint / Mgmt
- −$206
- Net cashflow
- $220
Break-even live
UW: 25.0% down · 7.5% · 30yr · 1.5% tax · 5.0% vac · 8.0% maint · 8.0% mgmt
Financing live
Cash to close
- Down payment
- $21,225
- Closing costs
- $2,547
- Reserves months
- —
- Total cash needed
- —
Loan-product check · same deal, 3 products live
Conventional
25% down · 7.5% · 30yr
- Down + closing
- —
- Monthly P&I
- —
- Monthly cashflow
- —
- DSCR
- —
- Eligible?
- —
Personal DTI + credit; lowest rate.
DSCR
20% down · 8.5% · 30yr
- Down + closing
- —
- Monthly P&I
- —
- Monthly cashflow
- —
- DSCR
- —
- Eligible?
- —
No personal income docs; deal must DSCR.
Hard money
10% down · 12.0% · 12mo
- Down + closing
- —
- Monthly P&I
- —
- Monthly cashflow
- —
- DSCR
- —
- Eligible?
- —
Short-term bridge; refi at stabilization.
Rent comps 7 comps
| Address | Beds | Baths | Sqft | Rent | $/sqft | DOM | Units | Dist |
|---|---|---|---|---|---|---|---|---|
| 505 N 13th Ave Marshalltown, IA | 2.0 | 1.0 | 676 | $1,095 | $1.62 | 43d | 1 | 0.08mi |
| 201 N 2nd Ave Marshalltown, IA | 1.0 | 1.0 | 736 | $600 | $0.82 | 43d | 2 | 0.98mi |
| 511 S 7th Ave Marshalltown, IA | 2.0 | 1.0 | 784 | $738 | $0.94 | 43d | 2 | 1.16mi |
| 1 W Grant St Marshalltown, IA | 1.0 | 1.0 | 700 | $700 | $1.00 | 43d | 1 | 1.18mi |
| 605 S 7th Ave Unit 605-01 Marshalltown, IA | 2.0 | 1.0 | 784 | $700 | $0.89 | 43d | 1 | 1.18mi |
| 111 W State St Marshalltown, IA | 1.0 | 1.0 | 550 | $845 | $1.54 | 43d | 1 | 1.34mi |
| 519 N 3rd St Unit 10 Marshalltown, IA | 1.0 | 1.0 | 700 | $650 | $0.93 | 43d | 1 | 1.35mi |
Listing history 3 events
-
2026-04-27status Pending
-
2026-03-23$84,900 Active
-
2004-04-28soldstatus $53,000
ⓘ Source: listings_history table (triggers on properties + properties_extension) + one-shot
backfill from property_details.listing_events for pre-trigger history.
Tax reassessment forecast IA · Partial reset (capped growth)
- Current annual tax
- $914 · $76/mo
- Projected year-2 tax
- $1,123 · $94/mo
- Expected delta
- +$209/yr (+$17/mo · 22.9%)
ⓘ Screening estimate from a state-policy table — verify with the county assessor before closing.
Climate risk First Street
- Flood 1/10 Low FEMA zone X · 0% chance over 30 yrs
- Wildfire 4/10 Moderate
- Heat 3/10 Moderate 7 d/yr ≥104°F today · 15 d/yr by 30 yrs out
- Wind 2/10 Low
- Air quality 1/10 Low 0 unhealthy d/yr today · 0 by 30 yrs out
Nearby sold comps map
Loading sold comps map…
Walkable amenities ~0.75 mi
Loading nearby amenities…
Taxation est. · year 1
- Rental income
- $11,795
- − Mortgage interest
- −$4,756
- − Property taxes
- −$914
- − Insurance
- −$424
- − Repairs & maintenance
- −$944
- − Management
- −$944
- − Depreciation
- −$2,470
- Taxable income
- $1,344
- Est. tax owed @ 24.0%
- −$323
- After-tax cash flow
- $2,314/yr
For passive investors: Depreciation is non-cash, so a rental often shows a tax loss while cash-flowing — sheltering income. Rental losses are passive: they offset passive income freely, and up to $25,000/yr can offset ordinary (W-2) income if you actively participate and your MAGI is under $100k (phasing out to $0 by $150k); unused losses carry forward. On sale, claimed depreciation is recaptured at up to 25%, and gains may owe capital-gains tax (a 1031 exchange can defer both). Figures are a year-1 estimate at your 24.0% rate — not tax advice; consult a CPA.
Schools (NCES district)
- District
- Marshalltown Community School District
- NCES district ID
- 1918720
- Math proficiency
- 50% ▼ -8.00%
- Reading proficiency
- 52% ▬ 0.00%
- Median HH income
- $47,877
- Composite
- 43.41/100
- National rank
- #3015
- State rank
- #278 of 289 in IA
Livability — Marshalltown
- Score
- 78/100
- State rank
- #133
- US rank
- #2464
Category grades
Schools grade is shown separately in the Schools card above.
Census & demographics
- Census place
- Marshalltown, IA
- County
- Marshall County · 31,396 people
- City population
- 31,396
- Metro
- Marshalltown, IA
- Population (ZIP)
- 31,396
- Household income
- $70,367
- Rent vs Own
- Severe rent burden
- 369.0
Population outlook (Marshall County) Hauer SSP2
- Today (2025)
- 41,166 people
- By 2030
- 41,477 · +0.8%
- By 2040
- 42,548 · +3.4%
- By 2050
- 44,472 · +8.0%
- By 2075
- 52,719 · +28.1%
- By 2100
- 60,912 · +48.0%
Race, ethnicity, and origin ACS 2023
- Neighborhood character
- Majority White (60%)
- Race & ethnicity
- White 60% Hispanic / Latino 30% Two or more races 14% Asian 5% Black 2% Native American 1%
- Hispanic origin (detail)
- Mexican 25%
- Common ancestry
- Portuguese 3% Italian 2% Iranian 1%
- Foreign-born
- 17% · Canada, Philippines, China
- Languages at home
- 71% English-only · Spanish 24% Other Asian/Pacific 4% French/Haitian/Cajun 1%
Political lean MEDSL · Marshall
- 2024 margin
- R (+15.6) · D 41.4% · R 57.0% · Other 1.6%
- 2008→2024 swing
- -24.9pp toward R · 2008: 9.3pp · 2024: -15.6pp
- All cycles
- 2024: R+15.6 2020: R+7.7 2016: R+8.5 2012: D+8.9 2008: D+9.3
Not yet ingested
- Civics
- —
Market trends
- HPI YoY
- ▼ -161.80%
- Current HPI
- 177.4692
- Rent YoY
- —
- Metro
- Marshalltown, IA
- State GDP YoY
- ▲ 2.48%
- F500 in state
- 4
Industry mix (Fortune 500 HQ in IA)
| Industry | F500 HQs | Revenue |
|---|---|---|
| Financial Services | 1 | $16B |
|
||
| Retail / Convenience | 1 | $15B |
|
||
Price history
+60.2% since first listed3 events — show timeline
- 2026-04-27 Pending — IAR
- 2026-03-23 Listed $84,900 IAR
- 2004-04-28 Sold (Public Records) $53,000 Public Records
Property tax history
+0.3%/yrLatest (2025): $914 · +9.3% YoY. Source: county tax records.
Cash-flow waterfall
monthlySold comps — $/sqft
last 12 mo · ≤1 miLoading sold comps…