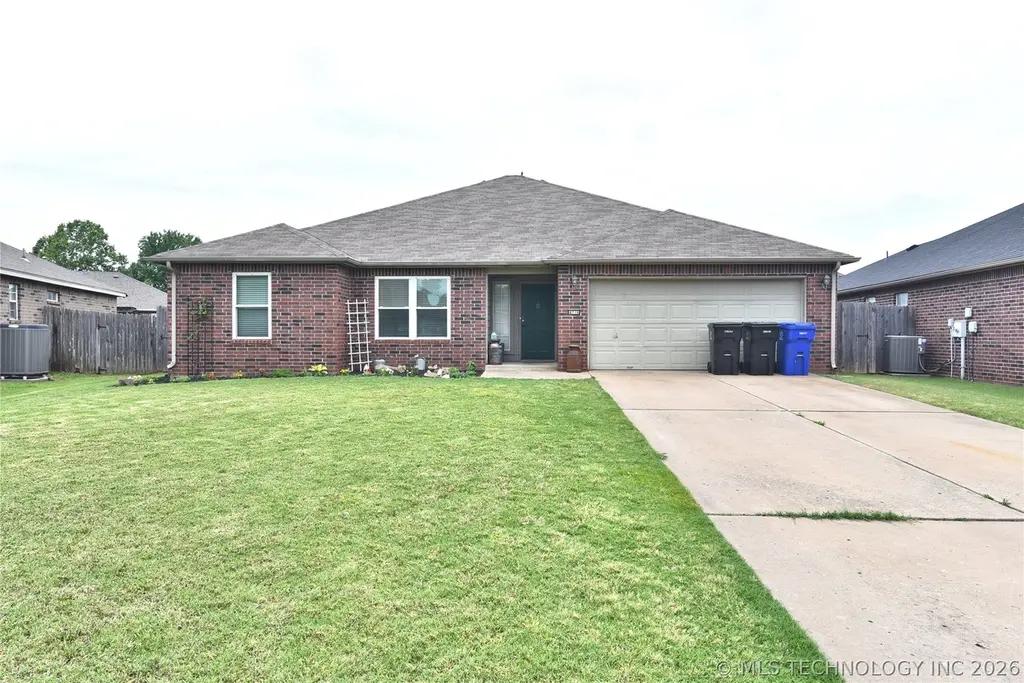
4716 S 197th EastAvenue · Broken Arrow, OK
Flood risk 1/10 · Minimal
- FEMA flood zone
- X (unshaded)
- Chance of flooding over 30 yrs
- 0.0%
- Est. flood insurance / yr
- $507 – $1,088
Fire risk 4/10 · Minor
- Est. fire insurance / yr
- $2,463 – $4,575
Heat risk 7/10 · Major
- Hot days now (above 110°F)
- 7 days/yr
- Hot days in 30 yrs
- 20 days/yr
Wind risk 3/10 · Minor
- Chance of severe wind over 30 yrs
- 4.0%
Air-quality risk 2/10 · Minimal
- Unhealthy air days now
- 1 days/yr
- Unhealthy air days in 30 yrs
- 1 days/yr
Risk factors via First Street. Map © Google.
Why this score? — see what drove the D+ grade
The composite is a weighted blend of 9 inputs, each scored 0–100. Each bar is that input's sub-score; the figure is the points it added to the 100-point composite (weight × sub-score).
- ARV discount +15.0/15.0
- Cash flow +13.4/30.0
- DSCR +4.0/10.0
- Livability +3.9/5.0
- 1% rule +3.3/10.0
- Rent growth +3.0/5.0
- Condition / age +2.5/5.0
- Schools +2.4/10.0
- Appreciation +0.0/10.0
$269,500
🖨 Deal sheet 📄 Offer letter ✓ Due diligence
Listing remarks MLS
Gorgeous up to date home w/ beautiful dark wood floors. Wall of windows in family room w/ fireplace. Open kitchen w/ walk-in pantry & tiled floors. Split floor plan. Storm shelter, full guttering, security system. Cute entry. Extra long driveway.
Key facts
- Split floor plan
- Large backyard
- Covered patio
Tags
Property features AI
Finance
- HOA & community: Homeowners association with annual fee of $110; Community park
Exterior
- Parking: Attached 2-car garage
- Security: Storm shelter; Owned security system; Smoke detectors
- Utilities: Cable available; Electricity available; Fiber optic available; Natural gas available; Phone available; Water available; Rural sewer; Rural water
- Home design: Single-story home; Faces east; Slab foundation
- Construction: Built with brick and wood frame; Asphalt/fiberglass roof; Home warranty included
- Exterior features: Covered patio and porch; Porch; Rain gutters; Full privacy fencing; Storm shelter; Owned security system; Smoke detectors
Interior
- Kitchen: Kitchen with breakfast nook and pantry; Dishwasher; Microwave; Oven; Range/Stove; Refrigerator; Disposal; Electric water heater
- Bedrooms: Master bedroom with walk-in closet (First floor); Additional bedrooms (First floor)
- Flooring: Carpet; Tile; Wood
- Bathrooms: Master bath with double sink, separate shower, full bath and whirlpool; Total of 2 full bathrooms
- Heating & cooling: Central heating (electric); Central air conditioning
- Interior features: Attic; Ceramic counters; Laminate counters; High ceilings; High-speed internet; Cable TV; Wired for data; Ceiling fan(s); Electric oven/range connection; Gas oven/range connection; Aluminum window frames
- Laundry & utility: Washer hookup; Electric dryer hookup; Utility room (First floor)
Neighborhood map
What this means for you Summary
Snapshot
- This is a 4-bed/2.0-bath single-family listed at $270k.
Deal economics
- At list price, monthly cash flow is $3 ($30/yr) — positive.
- The deal already cash-flows at list — no discount required.
- To meet the 1% rule (rent ≥ 1% of price), the offer needs to be $222k (17.5% below list).
- Recommended offer: $222k (17.5% below list) — sets the bar for 1% rule.
- Cap rate 6.3% vs local median 4.0% in Broken Arrow — top-decile yield for the area; either an underpriced asset or a hidden risk that comps aren't pricing in. Stress-test before assuming the spread holds.
Location & tenants
- Location reads 78/100 on livability (#7 in OK, #2,691 nationally) — a middle-class / working-renter tenant base. Strengths: commute A+, cost of living A+, housing A+; Watch: schools D+, amenities F.
- Broken Arrow (suburban): math 23% / reading 28% proficiency, ranked #79 of 270 in OK (top 29%) — low school quality limits family demand, transient renter base, plan for 1-2y turnover.
- Market conditions: Rents rising (+2.1%/yr); 652 active listings in the ZIP; 4 comparable units currently listed for rent nearby; rentals at typical pace (median 19d on market — plan ~3-4 weeks tenant-placement turnaround); solid renter incomes; 581 units permitted in Wagoner County in 2024 (0 in 5+ unit buildings).
Forward outlook
- Local home prices are declining (-3.0%/yr); year-one equity from $2k of loan paydown is wiped out by about $8k of value loss. Plan a longer hold.
- Wagoner County population projected at +16% by 2050 — long-run rental-demand tailwind backs the buy-and-hold thesis.
Negotiation context
- It's been on market 21 days — a 2% lower offer ($265k) is reasonable based on typical stale-listing flexibility.
- 5 sale attempts since 27y ago with the ask held roughly flat each time — persistent listings suggest the price (not the market) is what's stuck; bring a comps-based counter.
- Current owner paid $157k; list at $270k implies a 72% gain — meaningful room to come down on a strong offer.
Risks & watch-outs
- Climate carrying-cost: extreme-heat days projected 7→20/yr by 2055 (HVAC capex compounding) — expect insurance premiums to compound above CPI over the hold.
Questions for the listing agent
- What does the HOA fee cover, when was the last increase, and are there any pending special assessments or reserve-fund shortfalls?
- Is there a deadline driving the sale (1031 exchange, divorce, estate, relocation)? That informs how much negotiation room exists.
- Schools are D-rated, which usually means shorter tenancies and higher turnover. Who's the typical renter profile here, and what's been the actual vacancy rate?
- The area grade is low — what's the realistic commute time and amenity access for the typical tenant pool here? Any planned neighborhood developments (good or bad) we should know about?
- What's the average days-on-market for RENTAL listings here right now (not sales)? A rising rental-DOM trend means longer vacancies and softer asking-rent achievability than the comps imply.
- What's the recent tenant-quality profile in this submarket — average credit score on applications, eviction rate, late-payment / NSF rate, and stable-employment percentage? A property-management company in the area should have these aggregated.
- How much new for-sale + rental construction is in the pipeline within 1–3 miles? Heavy new supply typically softens prices + rents 12–24 months out; constrained supply supports both.
Investment metrics
- 1% rule
- 0.83% ✗
- Cap rate
- 6.30%
- Cash-on-cash
- 0.04%
- DSCR
- 1.00
- GRM
- 10.1
CMA / ARV
- ARV (on-the-fly)
- $325,890
- Comps found
- 12
Show comp detail 12 sales within ~0.75 mi
| Address | Dist | Beds/Ba | Sqft | Sold | Price | $/sf | Match |
|---|---|---|---|---|---|---|---|
| 19820 E 45th St S | 0.17mi | 3/2.0 (-1) | 2,093 (-2%) | 2mo | $300,000 | $143 | 83 |
| 4425 S 199th East Ave | 0.24mi | 3/2.0 (-1) | 2,219 (+4%) | 1mo | $285,000 | $128 | 76 |
| 20382 E 49th St S | 0.46mi | 4/2.0 | 2,058 (-3%) | 1mo | $316,000 | $154 | 72 |
| 4757 S 202nd EastAvenue | 0.35mi | 3/2.0 (-1) | 2,030 (-5%) | 0mo | $309,000 | $152 | 71 |
| 19826 E 46th St S | 0.16mi | 4/2.0 | 1,840 (-14%) | 0mo | $315,000 | $171 | 70 |
| 4842 S 187th EastAvenue | 0.64mi | 3/2.0 (-1) | 2,133 (+0%) | 1mo | $326,000 | $153 | 64 |
| 20496 E 47th St S | 0.54mi | 3/2.0 (-1) | 1,991 (-6%) | 0mo | $305,000 | $153 | 59 |
| 18628 E 42nd Pl S | 0.69mi | 3/2.5 (-1) | 2,153 (+1%) | 1mo | $380,000 | $176 | 58 |
| 4917 S 190th East Ave | 0.42mi | 3/2.0 (-1) | 1,915 (-10%) | 2mo | $287,000 | $150 | 57 |
| 20200 E 43rd St S | 0.51mi | 3/2.0 (-1) | 1,921 (-10%) | 2mo | $282,000 | $147 | 53 |
| 18627 E 44th St | 0.61mi | 4/3.0 | 2,352 (+10%) | 2mo | $420,000 | $179 | 48 |
| 3526 E Sandusky St | 0.66mi | 3/2.0 (-1) | 1,904 (-11%) | 1mo | $285,000 | $150 | 46 |
Match score weights: distance 35% · size 25% · config 20% · recency 20%. Top-matched comps best support the ARV.
Projected returns pro-forma
-3.0% appreciation · 2.12% rent growth · sell at horizon
- IRR
- -17.2%
- Equity multiple
- 0.40×
- Total profit
- $-45,495
- Equity at exit
- $40,183
- IRR
- -10.8%
- Equity multiple
- 0.37×
- Total profit
- $-47,413
- Equity at exit
- $23,301
Cash invested: $75,460 (down + closing). Projections, not guarantees.
Landlord ↔ Tenant lean methodology
- Overall (STATE)
- 83 Strongly Landlord-Friendly
- State Oklahoma
- 83 Strongly Landlord-Friendly · R+20
- County
- — inherits STATE
- City
- — inherits STATE
ZIP-level market 74014
- Rents YoY
- 2.1%
- Active inventory
- 652
- Price-to-rent
- 10.1×
Monthly cashflow live
- Estimated rent
- $2,224 medium interval (Pro) →
- Mortgage (P&I)
- −$1,413
- Tax from tax record
- −$220 /mo · $2,643/yr
- Insurance
- −$112
- HOA
- −$9
- Vacancy / Maint / Mgmt
- −$467
- Net cashflow
- $3
Break-even live
UW: 25.0% down · 7.5% · 30yr · 1.5% tax · 5.0% vac · 8.0% maint · 8.0% mgmt
Financing live
Cash to close
- Down payment
- $67,375
- Closing costs
- $8,085
- Reserves months
- —
- Total cash needed
- —
Loan-product check · same deal, 3 products live
Conventional
25% down · 7.5% · 30yr
- Down + closing
- —
- Monthly P&I
- —
- Monthly cashflow
- —
- DSCR
- —
- Eligible?
- —
Personal DTI + credit; lowest rate.
DSCR
20% down · 8.5% · 30yr
- Down + closing
- —
- Monthly P&I
- —
- Monthly cashflow
- —
- DSCR
- —
- Eligible?
- —
No personal income docs; deal must DSCR.
Hard money
10% down · 12.0% · 12mo
- Down + closing
- —
- Monthly P&I
- —
- Monthly cashflow
- —
- DSCR
- —
- Eligible?
- —
Short-term bridge; refi at stabilization.
Rent comps 4 comps
| Address | Beds | Baths | Sqft | Rent | $/sqft | DOM | Units | Dist |
|---|---|---|---|---|---|---|---|---|
| 20241 E 43rd Pl S Broken Arrow, OK | 4.0 | 2.0 | 1746 | $2,028 | $1.16 | 1d | 1 | 0.51mi |
| 4915 N 36th St Broken Arrow, OK | 4.0 | 2.0 | 1739 | $1,940 | $1.12 | 19d | 1 | 0.86mi |
| 3503 E Hudson St Unit (3503) Broken Arrow, OK | 4.0 | 2.0 | 1996 | $1,495 | $0.75 | 1d | 1 | 1.05mi |
| 4509 S 177th East Pl Unit Labs Tulsa, OK | 3.0 | 2.0 | 1977 | $2,800 | $1.42 | 23d | 1 | 1.16mi |
HOA detail
- Monthly dues
- $9 · $108/yr
- Likely covers
- security
Listing history 28 events
-
2026-06-18days on market $269,500 Active 21 DOM
-
2026-06-17days on market $269,500 Active 20 DOM
-
2026-06-16days on market $269,500 Active 19 DOM
-
2026-06-15days on market $269,500 Active 18 DOM
-
2026-06-13days on market $269,500 Active 16 DOM
-
2026-06-10days on market $269,500 Active 13 DOM
-
2026-06-09days on market $269,500 Active 12 DOM
-
2026-06-08days on market $269,500 Active 11 DOM
-
2026-06-07days on market $269,500 Active 10 DOM
-
2026-06-05days on market $269,500 Active 7 DOM
-
2026-06-03days on market $269,500 Active 6 DOM
-
2026-06-02days on market $269,500 Active 5 DOM
-
2026-06-01days on market $269,500 Active 4 DOM
-
2026-05-31days on market $269,500 Active 3 DOM
-
2026-05-27$269,500 Active
-
2008-09-04soldstatus $157,000
-
2008-08-29soldstatus $157,000 252-char remark
Show marketing remark (252 chars)
Gorgeous up to date home w/ beautiful dark wood floors. Wall of windows in family room w/ fireplace. Open kitchen w/ walk-in pantry & tiled floors. Split floor plan. Storm shelter, full guttering, security system. Cute entry. Extra long driveway.
-
2008-08-07historical 252-char remark
Show marketing remark (252 chars)
Gorgeous up to date home w/ beautiful dark wood floors. Wall of windows in family room w/ fireplace. Open kitchen w/ walk-in pantry & tiled floors. Split floor plan. Storm shelter, full guttering, security system. Cute entry. Extra long driveway.
-
2008-07-29historical
-
2008-07-28$155,000 252-char remark
Show marketing remark (252 chars)
Gorgeous up to date home w/ beautiful dark wood floors. Wall of windows in family room w/ fireplace. Open kitchen w/ walk-in pantry & tiled floors. Split floor plan. Storm shelter, full guttering, security system. Cute entry. Extra long driveway.
-
2008-01-22$155,000
-
2005-02-16soldstatus $140,000
-
2005-02-09soldstatus $139,900
-
2005-01-24historical
-
2005-01-13$139,900
-
1999-12-21soldstatus $124,030
-
1999-12-08historical
-
1999-12-06$124,030
ⓘ Source: listings_history table (triggers on properties + properties_extension) + one-shot
backfill from property_details.listing_events for pre-trigger history.
Tax reassessment forecast OK · Resets to sale price
- Current annual tax
- $2,643 · $220/mo
- Projected year-2 tax
- $2,643 · $220/mo
- Expected delta
- $0/yr ($0/mo · 0.0%)
ⓘ Screening estimate from a state-policy table — verify with the county assessor before closing.
Climate risk First Street
- Flood 1/10 Low FEMA zone X (unshaded) · 0% chance over 30 yrs
- Wildfire 4/10 Moderate
- Heat 7/10 Severe 7 d/yr ≥110°F today · 20 d/yr by 30 yrs out
- Wind 3/10 Moderate 4% chance of damaging wind over 30 yrs
- Air quality 2/10 Low 1 unhealthy d/yr today · 1 by 30 yrs out
Nearby sold comps map
Loading sold comps map…
Walkable amenities ~0.75 mi
Loading nearby amenities…
Taxation est. · year 1
- Rental income
- $26,694
- − Mortgage interest
- −$15,096
- − Property taxes
- −$2,643
- − Insurance
- −$1,348
- − Repairs & maintenance
- −$2,136
- − Management
- −$2,136
- − HOA
- −$108
- − Depreciation
- −$7,840
- Taxable loss
- −$4,612
- Est. tax savings @ 24.0%
- +$1,107
- After-tax cash flow
- $1,137/yr
For passive investors: Depreciation is non-cash, so a rental often shows a tax loss while cash-flowing — sheltering income. Rental losses are passive: they offset passive income freely, and up to $25,000/yr can offset ordinary (W-2) income if you actively participate and your MAGI is under $100k (phasing out to $0 by $150k); unused losses carry forward. On sale, claimed depreciation is recaptured at up to 25%, and gains may owe capital-gains tax (a 1031 exchange can defer both). Figures are a year-1 estimate at your 24.0% rate — not tax advice; consult a CPA.
Schools (NCES district)
- District
- Broken Arrow
- NCES district ID
- 4005490
- Math proficiency
- 23% ▼ -9.00%
- Reading proficiency
- 28% ▼ -9.00%
- Median HH income
- $64,646
- Composite
- 23.86/100
- National rank
- #7801
- State rank
- #79 of 270 in OK
Livability — Broken Arrow
- Score
- 78/100
- State rank
- #7
- US rank
- #2691
Category grades
Schools grade is shown separately in the Schools card above.
Census & demographics
- Census place
- Broken Arrow, OK
- County
- Wagoner County · 61,834 people
- City population
- 144,172
- Metro
- Tulsa, OK
- Population (ZIP)
- 45,212
- Household income
- $95,501
- Rent vs Own
- Severe rent burden
- 289.0
Population outlook (Wagoner County) Hauer SSP2
- Today (2025)
- 84,796 people
- By 2030
- 88,162 · +4.0%
- By 2040
- 93,882 · +10.7%
- By 2050
- 98,219 · +15.8%
- By 2075
- 106,561 · +25.7%
- By 2100
- 109,360 · +29.0%
Race, ethnicity, and origin ACS 2023
- Neighborhood character
- Predominantly White (69%)
- Race & ethnicity
- White 69% Two or more races 11% Hispanic / Latino 11% Native American 6% Asian 4% Black 3%
- Hispanic origin (detail)
- Mexican 8%
- Common ancestry
- Italian 2% Slovak 2% Lithuanian 2%
- Foreign-born
- 7% · Canada
- Languages at home
- 89% English-only · Spanish 7% Other Asian/Pacific 2% Russian/Polish/Slavic 1%
Political lean MEDSL · Wagoner
- 2024 margin
- Solid R (+49.8) · D 24.2% · R 74.0% · Other 1.8%
- 2008→2024 swing
- -8.0pp toward R · 2008: -41.8pp · 2024: -49.8pp
- All cycles
- 2024: R+49.8 2020: R+50.1 2016: R+52.0 2012: R+45.7 2008: R+41.8
Not yet ingested
- Civics
- —
Market trends
- HPI YoY
- ▼ -206.67%
- Current HPI
- 203.7301
- Rent YoY
- ▲ 2.12%
- Metro
- Tulsa, OK
- State GDP YoY
- ▲ 1.55%
- F500 in state
- 6
Industry mix (Fortune 500 HQ in OK)
| Industry | F500 HQs | Revenue |
|---|---|---|
| Energy | 3 | $48B |
|
||
Price history
+117.3% since first listed14 events — show timeline
- 2026-05-27 Listed $269,500 MLS Technology, Inc.
- 2008-09-04 Sold (Public Records) $157,000 Public Records
- 2008-08-29 Sold (MLS) $157,000 MLS Technology, Inc.
- 2008-08-07 Listing Removed — MLS Technology, Inc.
- 2008-07-29 Listing Removed — MLS Technology, Inc.
- 2008-07-28 Listed $155,000 MLS Technology, Inc.
- 2008-01-22 Listed $155,000 MLS Technology, Inc.
- 2005-02-16 Sold (Public Records) $140,000 Public Records
- 2005-02-09 Sold (MLS) $139,900 MLS Technology, Inc.
- 2005-01-24 Listing Removed — MLS Technology, Inc.
- 2005-01-13 Listed $139,900 MLS Technology, Inc.
- 1999-12-21 Sold (MLS) $124,030 MLS Technology, Inc.
- 1999-12-08 Listing Removed — MLS Technology, Inc.
- 1999-12-06 Listed $124,030 MLS Technology, Inc.
Property tax history
+2.8%/yrLatest (2025): $2,643 · -2.9% YoY. Source: county tax records.
Cash-flow waterfall
monthlySold comps — $/sqft
last 12 mo · ≤1 miLoading sold comps…