 Multi-family
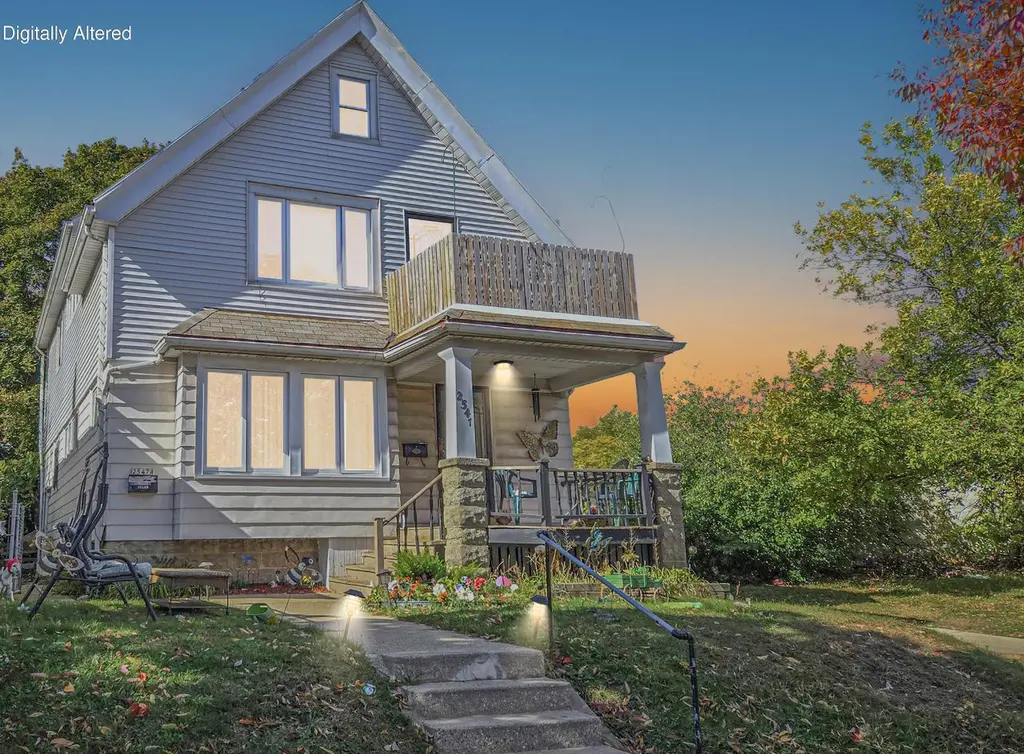
2547 N 56th St Unit 2547A · Milwaukee, WI
Flood risk 1/10 · Minimal
- FEMA flood zone
- X (unshaded)
- Chance of flooding over 30 yrs
- 0.0%
- Est. flood insurance / yr
- $507 – $1,088
Fire risk 1/10 · Minimal
- Est. fire insurance / yr
- $636 – $1,182
Heat risk 2/10 · Minimal
- Hot days now (above 99°F)
- 7 days/yr
- Hot days in 30 yrs
- 13 days/yr
Wind risk 2/10 · Minimal
- Chance of severe wind over 30 yrs
- —
Air-quality risk 2/10 · Minimal
- Unhealthy air days now
- 2 days/yr
- Unhealthy air days in 30 yrs
- 2 days/yr
Risk factors via First Street. Map © Google.
Why this score? — see what drove the B- grade
The composite is a weighted blend of 9 inputs, each scored 0–100. Each bar is that input's sub-score; the figure is the points it added to the 100-point composite (weight × sub-score).
- Cash flow +28.1/30.0
- ARV discount +10.7/15.0
- DSCR +10.0/10.0
- 1% rule +7.7/10.0
- Livability +4.0/5.0
- Condition / age +3.8/5.0
- Rent growth +3.5/5.0
- Schools +1.2/10.0
- Appreciation +0.0/10.0
$172,900
🖨 Deal sheet (PDF) 📄 Offer letter ✓ Due diligence
Multi-family units
County records classify this as Multi-Family (2-4 Unit). Listing-text estimate: 1 unit. estimate disagrees with records
Listing remarks MLS
Affordable first home or excellent investment opportunity. Almost $22,000 in annual rental income with room to grow! Hardwood floors. Large eat-in kitchens. Formal dining rooms. And a private backyard. Rooms sizes are not verified and are approximate.
Key facts
- Private backyard
- Formal dining rooms
- Hardwood floors
Tags
Property features AI
Finance
- Other: Property listed as multi-family (2 units)
Exterior
- Parking: Detached 2-car garage
- Utilities: Municipal water; Municipal sewer; 2 electric meters; 2 gas meters
- Home design: Two-story duplex; Multi-family property
- Construction: Public record for year built (assessor/public record)
- Exterior features: Aluminum/steel, aluminum, vinyl, and wood exterior materials; Lot under 1/2 acre (approximately 0.08 acre); Zoned RS6
Interior
- Kitchen: Unit 2 kitchen located on upper level
- Bedrooms: Unit 1: 2 bedrooms; Unit 2: 2 bedrooms (master and second bedroom on upper level)
- Bathrooms: Unit 1: 1 full bathroom; Unit 2: 1 full bathroom
- Interior features: Full block basement
- Laundry & utility: Separate electric meters for each unit; Separate gas meters for each unit
Neighborhood map
What this means for you Summary
Snapshot
- This is a 4-bed/2.0-bath multifamily listed at $173k. Condition is rated good.
Deal economics
- At list price, monthly cash flow is $542 ($7k/yr) — positive.
- The deal already cash-flows at list — no discount required.
- Meets the 1% rule at list price ($2k rent vs $173k).
- Recommended offer: $168k (3.0% below list) — sets the bar for market timing.
- Cap rate 10.1% vs local median 5.1% in Milwaukee — top-decile yield for the area; either an underpriced asset or a hidden risk that comps aren't pricing in. Stress-test before assuming the spread holds.
Location & tenants
- Location reads 81/100 on livability (#55 in WI, #1,534 nationally) — a professional / high-income tenant draw. Strengths: amenities A+, commute A+, cost of living A+; Watch: employment D+, schools F, crime F.
- Milwaukee School District (urban): math 10% / reading 18% proficiency, ranked #337 of 342 in WI (top 98%) — low school quality limits family demand, transient renter base, plan for 1-2y turnover; 77% free/reduced lunch — lower-income household profile, screen leases tightly.
- Market conditions: Rents rising (+3.8%/yr); 144 active listings in the ZIP; 11 comparable units currently listed for rent nearby; rentals at typical pace (median 18d on market — plan ~3-4 weeks tenant-placement turnaround); 1,017 units permitted in Milwaukee County in 2024 (803 in 5+ unit buildings).
- At $2,199/mo this rent would consume 55% of the median local household income ($48k/yr) (locally 1730% of renters already pay >50% of income on rent) — very limited rent-growth headroom before tenants either downsize or default.
Forward outlook
- Local home prices are declining (-3.0%/yr); year-one equity from $1k of loan paydown is wiped out by about $5k of value loss. Plan a longer hold.
- Milwaukee County population projected at +4% by 2050 — modest demand growth; plan on rents tracking national, not racing it.
- At projected returns (-3.0% appreciation + 3.8% rent growth), your $48k cash investment doubles in ~8 years — after that, you're playing with house money.
Negotiation context
- It's been on market 54 days — a 3% lower offer ($168k) is reasonable based on typical stale-listing flexibility.
- 2 sale attempts with the ask held roughly flat each time — persistent listings suggest the price (not the market) is what's stuck; bring a comps-based counter.
Risks & watch-outs
- Watch-outs: built in 1926 — expect roof / HVAC / electrical / plumbing capex.
Questions for the listing agent
- It's been on market 54 days. Have you received any prior offers? Is the seller open to a 3% concession, seller financing, or rate buy-down credit?
- Built in 1926 — when were the roof, HVAC, electrical panel, plumbing, and water heater last replaced?
- Is there a deadline driving the sale (1031 exchange, divorce, estate, relocation)? That informs how much negotiation room exists.
- Schools are F-rated, which usually means shorter tenancies and higher turnover. Who's the typical renter profile here, and what's been the actual vacancy rate?
- Crime grade is F in this area — have there been break-ins, vandalism, or insurance claims at this property in the last 3 years? What carrier currently insures it and at what premium?
- What's the average days-on-market for RENTAL listings here right now (not sales)? A rising rental-DOM trend means longer vacancies and softer asking-rent achievability than the comps imply.
- What's the recent tenant-quality profile in this submarket — average credit score on applications, eviction rate, late-payment / NSF rate, and stable-employment percentage? A property-management company in the area should have these aggregated.
- How much new apartment / multifamily construction is in the pipeline within 1–3 miles? Heavy new supply (>2% of stock underway) typically softens rents 12–24 months out; light construction supports rent growth.
Investment metrics
- 1% rule
- 1.27% ✓
- Cap rate
- 10.06%
- Cash-on-cash
- 13.44%
- DSCR
- 1.60
- GRM
- 6.6
CMA / ARV
- ARV (median comp)
- $185,988
- List price
- $172,900
- Delta
- -7.04%
- Verdict
- FAIR
- Comps
- 20 within 1.0 mi
Show comp detail 12 sales within ~0.75 mi
| Address | Dist | Beds/Ba | Sqft | Sold | Price | $/sf | Match |
|---|---|---|---|---|---|---|---|
| 2639 N 55th St | 0.12mi | 4/2.0 | 1,877 (+7%) | 2mo | $120,000 | $64 | 80 |
| 2818 N 55th St Unit 2818A | 0.35mi | 4/2.0 | 1,825 (+4%) | 4mo | $208,000 | $114 | 73 |
| 2726 N 56th St Unit 2726A | 0.23mi | 4/2.0 | 1,934 (+10%) | 3mo | $155,000 | $80 | 70 |
| 2969 N 56th St Unit 2969A | 0.54mi | 4/2.0 | 1,742 (-1%) | 7mo | $137,500 | $79 | 68 |
| 2844 N 57th St Unit 2844A | 0.38mi | 4/2.0 | 1,867 (+7%) | 7mo | $150,000 | $80 | 66 |
| 2977 N 61st St | 0.62mi | 4/2.0 | 1,710 (-2%) | 4mo | $180,000 | $105 | 64 |
| 3034 N 60th St #3036 | 0.65mi | 4/2.0 | 1,632 (-7%) | 0mo | $163,000 | $100 | 58 |
| 2973 N 58th St #2975 | 0.56mi | 4/2.0 | 1,878 (+7%) | 7mo | $160,000 | $85 | 56 |
| 1900 N 55th St Unit 1900A | 0.70mi | 3/2.0 (-1) | 1,802 (+3%) | 7mo | $225,000 | $125 | 52 |
| 3031 N 60th St | 0.65mi | 4/2.0 | 1,990 (+14%) | 1mo | $215,000 | $108 | 46 |
| 1847 N 56th St | 0.70mi | 4/2.0 | 1,939 (+11%) | 7mo | $349,900 | $180 | 44 |
| 2808 N Sholes Ave Unit 2808A | 0.62mi | 3/2.0 (-1) | 2,000 (+14%) | 8mo | $307,250 | $154 | 36 |
Match score weights: distance 35% · size 25% · config 20% · recency 20%. Top-matched comps best support the ARV.
Projected returns pro-forma
-3.0% appreciation · 3.82% rent growth · sell at horizon
- IRR
- 4.4%
- Equity multiple
- 1.17×
- Total profit
- $8,387
- Equity at exit
- $25,780
- IRR
- 14.7%
- Equity multiple
- 2.23×
- Total profit
- $59,547
- Equity at exit
- $14,949
Cash invested: $48,412 (down + closing). Projections, not guarantees.
Landlord ↔ Tenant lean methodology
- Overall (STATE)
- 73 Landlord-Friendly
- State Wisconsin
- 73 Landlord-Friendly · R+2
- County
- — inherits STATE
- City
- — inherits STATE
ZIP-level market 53210
- Home prices YoY
- -21.5%
- Rents YoY
- 3.8%
- Active inventory
- 144
- Price-to-rent
- 13.1×
Monthly cashflow live
- Estimated rent
- $2,199 high interval (Pro) →
- Mortgage (P&I)
- −$907
- Tax est. 1.5%
- −$216 /mo · $2,594/yr
- Insurance
- −$72
- HOA
- −$0
- Vacancy / Maint / Mgmt
- −$462
- Net cashflow
- $542
Break-even live
Sensitivity live
| Price | -10% $662 | -5% $602 | +0% $542 | +5% $483 | +10% $423 |
|---|---|---|---|---|---|
| Rent | -10% $369 | -5% $455 | +0% $542 | +5% $629 | +10% $716 |
| Rate | -1.0pp $629 | -0.5pp $586 | base $542 | +0.5pp $498 | +1.0pp $452 |
2-unit breakdown (identical units grouped — click to expand)
| Units | Beds | Baths | Est. rent |
|---|---|---|---|
| 2× units | 2 | 1 | $2,198 |
| #1 | 2 | 1 | $1,099 |
| #2 | 2 | 1 | $1,099 |
| Total (2 units) | $2,199 | ||
UW: 25.0% down · 7.5% · 30yr · 1.5% tax · 5.0% vac · 8.0% maint · 8.0% mgmt
Financing live
Cash to close
- Down payment
- $43,225
- Closing costs
- $5,187
- Reserves months
- —
- Total cash needed
- —
Loan-product check · same deal, 3 products live
Conventional
25% down · 7.5% · 30yr
- Down + closing
- —
- Monthly P&I
- —
- Monthly cashflow
- —
- DSCR
- —
- Eligible?
- —
Personal DTI + credit; lowest rate.
DSCR
20% down · 8.5% · 30yr
- Down + closing
- —
- Monthly P&I
- —
- Monthly cashflow
- —
- DSCR
- —
- Eligible?
- —
No personal income docs; deal must DSCR.
Hard money
10% down · 12.0% · 12mo
- Down + closing
- —
- Monthly P&I
- —
- Monthly cashflow
- —
- DSCR
- —
- Eligible?
- —
Short-term bridge; refi at stabilization.
Rent comps 11 comps
| Address | Beds | Baths | Sqft | Rent | $/sqft | DOM | Units | Dist |
|---|---|---|---|---|---|---|---|---|
| 2438 N 51st St Unit 2 Milwaukee, WI | 3.0 | 1.0 | 1300 | $1,650 | $1.27 | 24d | 1 | 0.31mi |
| 2629 N 50th St Unit Upper Milwaukee, WI | 3.0 | 1.0 | 1258 | $1,375 | $1.09 | 4d | 1 | 0.35mi |
| 2409 N 49th St Milwaukee, WI | 3.0 | 1.0 | 1335 | $1,248 | $0.93 | 44d | 1 | 0.42mi |
| 2137 N 47th St Milwaukee, WI | 5.0 | 2.0 | 1723 | $1,850 | $1.07 | 15d | 1 | 0.71mi |
| 2976 N 49th St Milwaukee, WI | 3.0 | 1.0 | 1700 | $1,300 | $0.76 | 18d | 1 | 0.72mi |
| 2713 N 44th St Milwaukee, WI | 3.0 | 1.0 | 1450 | $1,350 | $0.93 | 44d | 1 | 0.74mi |
| 3155 N 52nd St Milwaukee, WI | 3.0 | 2.0 | 1300 | $1,400 | $1.08 | 44d | 1 | 0.82mi |
| 3123 N 42nd St Milwaukee, WI | 4.0 | 1.0 | 1500 | $1,700 | $1.13 | 24d | 1 | 1.14mi |
| 3122 N 42nd St Milwaukee, WI | 3.0 | 1.0 | 1323 | $1,495 | $1.13 | 5d | 1 | 1.16mi |
| 2001 N 38th St #2003 Milwaukee, WI | 3.0 | 1.0 | 1326 | $950 | $0.72 | 3d | 1 | 1.23mi |
| 6100 W State St Wauwatosa, WI | 1.0–3.0 | 1.0–2.0 | 1160 | $3,017 | $2.60 | 2d | 20 | 1.45mi |
Listing history 18 events
-
2026-06-21days on market $172,900 Active 54 DOM
-
2026-06-18days on market $172,900 Active 51 DOM
-
2026-06-17days on market $172,900 Active 50 DOM
-
2026-06-16days on market $172,900 Active 49 DOM
-
2026-06-15days on market $172,900 Active 48 DOM
-
2026-06-13days on market $172,900 Active 46 DOM
-
2026-06-13days on market $172,900 Active 45 DOM
-
2026-06-09days on market $172,900 Active 42 DOM
-
2026-06-08days on market $172,900 Active 41 DOM
-
2026-06-07days on market $172,900 Active 40 DOM
-
2026-06-05days on market $172,900 Active 37 DOM
-
2026-06-03days on market $172,900 Active 36 DOM
-
2026-06-02days on market $172,900 Active 35 DOM
-
2026-06-01days on market $172,900 Active 34 DOM
-
2026-05-31days on market $172,900 Active 33 DOM
-
2026-04-28$178,000 Active 366-char remark
-
2025-12-22historical 251-char remark
Show marketing remark (251 chars)
Affordable first home or excellent investment opportunity. Almost $22,000 in annual rental income with room to grow! Hardwood floors. Large eat-in kitchens. Formal dining rooms. And a private backyard. Rooms sizes are not verified and are approximate.
-
2025-10-10$186,000 Active 251-char remark
Show marketing remark (251 chars)
Affordable first home or excellent investment opportunity. Almost $22,000 in annual rental income with room to grow! Hardwood floors. Large eat-in kitchens. Formal dining rooms. And a private backyard. Rooms sizes are not verified and are approximate.
ⓘ Source: listings_history table (triggers on properties + properties_extension) + one-shot
backfill from property_details.listing_events for pre-trigger history.
Climate risk First Street
- Flood 1/10 Low FEMA zone X (unshaded) · 0% chance over 30 yrs
- Wildfire 1/10 Low
- Heat 2/10 Low 7 d/yr ≥99°F today · 13 d/yr by 30 yrs out
- Wind 2/10 Low
- Air quality 2/10 Low 2 unhealthy d/yr today · 2 by 30 yrs out
Nearby sold comps map
Loading sold comps map…
Walkable amenities ~0.75 mi
Loading nearby amenities…
Taxation est. · year 1
- Rental income
- $26,388
- − Mortgage interest
- −$9,685
- − Property taxes
- −$2,594
- − Insurance
- −$864
- − Repairs & maintenance
- −$2,111
- − Management
- −$2,111
- − Depreciation
- −$5,030
- Taxable income
- $3,993
- Est. tax owed @ 24.0%
- −$958
- After-tax cash flow
- $5,550/yr
For passive investors: Depreciation is non-cash, so a rental often shows a tax loss while cash-flowing — sheltering income. Rental losses are passive: they offset passive income freely, and up to $25,000/yr can offset ordinary (W-2) income if you actively participate and your MAGI is under $100k (phasing out to $0 by $150k); unused losses carry forward. On sale, claimed depreciation is recaptured at up to 25%, and gains may owe capital-gains tax (a 1031 exchange can defer both). Figures are a year-1 estimate at your 24.0% rate — not tax advice; consult a CPA.
Condition & rehab AI · 12 photos
This multi-family home is in good condition with modern amenities and a well-maintained exterior. Potential buyers should consider painting the exterior and updating window treatments to further enhance its curb appeal and value.
Value-add opportunities
- Both Paint exterior siding — Enhances curb appeal and value
- Both Replace window treatments — Improves aesthetics and energy efficiency
- Both Upgrade lighting fixtures — Enhances ambiance and energy efficiency
Renovation cost estimate screening
Value-add ROI direction
- Both Paint exterior siding — Enhances curb appeal and value ↑
- Both Replace window treatments — Improves aesthetics and energy efficiency ↑
- Both Upgrade lighting fixtures — Enhances ambiance and energy efficiency ↑
ⓘ Cost ranges are severity-bucket heuristics (US national rule-of-thumb). Get contractor quotes + a written scope before underwriting a rehab budget.
Schools (NCES district)
- District
- Milwaukee School District
- NCES district ID
- 5509600
- Math proficiency
- 10% ▼ -5.00%
- Reading proficiency
- 18% ▬ 0.00%
- Median HH income
- $36,339
- Composite
- 11.61/100
- National rank
- #9696
- State rank
- #337 of 342 in WI
Livability — Milwaukee
- Score
- 81/100
- State rank
- #55
- US rank
- #1534
Category grades
Schools grade is shown separately in the Schools card above.
Census & demographics
- Census place
- Milwaukee, WI
- County
- Milwaukee County · 926,379 people
- City population
- 573,768
- Metro
- Milwaukee-Waukesha, WI
- Population (ZIP)
- 23,922
- Household income
- $48,217
- Rent vs Own
- Severe rent burden
- 1730.0
Population outlook (Milwaukee County) Hauer SSP2
- Today (2025)
- 995,758 people
- By 2030
- 1,009,124 · +1.3%
- By 2040
- 1,028,128 · +3.3%
- By 2050
- 1,040,066 · +4.4%
- By 2075
- 1,057,849 · +6.2%
- By 2100
- 1,039,774 · +4.4%
Race, ethnicity, and origin ACS 2023
- Neighborhood character
- Predominantly Black (71%)
- Race & ethnicity
- Black 71% White 17% Hispanic / Latino 6% Two or more races 6% Asian 2%
- Hispanic origin (detail)
- Mexican 3% Puerto Rican 1%
- Common ancestry
- Romanian 2% Portuguese 1% Italian 1%
- Foreign-born
- 3% · Canada, Philippines
- Languages at home
- 94% English-only · Spanish 3% Other Asian/Pacific 2%
Political lean MEDSL · Milwaukee
- 2024 margin
- Solid D (+38.5) · D 68.3% · R 29.8% · Other 1.8%
- 2008→2024 swing
- +2.7pp toward D · 2008: 35.9pp · 2024: 38.5pp
- All cycles
- 2024: D+38.5 2020: D+39.9 2016: D+37.5 2012: D+34.6 2008: D+35.9
Not yet ingested
- Civics
- —
Market trends
- HPI YoY
- ▼ -76.77%
- Current HPI
- 280.0133
- Rent YoY
- ▲ 3.82%
- Metro
- Milwaukee-Waukesha, WI
- State GDP YoY
- ▲ 2.10%
- F500 in state
- 20
Industry mix (Fortune 500 HQ in WI)
| Industry | F500 HQs | Revenue |
|---|---|---|
| Industrial Machinery | 4 | $23B |
|
||
| Industrial Technology | 2 | $36B |
|
||
| Insurance | 1 | $36B |
|
||
| Professional Services | 1 | $19B |
|
||
| Utilities | 1 | $9B |
|
||
| Consumer Goods | 1 | $3B |
|
||
Price history
-7.0% since first listed4 events — show timeline
- 2026-05-26 Price Changed $172,900 METROMLS
- 2026-04-28 Listed $178,000 METROMLS
- 2025-12-22 Listing Removed — METROMLS
- 2025-10-10 Listed $186,000 METROMLS
Cash-flow waterfall
monthlySold comps — $/sqft
last 12 mo · ≤1 miLoading sold comps…