 Multi-family
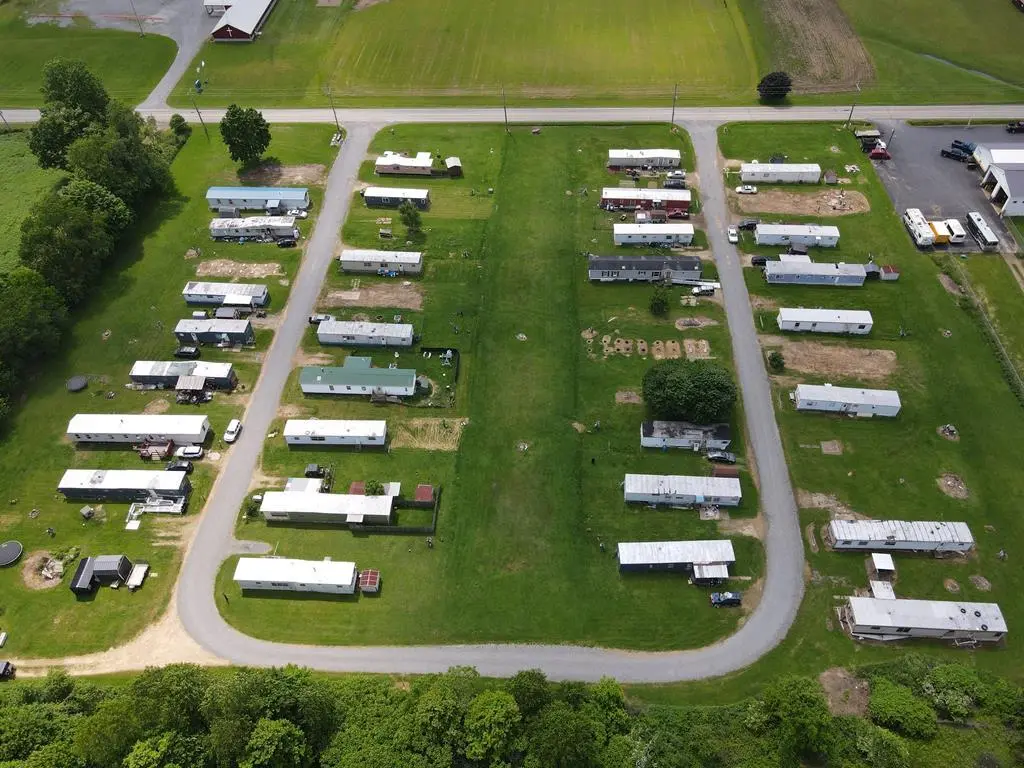
0 State Route 427 · Sugarcreek, PA
Flood risk No data
- FEMA flood zone
- —
- Chance of flooding over 30 yrs
- —
- Est. flood insurance / yr
- —
Fire risk No data
- Est. fire insurance / yr
- —
Heat risk No data
- Hot days now (above threshold)
- —
- Hot days in 30 yrs
- —
Wind risk No data
- Chance of severe wind over 30 yrs
- —
Air-quality risk No data
- Unhealthy air days now
- —
- Unhealthy air days in 30 yrs
- —
Risk factors via First Street. Map © Google.
Why this score? — see what drove the B+ grade
The composite is a weighted blend of 9 inputs, each scored 0–100. Each bar is that input's sub-score; the figure is the points it added to the 100-point composite (weight × sub-score).
- Cash flow +30.0/30.0
- 1% rule +10.0/10.0
- DSCR +10.0/10.0
- Appreciation +10.0/10.0
- ARV discount +7.5/15.0
- Schools +3.9/10.0
- Livability +3.3/5.0
- Rent growth +2.5/5.0
- Condition / age +2.2/5.0
$1,100,000
🖨 Deal sheet 📄 Offer letter ✓ Due diligence
Multi-family units
County records classify this as Multi-Family (5+ Unit). Listing-text estimate: 1 unit. estimate disagrees with records
5+ unit building — per-unit beds/baths from public records are typically unavailable; the breakdown below (if shown) is an estimate from the listing text.
Listing remarks MLS
Titan Park-Don't miss this rare opportunity to own a well-established and income-generating trailer court in the quiet and charming community of Cooperstown, Pennsylvania. This property currently features 27 occupied lots, with infrastructure in place to support up to 40 total lots, providing significant upside potential for increased revenue. Most units are privately owned, minimizing maintenance responsibilities and day-to-day management. The property consistently generates approximately $10,000 per month in gross income, with low operating expenses averaging $2,500 per month, making this an ideal investment for both seasoned and new investors seeking strong cash flow and long-term growth. The park is situated in a peaceful rural setting, yet remains easily accessible to nearby towns and amenities. Whether you're looking to expand your real estate portfolio or step into a turn-key investment, this mobile home park offers both stability and scalability. ?? Contact us today!
Key facts
- 27 occupied lots
- Income generating
- 40 total lots
Tags
Neighborhood map
What this means for you Summary
Snapshot
- This is a multifamily listed at $1.10M. Condition is rated fair.
Deal economics
- At list price, monthly cash flow is $13k ($155k/yr) — positive.
- The deal already cash-flows at list — no discount required.
- Meets the 1% rule at list price ($26k rent vs $1.10M).
- Recommended offer: $968k (12.0% below list) — sets the bar for market timing.
Location & tenants
- Location reads 66/100 on livability (#1,056 in PA) — a middle-class / working-renter tenant base. Strengths: crime A+, cost of living A+, housing A+; Watch: health & safety C-, schools D-, amenities F.
- Valley Grove SD (rural): math 36% / reading 58% proficiency, ranked #256 of 539 in PA (top 48%) — families likely to look elsewhere, expect single-tenant / working-renter base with shorter leases.
- Market conditions: 51 active listings in the ZIP; 6 comparable units currently listed for rent nearby; rentals lingering (median 44d on market — plan ~5-8 weeks vacancy on turnover, expect pricing pressure); 83% of comp listings sitting > 30 days — soft ceiling on asking rent; 42 units permitted in Venango County in 2024 (0 in 5+ unit buildings).
Forward outlook
- In year one you build about $118k of equity ($8k loan paydown + $110k appreciation (10.0% local appreciation)).
- Venango County population projected at -30% by 2050 — secular population decline; favor cash flow + early exit over multi-decade hold.
- At projected returns (10.0% appreciation + 3.0% rent growth), your $308k cash investment doubles in ~2 years — after that, you're playing with house money.
- By year 2, paydown + projected appreciation supports a ~$189k cash-out refi (75% LTV) — recoverable capital for the next deal without selling this one.
Negotiation context
- It's been on market 355 days — a 12% lower offer ($968k) is reasonable based on typical stale-listing flexibility.
Risks & watch-outs
- Watch-outs: built in 1900 — expect roof / HVAC / electrical / plumbing capex.
Questions for the listing agent
- It's been on market 355 days. Have you received any prior offers? Is the seller open to a 12% concession, seller financing, or rate buy-down credit?
- Have any recent inspections been done? Can we get a copy of the seller's disclosures and any deferred-maintenance estimates?
- Built in 1900 — when were the roof, HVAC, electrical panel, plumbing, and water heater last replaced?
- Why hasn't it sold? Are there any deal-killer items the seller is aware of (foundation, flood, title, zoning, code violations)?
- Is there a deadline driving the sale (1031 exchange, divorce, estate, relocation)? That informs how much negotiation room exists.
- Schools are D-rated, which usually means shorter tenancies and higher turnover. Who's the typical renter profile here, and what's been the actual vacancy rate?
- What's the average days-on-market for RENTAL listings here right now (not sales)? A rising rental-DOM trend means longer vacancies and softer asking-rent achievability than the comps imply.
- What's the recent tenant-quality profile in this submarket — average credit score on applications, eviction rate, late-payment / NSF rate, and stable-employment percentage? A property-management company in the area should have these aggregated.
- How much new apartment / multifamily construction is in the pipeline within 1–3 miles? Heavy new supply (>2% of stock underway) typically softens rents 12–24 months out; light construction supports rent growth.
Investment metrics
- 1% rule
- 2.36% ✓
- Cap rate
- 20.40%
- Cash-on-cash
- 50.37%
- DSCR
- 3.24
- GRM
- 3.5
CMA / ARV
- ARV (median comp)
- $56,110
- List price
- $1,100,000
- Delta
- 1860.43%
- Verdict
- OVERPRICED
- Comps
- 7 within 1.0 mi
Show comp detail 2 sales within ~0.75 mi
| Address | Dist | Beds/Ba | Sqft | Sold | Price | $/sf | Match |
|---|---|---|---|---|---|---|---|
| 210 Gilfillan St | 0.29mi | 4/2.0 | 1,750 | 20mo | $49,900 | $29 | 57 |
| 140 Grant St | 0.64mi | 4/2.0 | 2,304 | 21mo | $25,000 | $11 | 40 |
Match score weights: distance 35% · size 25% · config 20% · recency 20%. Top-matched comps best support the ARV.
Projected returns pro-forma
10.0% appreciation · 3.0% rent growth · sell at horizon
- IRR
- 63.9%
- Equity multiple
- 5.62×
- Total profit
- $1,422,865
- Equity at exit
- $990,967
- IRR
- 57.5%
- Equity multiple
- 12.50×
- Total profit
- $3,543,378
- Equity at exit
- $2,137,058
Cash invested: $308,000 (down + closing). Projections, not guarantees.
Landlord ↔ Tenant lean methodology
- Overall (STATE)
- 62 Landlord-Friendly
- State Pennsylvania
- 62 Landlord-Friendly · EVEN
- County
- — inherits STATE
- City
- — inherits STATE
ZIP-level market 16323
- Home prices YoY
- 12.2%
- Active inventory
- 51
- Price-to-rent
- 95.2×
Monthly cashflow live
- Estimated rent
- $25,987 high interval (Pro) →
- Mortgage (P&I)
- −$5,769
- Tax est. 1.5%
- −$1,375 /mo · $16,500/yr
- Insurance
- −$458
- HOA
- −$0
- Vacancy / Maint / Mgmt
- −$5,457
- Net cashflow
- $12,928
Break-even live
27-unit breakdown (identical units grouped — click to expand)
| Units | Beds | Baths | Est. rent |
|---|---|---|---|
| 27× units | 1 | 1 | $25,974 |
| #1 | 1 | 1 | $962 |
| #2 | 1 | 1 | $962 |
| #3 | 1 | 1 | $962 |
| #4 | 1 | 1 | $962 |
| #5 | 1 | 1 | $962 |
| #6 | 1 | 1 | $962 |
| #7 | 1 | 1 | $962 |
| #8 | 1 | 1 | $962 |
| #9 | 1 | 1 | $962 |
| #10 | 1 | 1 | $962 |
| #11 | 1 | 1 | $962 |
| #12 | 1 | 1 | $962 |
| #13 | 1 | 1 | $962 |
| #14 | 1 | 1 | $962 |
| #15 | 1 | 1 | $962 |
| #16 | 1 | 1 | $962 |
| #17 | 1 | 1 | $962 |
| #18 | 1 | 1 | $962 |
| #19 | 1 | 1 | $962 |
| #20 | 1 | 1 | $962 |
| #21 | 1 | 1 | $962 |
| #22 | 1 | 1 | $962 |
| #23 | 1 | 1 | $962 |
| #24 | 1 | 1 | $962 |
| #25 | 1 | 1 | $962 |
| #26 | 1 | 1 | $962 |
| #27 | 1 | 1 | $962 |
| Total (27 units) | $25,987 | ||
UW: 25.0% down · 7.5% · 30yr · 1.5% tax · 5.0% vac · 8.0% maint · 8.0% mgmt
Financing live
Cash to close
- Down payment
- $275,000
- Closing costs
- $33,000
- Reserves months
- —
- Total cash needed
- —
Loan-product check · same deal, 3 products live
Conventional
25% down · 7.5% · 30yr
- Down + closing
- —
- Monthly P&I
- —
- Monthly cashflow
- —
- DSCR
- —
- Eligible?
- —
Personal DTI + credit; lowest rate.
DSCR
20% down · 8.5% · 30yr
- Down + closing
- —
- Monthly P&I
- —
- Monthly cashflow
- —
- DSCR
- —
- Eligible?
- —
No personal income docs; deal must DSCR.
Hard money
10% down · 12.0% · 12mo
- Down + closing
- —
- Monthly P&I
- —
- Monthly cashflow
- —
- DSCR
- —
- Eligible?
- —
Short-term bridge; refi at stabilization.
Rent comps 6 comps
| Address | Beds | Baths | Sqft | Rent | $/sqft | DOM | Units | Dist |
|---|---|---|---|---|---|---|---|---|
| 38 Prospect Ave Franklin, PA | 2.0 | 1.0 | — | $900 | — | 43d | 1 | 0.51mi |
| 10 Taylor St Franklin, PA | 1.0 | 1.0 | 614 | $873 | $1.42 | 13d | 1 | 0.72mi |
| 305 13th St Franklin, PA | 2.0 | 1.5 | 687 | $1,100 | $1.60 | 43d | 1 | 0.91mi |
| 414 11th St Franklin, PA | 1.0 | 1.0 | 750 | $725 | $0.97 | 43d | 1 | 1.12mi |
| 1341 Sassafrass St Franklin, PA | 3.0 | 1.0 | 1300 | $1,050 | $0.81 | 43d | 1 | 1.28mi |
| 850 Elk St Franklin, PA | 2.0 | 1.0 | 1000 | $1,386 | $1.39 | 43d | 1 | 1.38mi |
Listing history 4 events
-
2026-06-02days on market $1,100,000 Active 355 DOM
-
2026-06-01days on market $1,100,000 Active 354 DOM
-
2026-05-31days on market $1,100,000 Active 353 DOM
-
2025-06-12$1,100,000 Active 989-char remark
Show marketing remark (989 chars)
Titan Park-Don't miss this rare opportunity to own a well-established and income-generating trailer court in the quiet and charming community of Cooperstown, Pennsylvania. This property currently features 27 occupied lots, with infrastructure in place to support up to 40 total lots, providing significant upside potential for increased revenue. Most units are privately owned, minimizing maintenance responsibilities and day-to-day management. The property consistently generates approximately $10,000 per month in gross income, with low operating expenses averaging $2,500 per month, making this an ideal investment for both seasoned and new investors seeking strong cash flow and long-term growth. The park is situated in a peaceful rural setting, yet remains easily accessible to nearby towns and amenities. Whether you're looking to expand your real estate portfolio or step into a turn-key investment, this mobile home park offers both stability and scalability. ?? Contact us today!
ⓘ Source: listings_history table (triggers on properties + properties_extension) + one-shot
backfill from property_details.listing_events for pre-trigger history.
Nearby sold comps map
Loading sold comps map…
Walkable amenities ~0.75 mi
Loading nearby amenities…
Taxation est. · year 1
- Rental income
- $311,844
- − Mortgage interest
- −$61,617
- − Property taxes
- −$16,500
- − Insurance
- −$5,500
- − Repairs & maintenance
- −$24,948
- − Management
- −$24,948
- − Depreciation
- −$32,000
- Taxable income
- $146,332
- Est. tax owed @ 24.0%
- −$35,120
- After-tax cash flow
- $120,015/yr
For passive investors: Depreciation is non-cash, so a rental often shows a tax loss while cash-flowing — sheltering income. Rental losses are passive: they offset passive income freely, and up to $25,000/yr can offset ordinary (W-2) income if you actively participate and your MAGI is under $100k (phasing out to $0 by $150k); unused losses carry forward. On sale, claimed depreciation is recaptured at up to 25%, and gains may owe capital-gains tax (a 1031 exchange can defer both). Figures are a year-1 estimate at your 24.0% rate — not tax advice; consult a CPA.
Condition & rehab AI · 7 photos
This multi-family property presents as a moderate rehab opportunity with average exterior and landscaping conditions. Improvements in these areas would significantly enhance its resale and rental value.
Repairs flagged
- Moderate Exterior siding — Weathered appearance
- Moderate Landscaping — Overgrown and unkempt
Value-add opportunities
- Both Landscaping and exterior maintenance — Improves curb appeal and property value
- Both Interior updates — Enhances living space and rental appeal
- Both Kitchen and bathroom updates — Improves functionality and rental appeal
Renovation cost estimate screening
| Repair item | Severity | Est. cost |
|---|---|---|
| Exterior siding · Weathered appearance | Moderate | $3,000–15,000 |
| Landscaping · Overgrown and unkempt | Moderate | $3,000–15,000 |
| Total estimated repair cost · 2 items | $6,000–30,000 |
Value-add ROI direction
- Both Landscaping and exterior maintenance — Improves curb appeal and property value ↑
- Both Interior updates — Enhances living space and rental appeal ↑
- Both Kitchen and bathroom updates — Improves functionality and rental appeal ↑
ⓘ Cost ranges are severity-bucket heuristics (US national rule-of-thumb). Get contractor quotes + a written scope before underwriting a rehab budget.
Schools (NCES district)
- District
- Valley Grove SD
- NCES district ID
- 4224630
- Math proficiency
- 36% ▼ -15.00%
- Reading proficiency
- 58% ▼ -7.00%
- Median HH income
- $42,090
- Composite
- 39.46/100
- National rank
- #3957
- State rank
- #256 of 539 in PA
Livability — Sugarcreek
- Score
- 66/100
- State rank
- #1056
- US rank
- #11914
Category grades
Schools grade is shown separately in the Schools card above.
Census & demographics
- Census place
- Sugarcreek, PA
- City population
- 15,310
- Population (ZIP)
- 14,694
Population outlook (Venango County) Hauer SSP2
- Today (2025)
- 48,827 people
- By 2030
- 46,061 · -5.7%
- By 2040
- 39,989 · -18.1%
- By 2050
- 34,094 · -30.2%
- By 2075
- 22,500 · -53.9%
- By 2100
- 13,659 · -72.0%
Race, ethnicity, and origin ACS 2023
- Neighborhood character
- Predominantly White (92%)
- Race & ethnicity
- White 92% Two or more races 3% Black 2%
- Common ancestry
- Romanian 4% Iranian 3% Serbian 2%
- Foreign-born
- 1% · Canada
Political lean MEDSL · Venango
- 2024 margin
- Solid R (+42.1) · D 28.5% · R 70.6%
- 2008→2024 swing
- -22.9pp toward R · 2008: -19.2pp · 2024: -42.1pp
- All cycles
- 2024: R+42.1 2020: R+41.4 2016: R+42.4 2012: R+26.3 2008: R+19.2
Not yet ingested
- Civics
- —
Market trends
- HPI YoY
- ▲ 26.68%
- Current HPI
- 245.9766
- Rent YoY
- —
- Metro
- —
- State GDP YoY
- ▲ 1.68%
- F500 in state
- 34
Industry mix (Fortune 500 HQ in PA)
| Industry | F500 HQs | Revenue |
|---|---|---|
| Healthcare | 2 | $309B |
|
||
| Insurance | 2 | $27B |
|
||
| Telecommunications / Media | 1 | $124B |
|
||
| Industrial Distribution | 1 | $22B |
|
||
| Financial Services | 1 | $20B |
|
||
| Chemicals / Materials | 1 | $18B |
|
||
Price history
1 event — show timeline
- 2025-06-12 Listed $1,100,000 AVBREALTORS
Cash-flow waterfall
monthlySold comps — $/sqft
last 12 mo · ≤1 miLoading sold comps…