 🏗️ New Construction
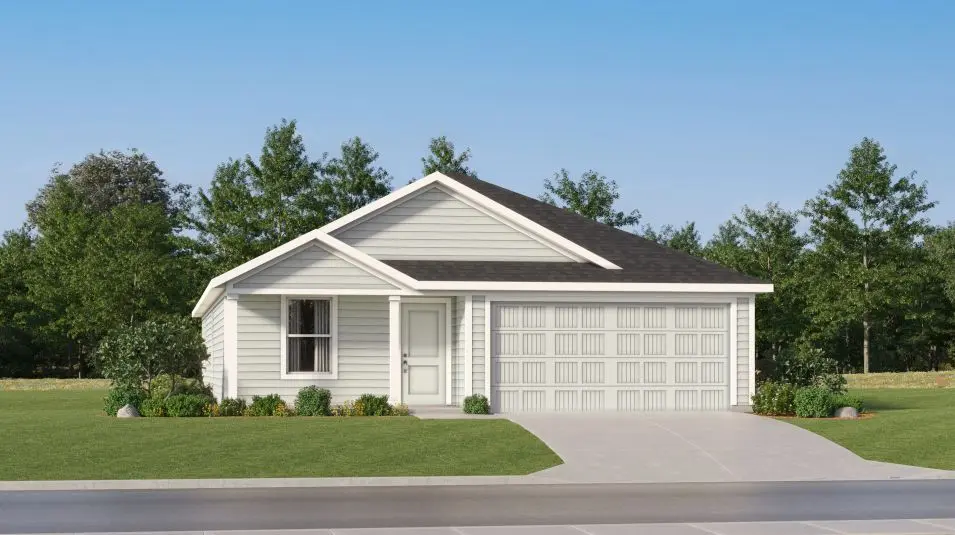
Oxford Plan · Holland, TX
Flood risk No data
- FEMA flood zone
- —
- Chance of flooding over 30 yrs
- —
- Est. flood insurance / yr
- —
Fire risk No data
- Est. fire insurance / yr
- —
Heat risk No data
- Hot days now (above threshold)
- —
- Hot days in 30 yrs
- —
Wind risk No data
- Chance of severe wind over 30 yrs
- —
Air-quality risk No data
- Unhealthy air days now
- —
- Unhealthy air days in 30 yrs
- —
Risk factors via First Street. Map © Google.
Why this score? — see what drove the B- grade
The composite is a weighted blend of 9 inputs, each scored 0–100. Each bar is that input's sub-score; the figure is the points it added to the 100-point composite (weight × sub-score).
- Cash flow +28.4/30.0
- DSCR +10.0/10.0
- 1% rule +7.8/10.0
- ARV discount +7.5/15.0
- Schools +4.4/10.0
- Condition / age +4.0/5.0
- Livability +3.5/5.0
- Rent growth +2.5/5.0
- Appreciation +0.0/10.0
$243,999
🖨 Deal sheet 📄 Offer letter ✓ Due diligence
Listing remarks MLS
This single-level home showcases a spacious open floorplan shared between the kitchen, dining area and family room for easy entertaining. An owner's suite enjoys a private location in a rear corner of the home, complemented by an en-suite bathroom and walk-in closet. There are three secondary bedrooms at the front of the home, which are comfortable spaces for household members and overnight guests.
Key facts
- Walk-in closet
- Open floorplan
- En-suite bathroom
Tags
Neighborhood map
What this means for you Summary
Snapshot
- This is a 4-bed/2.0-bath single-family listed at $244k. Condition is rated good.
Deal economics
- At list price, monthly cash flow is $784 ($9k/yr) — positive.
- The deal already cash-flows at list — no discount required.
- Meets the 1% rule at list price ($3k rent vs $244k).
- Recommended offer: $215k (12.0% below list) — sets the bar for market timing.
Location & tenants
- Location reads 70/100 on livability (#357 in TX) — a middle-class / working-renter tenant base. Strengths: crime A+, cost of living A+, housing A+; Watch: schools C-, amenities F, commute F.
- Holland ISD (rural): math 53% / reading 50% proficiency, ranked #158 of 826 in TX (top 19%) — acceptable for families but not a draw, mixed tenant base, ~2y average lease.
- Market conditions: 50 active listings in the ZIP; 3,222 units permitted in Bell County in 2024 (246 in 5+ unit buildings).
Forward outlook
- Local home prices are declining (-3.0%/yr); year-one equity from $2k of loan paydown is wiped out by about $7k of value loss. Plan a longer hold.
- Bell County population projected at +21% by 2050 — long-run rental-demand tailwind backs the buy-and-hold thesis.
- At projected returns (-3.0% appreciation + 3.0% rent growth), your $68k cash investment doubles in ~9 years — after that, you're playing with house money.
Negotiation context
- It's been on market 122 days — a 12% lower offer ($215k) is reasonable based on typical stale-listing flexibility.
Questions for the listing agent
- It's been on market 122 days. Have you received any prior offers? Is the seller open to a 12% concession, seller financing, or rate buy-down credit?
- Why hasn't it sold? Are there any deal-killer items the seller is aware of (foundation, flood, title, zoning, code violations)?
- Is there a deadline driving the sale (1031 exchange, divorce, estate, relocation)? That informs how much negotiation room exists.
- What's the average days-on-market for RENTAL listings here right now (not sales)? A rising rental-DOM trend means longer vacancies and softer asking-rent achievability than the comps imply.
- What's the recent tenant-quality profile in this submarket — average credit score on applications, eviction rate, late-payment / NSF rate, and stable-employment percentage? A property-management company in the area should have these aggregated.
- How much new for-sale + rental construction is in the pipeline within 1–3 miles? Heavy new supply typically softens prices + rents 12–24 months out; constrained supply supports both.
Investment metrics
- 1% rule
- 1.28% ✓
- Cap rate
- 10.16%
- Cash-on-cash
- 13.81%
- DSCR
- 1.61
- GRM
- 6.5
CMA / ARV
- ARV (median comp)
- $243,242
- List price
- $243,999
- Delta
- 0.31%
- Verdict
- FAIR
- Comps
- 20 within 1.0 mi
Show comp detail 12 sales within ~0.75 mi
| Address | Dist | Beds/Ba | Sqft | Sold | Price | $/sf | Match |
|---|---|---|---|---|---|---|---|
| 416 Rueben Ave | 0.03mi | 4/2.0 | 1,707 (0%) | 3mo | $215,990 | $127 | 96 |
| 408 Rueben Ave | 0.02mi | 4/2.0 | 1,707 (0%) | 5mo | $228,990 | $134 | 95 |
| 417 Rueben Ave | 0.06mi | 4/2.0 | 1,804 (+6%) | 10mo | $232,990 | $129 | 80 |
| 424 Rueben Ave | 0.05mi | 5/3.0 (+1) | 1,804 (+6%) | 5mo | $194,996 | $108 | 75 |
| 409 Rueben Ave | 0.05mi | 4/2.5 | 1,891 (+11%) | 4mo | $237,990 | $126 | 74 |
| 500 Rueben Ave | 0.07mi | 5/3.0 (+1) | 1,804 (+6%) | 6mo | $216,990 | $120 | 74 |
| 401 Rueben Ave | 0.06mi | 4/2.5 | 1,891 (+11%) | 6mo | $248,990 | $132 | 72 |
| 412 Rueben Ave | 0.02mi | 4/2.5 | 1,954 (+14%) | 3mo | $243,990 | $125 | 71 |
| 400 Rueben Ave | 0.06mi | 4/2.5 | 1,954 (+14%) | 4mo | $245,990 | $126 | 68 |
| 405 Rueben Ave | 0.05mi | 4/2.5 | 1,954 (+14%) | 5mo | $249,990 | $128 | 67 |
| 417 Tabitha Ln | 0.11mi | 4/2.5 | 1,952 (+14%) | 10mo | $273,990 | $140 | 61 |
| 306 W Travis | 0.46mi | 3/2.0 (-1) | 1,456 (-15%) | 6mo | $205,000 | $141 | 44 |
Match score weights: distance 35% · size 25% · config 20% · recency 20%. Top-matched comps best support the ARV.
Projected returns pro-forma
-3.0% appreciation · 3.0% rent growth · sell at horizon
- IRR
- 4.0%
- Equity multiple
- 1.15×
- Total profit
- $10,540
- Equity at exit
- $36,268
- IRR
- 13.5%
- Equity multiple
- 2.08×
- Total profit
- $73,634
- Equity at exit
- $21,031
Cash invested: $68,108 (down + closing). Projections, not guarantees.
Landlord ↔ Tenant lean methodology
- Overall (STATE)
- 87 Strongly Landlord-Friendly
- State Texas
- 87 Strongly Landlord-Friendly · R+5
- County
- — inherits STATE
- City
- — inherits STATE
ZIP-level market 76534
- Home prices YoY
- -17.4%
- Active inventory
- 50
- Price-to-rent
- 6.5×
Monthly cashflow live
- Estimated rent
- $3,120 medium interval (Pro) →
- Mortgage (P&I)
- −$1,276
- Tax est. 1.5%
- −$304 /mo · $3,649/yr
- Insurance
- −$101
- HOA
- −$0
- Vacancy / Maint / Mgmt
- −$655
- Net cashflow
- $784
Break-even live
UW: 25.0% down · 7.5% · 30yr · 1.5% tax · 5.0% vac · 8.0% maint · 8.0% mgmt
Financing live
Cash to close
- Down payment
- $60,810
- Closing costs
- $7,297
- Reserves months
- —
- Total cash needed
- —
Loan-product check · same deal, 3 products live
Conventional
25% down · 7.5% · 30yr
- Down + closing
- —
- Monthly P&I
- —
- Monthly cashflow
- —
- DSCR
- —
- Eligible?
- —
Personal DTI + credit; lowest rate.
DSCR
20% down · 8.5% · 30yr
- Down + closing
- —
- Monthly P&I
- —
- Monthly cashflow
- —
- DSCR
- —
- Eligible?
- —
No personal income docs; deal must DSCR.
Hard money
10% down · 12.0% · 12mo
- Down + closing
- —
- Monthly P&I
- —
- Monthly cashflow
- —
- DSCR
- —
- Eligible?
- —
Short-term bridge; refi at stabilization.
Listing history 17 events
-
2026-06-18days on market $243,999 Active 122 DOM
-
2026-06-17days on market $243,999 Active 121 DOM
-
2026-06-16days on market $243,999 Active 120 DOM
-
2026-06-15days on market $243,999 Active 119 DOM
-
2026-06-14days on market $243,999 Active 117 DOM
-
2026-06-10days on market $243,999 Active 114 DOM
-
2026-06-09days on market $243,999 Active 113 DOM
-
2026-06-08days on market $243,999 Active 112 DOM
-
2026-06-07days on market $243,999 Active 111 DOM
-
2026-06-05days on market $243,999 Active 108 DOM
-
2026-06-03days on market $243,999 Active 107 DOM
-
2026-06-02days on market $243,999 Active 106 DOM
-
2026-06-01days on market $243,999 Active 105 DOM
-
2026-05-31days on market $243,999 Active 104 DOM
-
2026-05-30days on market $243,999 Active 103 DOM
-
2026-03-31price $243,999 401-char remark
Show marketing remark (401 chars)
This single-level home showcases a spacious open floorplan shared between the kitchen, dining area and family room for easy entertaining. An owner's suite enjoys a private location in a rear corner of the home, complemented by an en-suite bathroom and walk-in closet. There are three secondary bedrooms at the front of the home, which are comfortable spaces for household members and overnight guests.
-
2026-02-16$243,990 Active 401-char remark
Show marketing remark (401 chars)
This single-level home showcases a spacious open floorplan shared between the kitchen, dining area and family room for easy entertaining. An owner's suite enjoys a private location in a rear corner of the home, complemented by an en-suite bathroom and walk-in closet. There are three secondary bedrooms at the front of the home, which are comfortable spaces for household members and overnight guests.
ⓘ Source: listings_history table (triggers on properties + properties_extension) + one-shot
backfill from property_details.listing_events for pre-trigger history.
Nearby sold comps map
Loading sold comps map…
Walkable amenities ~0.75 mi
Loading nearby amenities…
Taxation est. · year 1
- Rental income
- $37,437
- − Mortgage interest
- −$13,625
- − Property taxes
- −$3,649
- − Insurance
- −$1,216
- − Repairs & maintenance
- −$2,995
- − Management
- −$2,995
- − Depreciation
- −$7,076
- Taxable income
- $5,881
- Est. tax owed @ 24.0%
- −$1,411
- After-tax cash flow
- $7,992/yr
For passive investors: Depreciation is non-cash, so a rental often shows a tax loss while cash-flowing — sheltering income. Rental losses are passive: they offset passive income freely, and up to $25,000/yr can offset ordinary (W-2) income if you actively participate and your MAGI is under $100k (phasing out to $0 by $150k); unused losses carry forward. On sale, claimed depreciation is recaptured at up to 25%, and gains may owe capital-gains tax (a 1031 exchange can defer both). Figures are a year-1 estimate at your 24.0% rate — not tax advice; consult a CPA.
Condition & rehab AI · 12 photos
This single-level home is in excellent condition with a spacious open floorplan and modern finishes. It is move-in ready and would benefit from minor exterior updates to maximize its value.
Value-add opportunities
- Both Paint exterior siding — Enhances curb appeal and value
- Both Replace window treatments — Freshens look and improves energy efficiency
- Both Install smart home devices — Enhances convenience and marketability
Renovation cost estimate screening
Value-add ROI direction
- Both Paint exterior siding — Enhances curb appeal and value ↑
- Both Replace window treatments — Freshens look and improves energy efficiency ↑
- Both Install smart home devices — Enhances convenience and marketability ↑
ⓘ Cost ranges are severity-bucket heuristics (US national rule-of-thumb). Get contractor quotes + a written scope before underwriting a rehab budget.
Schools (NCES district)
- District
- Holland ISD
- NCES district ID
- 4823370
- Math proficiency
- 53% ▼ -8.00%
- Reading proficiency
- 50% ▼ -10.00%
- Median HH income
- $47,232
- Composite
- 43.78/100
- National rank
- #2938
- State rank
- #158 of 826 in TX
Livability — Holland
- Score
- 70/100
- State rank
- #357
- US rank
- #7736
Category grades
Schools grade is shown separately in the Schools card above.
Census & demographics
- Census place
- Holland, TX
- Population (ZIP)
- 2,812
Population outlook (Bell County) Hauer SSP2
- Today (2025)
- 371,114 people
- By 2030
- 389,104 · +4.8%
- By 2040
- 420,592 · +13.3%
- By 2050
- 447,779 · +20.7%
- By 2075
- 499,130 · +34.5%
- By 2100
- 505,680 · +36.3%
Race, ethnicity, and origin ACS 2023
- Neighborhood character
- Predominantly White (75%)
- Race & ethnicity
- White 75% Hispanic / Latino 17% Black 5% Two or more races 4%
- Hispanic origin (detail)
- Mexican 15%
- Common ancestry
- Slovak 5% Romanian 1% Italian 1%
- Foreign-born
- 3% · Canada
- Languages at home
- 91% English-only · Spanish 8% Other Indo-European 1%
Political lean MEDSL · Bell
- 2024 margin
- R (+16.2) · D 41.3% · R 57.6% · Other 1.1%
- 2008→2024 swing
- -6.5pp toward R · 2008: -9.8pp · 2024: -16.2pp
- All cycles
- 2024: R+16.2 2020: R+8.5 2016: R+15.1 2012: R+16.4 2008: R+9.8
Not yet ingested
- Civics
- —
Market trends
- HPI YoY
- ▼ -52.62%
- Current HPI
- 249.7032
- Rent YoY
- —
- Metro
- —
- State GDP YoY
- ▲ 3.95%
- F500 in state
- 110
Industry mix (Fortune 500 HQ in TX)
| Industry | F500 HQs | Revenue |
|---|---|---|
| Energy | 16 | $1,198B |
|
||
| Technology | 5 | $198B |
|
||
| Engineering / Construction | 4 | $72B |
|
||
| Energy Services | 3 | $60B |
|
||
| Utilities | 3 | $41B |
|
||
| Healthcare | 2 | $330B |
|
||
Price history
+0.0% since first listed2 events — show timeline
- 2026-03-31 Price Changed $243,999 Zillow
- 2026-02-16 Listed $243,990 Zillow
Cash-flow waterfall
monthlySold comps — $/sqft
last 12 mo · ≤1 miLoading sold comps…