 🌊 Lakefront
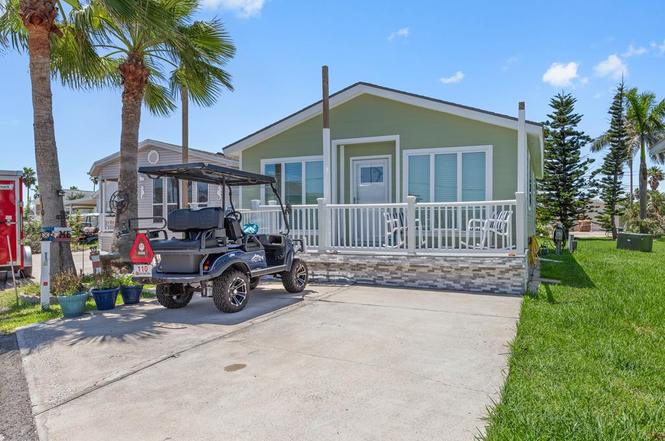
110 Abalone Cir · Port Isabel, TX
Flood risk 9/10 · Severe
- FEMA flood zone
- AE
- Chance of flooding over 30 yrs
- 0.99%
- Est. flood insurance / yr
- $1,737 – $8,500
Fire risk 1/10 · Minimal
- Est. fire insurance / yr
- $1,222 – $2,270
Heat risk 10/10 · Severe
- Hot days now (above 106°F)
- 6 days/yr
- Hot days in 30 yrs
- 24 days/yr
Wind risk 9/10 · Severe
- Chance of severe wind over 30 yrs
- 99.0%
Air-quality risk 2/10 · Minimal
- Unhealthy air days now
- 0 days/yr
- Unhealthy air days in 30 yrs
- 1 days/yr
Risk factors via First Street. Map © Google.
Why this score? — see what drove the C+ grade
The composite is a weighted blend of 9 inputs, each scored 0–100. Each bar is that input's sub-score; the figure is the points it added to the 100-point composite (weight × sub-score).
- Cash flow +22.0/30.0
- ARV discount +15.0/15.0
- 1% rule +8.5/10.0
- DSCR +7.0/10.0
- Livability +3.8/5.0
- Rent growth +2.5/5.0
- Condition / age +2.5/5.0
- Schools +1.9/10.0
- Appreciation +0.0/10.0
$195,000
🖨 Deal sheet 📄 Offer letter ✓ Due diligence
Listing remarks
2/1 Open and airy, with a layout that maximizes natural light . The decor includes light, and neutral colors . The kitchen is updated with modern appliances, open to the living and dining areas to keep the space connected and inviting. Two cozy bedrooms, which might be simply furnished but comfortable . Bathroom: One full bath with combination of shower and tub. Overall, a 2/1 home by the beach is likely designed for relaxed, coastal living, offering a charming retreat with easy access to the ocean and a comfortable, laid-back interior. Great amenities include 2 pools, golf course, tennis, pool hall, craft room. Gated community. 5 minutes from the beach . Step outside and watch Space X L
Key facts
- Cozy bedrooms
- 2800 acre lot
- Community pool
Tags
Property features AI
Finance
- HOA & community: Homeowners association with a monthly fee of $348
Exterior
- Security: Gated community
- Home design: Residential property (Long Island Village subtype)
- Exterior features: Located in the Outdoor Resorts subdivision; Community amenities include a clubhouse, gated entry, golf, pool, and tennis courts; Zoned R
Interior
- Bathrooms: 1 full bathroom
- Interior features: Unbranded virtual tour available
Neighborhood map
What this means for you Summary
Snapshot
- This is a 1-bed/1.0-bath single-family listed at $195k.
Deal economics
- At list price, monthly cash flow is $-117 ($-1k/yr) — negative.
- To cash-flow at today's rent, offer at most $174k (10.6% below list).
- Meets the 1% rule at list price ($3k rent vs $195k).
- Recommended offer: $172k (12.0% below list) — sets the bar for market timing.
- Cap rate 8.2% vs local median 3.4% in Port Isabel — top-decile yield for the area; either an underpriced asset or a hidden risk that comps aren't pricing in. Stress-test before assuming the spread holds.
Location & tenants
- Location reads 75/100 on livability (#157 in TX, #4,282 nationally) — a middle-class / working-renter tenant base. Strengths: cost of living A+, housing A+, health & safety A+; Watch: employment D, schools F, crime F.
- Point Isabel ISD (town): math 14% / reading 31% proficiency, ranked #756 of 826 in TX (top 92%) — low school quality limits family demand, transient renter base, plan for 1-2y turnover.
- Market conditions: 254 active listings in the ZIP; 9 comparable units currently listed for rent nearby; rentals at typical pace (median 22d on market — plan ~3-4 weeks tenant-placement turnaround); 44% of comp listings sitting > 30 days — soft ceiling on asking rent; 2,326 units permitted in Cameron County in 2024 (503 in 5+ unit buildings).
Forward outlook
- Local home prices are declining (-3.0%/yr); year-one equity from $1k of loan paydown is wiped out by about $6k of value loss. Plan a longer hold.
- Cameron County population projected at +3% by 2050 — modest demand growth; plan on rents tracking national, not racing it.
Negotiation context
- It's been on market 675 days — a 12% lower offer ($172k) is reasonable based on typical stale-listing flexibility.
- 9 sale attempts since 3y ago; this cycle's ask has dropped $47k (19%) from the opening price — seller is motivated, your offer sets the floor, not the list.
Risks & watch-outs
- Watch-outs: flood insurance adds $427/mo.
- Climate carrying-cost: in FEMA flood zone AE (mandatory federal flood insurance); severe wind risk, 99% chance of damaging wind over 30y; extreme-heat days projected 6→24/yr by 2055 (HVAC capex compounding) — expect insurance premiums to compound above CPI over the hold.
Questions for the listing agent
- What do current leases actually rent for vs. the listed asking? Can we see a recent rent roll and the last 12 months of T-12 income?
- It's been on market 675 days. Have you received any prior offers? Is the seller open to a 12% concession, seller financing, or rate buy-down credit?
- What's the actual annual flood-insurance premium (NFIP or private), and is the property in a SFHA with mandatory coverage?
- What does the HOA fee cover, when was the last increase, and are there any pending special assessments or reserve-fund shortfalls?
- Why hasn't it sold? Are there any deal-killer items the seller is aware of (foundation, flood, title, zoning, code violations)?
- Is there a deadline driving the sale (1031 exchange, divorce, estate, relocation)? That informs how much negotiation room exists.
- Schools are F-rated, which usually means shorter tenancies and higher turnover. Who's the typical renter profile here, and what's been the actual vacancy rate?
- Crime grade is F in this area — have there been break-ins, vandalism, or insurance claims at this property in the last 3 years? What carrier currently insures it and at what premium?
- This sits on a lake — are riparian / water-frontage rights deeded with the parcel? Any dock permits, shoreline easements, or HOA water-use restrictions?
- What's the documented flood / surge / shoreline-erosion history here (FEMA AND non-FEMA — e.g., storm surge, creek backup, septic-field saturation)?
- Any water-quality or seasonal algae-bloom issues that affect tenant satisfaction or short-term-rental demand?
- What's the average days-on-market for RENTAL listings here right now (not sales)? A rising rental-DOM trend means longer vacancies and softer asking-rent achievability than the comps imply.
- What's the recent tenant-quality profile in this submarket — average credit score on applications, eviction rate, late-payment / NSF rate, and stable-employment percentage? A property-management company in the area should have these aggregated.
- How much new for-sale + rental construction is in the pipeline within 1–3 miles? Heavy new supply typically softens prices + rents 12–24 months out; constrained supply supports both.
Investment metrics
- 1% rule
- 1.35% ✓
- Cap rate
- 8.20%
- Cash-on-cash
- 6.80%
- DSCR
- 1.30
- GRM
- 6.2
CMA / ARV
- ARV (on-the-fly)
- $289,044
- Comps found
- 11
Show comp detail 11 sales within ~0.75 mi
| Address | Dist | Beds/Ba | Sqft | Sold | Price | $/sf | Match |
|---|---|---|---|---|---|---|---|
| 587 Star Fish Dr | 0.32mi | 2/1.0 (+1) | 832 (+7%) | 3mo | $259,900 | $312 | 66 |
| 223 Conch Dr | 0.21mi | 2/1.5 (+1) | 840 (+8%) | 17mo | $245,000 | $292 | 56 |
| 742 E Clam Cir | 0.53mi | 2/2.0 (+1) | 768 (-1%) | 11mo | $260,000 | $339 | 55 |
| 590 Star Fish Dr | 0.31mi | 2/2.0 (+1) | 864 (+11%) | 4mo | $179,000 | $207 | 54 |
| 109 Abalone Cir | 0.01mi | 2/1.5 (+1) | 871 (+12%) | 24mo | $259,000 | $297 | 53 |
| 675 E Clam Cir | 0.49mi | 2/2.0 (+1) | 865 (+11%) | 3mo | $350,000 | $405 | 47 |
| 502 W Clam Cir | 0.52mi | 2/2.5 (+1) | 839 (+8%) | 6mo | $380,000 | $453 | 46 |
| 685 E Clam Cir | 0.52mi | 2/2.0 (+1) | 850 (+9%) | 8mo | $415,000 | $488 | 44 |
| 702 E Clam Cir | 0.54mi | 2/1.5 (+1) | 843 (+8%) | 11mo | $314,000 | $372 | 44 |
| 311 Sun Dial Cir | 0.36mi | 2/2.0 (+1) | 887 (+14%) | 11mo | $360,000 | $406 | 42 |
| 499 W Clam Cir | 0.52mi | 2/2.0 (+1) | 864 (+11%) | 22mo | $345,000 | $399 | 30 |
Match score weights: distance 35% · size 25% · config 20% · recency 20%. Top-matched comps best support the ARV.
Projected returns pro-forma
-3.0% appreciation · 3.0% rent growth · sell at horizon
- IRR
- -20.2%
- Equity multiple
- 0.30×
- Total profit
- $-38,485
- Equity at exit
- $29,075
- IRR
- -12.5%
- Equity multiple
- 0.25×
- Total profit
- $-40,814
- Equity at exit
- $16,860
Cash invested: $54,600 (down + closing). Projections, not guarantees.
Landlord ↔ Tenant lean methodology
- Overall (STATE)
- 87 Strongly Landlord-Friendly
- State Texas
- 87 Strongly Landlord-Friendly · R+5
- County
- — inherits STATE
- City
- — inherits STATE
ZIP-level market 78578
- Home prices YoY
- -21.7%
- Active inventory
- 254
- Price-to-rent
- 6.2×
Monthly cashflow live
- Estimated rent
- $2,638 high interval (Pro) →
- Mortgage (P&I)
- −$1,023
- Tax from tax record
- −$322 /mo · $3,869/yr
- Insurance
- −$81
- Flood insurance flood zone
- −$427 /mo · $5,118/yr
- HOA
- −$348
- Vacancy / Maint / Mgmt
- −$554
- Net cashflow
- $-117
Break-even live
UW: 25.0% down · 7.5% · 30yr · 1.5% tax · 5.0% vac · 8.0% maint · 8.0% mgmt
Financing live
Cash to close
- Down payment
- $48,750
- Closing costs
- $5,850
- Reserves months
- —
- Total cash needed
- —
Loan-product check · same deal, 3 products live
Conventional
25% down · 7.5% · 30yr
- Down + closing
- —
- Monthly P&I
- —
- Monthly cashflow
- —
- DSCR
- —
- Eligible?
- —
Personal DTI + credit; lowest rate.
DSCR
20% down · 8.5% · 30yr
- Down + closing
- —
- Monthly P&I
- —
- Monthly cashflow
- —
- DSCR
- —
- Eligible?
- —
No personal income docs; deal must DSCR.
Hard money
10% down · 12.0% · 12mo
- Down + closing
- —
- Monthly P&I
- —
- Monthly cashflow
- —
- DSCR
- —
- Eligible?
- —
Short-term bridge; refi at stabilization.
Rent comps 9 comps
| Address | Beds | Baths | Sqft | Rent | $/sqft | DOM | Units | Dist |
|---|---|---|---|---|---|---|---|---|
| 87 Abalone Cir Port Isabel, TX | 2.0 | 2.0 | 800 | $2,850 | $3.56 | 21d | 1 | 0.08mi |
| 121 E Madison St Port Isabel, TX | 2.0 | 1.0 | 1000 | $1,900 | $1.90 | 44d | 1 | 0.40mi |
| 515 W Clam Cir Unit 1515048P Port Isabel, TX | 2.0 | 1.5 | 796 | $2,916 | $3.66 | 21d | 1 | 0.51mi |
| 793 E Oyster Dr Unit 1515047P Port Isabel, TX | 1.0 | 1.0 | 775 | $3,113 | $4.02 | 14d | 1 | 0.61mi |
| 829 N Yturria St Unit 2 Port Isabel, TX | 2.0 | 1.0 | 900 | $2,200 | $2.44 | 21d | 1 | 1.09mi |
| 1009 Trout Ave Port Isabel, TX | 2.0 | 2.0 | 1104 | $2,000 | $1.81 | 21d | 1 | 1.11mi |
| 1009 Bass Ave Unit 3 Port Isabel, TX | 2.0 | 1.0 | 946 | $2,000 | $2.11 | 44d | 1 | 1.11mi |
| 401 Island Ave Unit 73B Port Isabel, TX | 2.0 | 1.0 | 872 | $1,600 | $1.83 | 44d | 1 | 1.24mi |
| 1506 Texas 100 Port Isabel, TX | 2.0 | 2.0 | 840 | $2,700 | $3.21 | 44d | 1 | 1.38mi |
HOA detail
- Monthly dues
- $348 · $4,176/yr
- Likely covers
- poolsecurity
Listing history 31 events
-
2026-06-18days on market $195,000 Active 675 DOM
-
2026-06-17days on market $195,000 Active 674 DOM
-
2026-06-16days on market $195,000 Active 673 DOM
-
2026-06-15days on market $195,000 Active 672 DOM
-
2026-06-14days on market $195,000 Active 670 DOM
-
2026-06-13days on market $195,000 Active 669 DOM
-
2026-06-10days on market $195,000 Active 667 DOM
-
2026-06-09days on market $195,000 Active 666 DOM
-
2026-06-09days on market $195,000 Active 665 DOM
-
2026-06-07days on market $195,000 Active 664 DOM
-
2026-06-03days on market $195,000 Active 660 DOM
-
2026-06-02days on market $195,000 Active 659 DOM
-
2026-06-01days on market $195,000 Active 658 DOM
-
2026-05-31days on market $195,000 Active 657 DOM
-
2026-05-30days on market $195,000 Active 656 DOM
-
2026-05-21status Active
-
2026-04-19historical Active Under Contract
-
2026-01-16price $195,000
-
2026-01-06status Active
-
2025-07-05status Active
-
2025-06-19price $218,000
-
2025-01-05status Active
-
2024-09-11price $231,000
-
2024-08-04$241,900 Active
-
2024-07-17price $241,900
-
2024-05-14$259,000 Active
-
2024-02-28$285,000 Active
-
2023-10-20$299,900 Active
-
2023-09-26$319,900 Active
-
2020-08-06soldstatus
-
1997-05-21soldstatus
ⓘ Source: listings_history table (triggers on properties + properties_extension) + one-shot
backfill from property_details.listing_events for pre-trigger history.
Tax reassessment forecast TX · Resets to sale price
- Current annual tax
- $3,869 · $322/mo
- Projected year-2 tax
- $3,869 · $322/mo
- Expected delta
- $0/yr ($0/mo · 0.0%)
ⓘ Screening estimate from a state-policy table — verify with the county assessor before closing.
Climate risk First Street
- Flood 9/10 Extreme FEMA zone AE · 99% chance over 30 yrs
- Wildfire 1/10 Low
- Heat 10/10 Extreme 6 d/yr ≥106°F today · 24 d/yr by 30 yrs out
- Wind 9/10 Extreme 99% chance of damaging wind over 30 yrs
- Air quality 2/10 Low 0 unhealthy d/yr today · 1 by 30 yrs out
Nearby sold comps map
Loading sold comps map…
Walkable amenities ~0.75 mi
Loading nearby amenities…
Taxation est. · year 1
- Rental income
- $31,653
- − Mortgage interest
- −$10,923
- − Property taxes
- −$3,869
- − Insurance
- −$6,094
- − Repairs & maintenance
- −$2,532
- − Management
- −$2,532
- − HOA
- −$4,176
- − Depreciation
- −$5,673
- Taxable loss
- −$4,146
- Est. tax savings @ 24.0%
- +$995
- After-tax cash flow
- $-409/yr
For passive investors: Depreciation is non-cash, so a rental often shows a tax loss while cash-flowing — sheltering income. Rental losses are passive: they offset passive income freely, and up to $25,000/yr can offset ordinary (W-2) income if you actively participate and your MAGI is under $100k (phasing out to $0 by $150k); unused losses carry forward. On sale, claimed depreciation is recaptured at up to 25%, and gains may owe capital-gains tax (a 1031 exchange can defer both). Figures are a year-1 estimate at your 24.0% rate — not tax advice; consult a CPA.
Schools (NCES district)
- District
- Point Isabel ISD
- NCES district ID
- 4835250
- Math proficiency
- 14% ▼ -24.00%
- Reading proficiency
- 31% ▼ -10.00%
- Median HH income
- $38,115
- Composite
- 18.78/100
- National rank
- #8871
- State rank
- #756 of 826 in TX
Livability — Port Isabel
- Score
- 75/100
- State rank
- #157
- US rank
- #4282
Category grades
Schools grade is shown separately in the Schools card above.
Census & demographics
- Population (ZIP)
- 10,231
Population outlook (Cameron County) Hauer SSP2
- Today (2025)
- 441,603 people
- By 2030
- 448,113 · +1.5%
- By 2040
- 456,385 · +3.3%
- By 2050
- 456,294 · +3.3%
- By 2075
- 423,851 · -4.0%
- By 2100
- 342,787 · -22.4%
Race, ethnicity, and origin ACS 2023
- Neighborhood character
- Majority Hispanic (63%)
- Race & ethnicity
- Hispanic / Latino 63% White 35% Two or more races 19%
- Hispanic origin (detail)
- Mexican 59%
- Common ancestry
- Lithuanian 2% Romanian 1% Slovak 1%
- Foreign-born
- 18% · Canada
- Languages at home
- 57% English-only · Spanish 42%
Political lean MEDSL · Cameron
- 2024 margin
- Lean R (+5.8) · D 46.7% · R 52.5%
- 2008→2024 swing
- -34.6pp toward R · 2008: 28.8pp · 2024: -5.8pp
- All cycles
- 2024: R+5.8 2020: D+13.2 2016: D+32.5 2012: D+32.4 2008: D+28.8
Not yet ingested
- Civics
- —
Market trends
- HPI YoY
- ▼ -61.69%
- Current HPI
- 222.9501
- Rent YoY
- —
- Metro
- —
- State GDP YoY
- ▲ 3.95%
- F500 in state
- 110
Industry mix (Fortune 500 HQ in TX)
| Industry | F500 HQs | Revenue |
|---|---|---|
| Energy | 16 | $1,198B |
|
||
| Technology | 5 | $198B |
|
||
| Engineering / Construction | 4 | $72B |
|
||
| Energy Services | 3 | $60B |
|
||
| Utilities | 3 | $41B |
|
||
| Healthcare | 2 | $330B |
|
||
Price history
-39.0% since first listed16 events — show timeline
- 2026-05-21 Relisted — SPIBOR
- 2026-04-19 Contingent — SPIBOR
- 2026-01-16 Price Changed $195,000 SPIBOR
- 2026-01-06 Relisted — SPIBOR
- 2025-07-05 Relisted — SPIBOR
- 2025-06-19 Price Changed $218,000 SPIBOR
- 2025-01-05 Relisted — SPIBOR
- 2024-09-11 Price Changed $231,000 SPIBOR
- 2024-08-04 Listed $241,900 SPIBOR
- 2024-07-17 Price Changed $241,900 MCALLENMLS
- 2024-05-14 Listed $259,000 MCALLENMLS
- 2024-02-28 Listed $285,000 MCALLENMLS
- 2023-10-20 Listed $299,900 MCALLENMLS
- 2023-09-26 Listed $319,900 MCALLENMLS
- 2020-08-06 Sold (Public Records) — Public Records
- 1997-05-21 Sold (Public Records) — Public Records
Property tax history
+8.0%/yrLatest (2025): $3,869 · +1.4% YoY. Source: county tax records.
Cash-flow waterfall
monthlySold comps — $/sqft
last 12 mo · ≤1 miLoading sold comps…