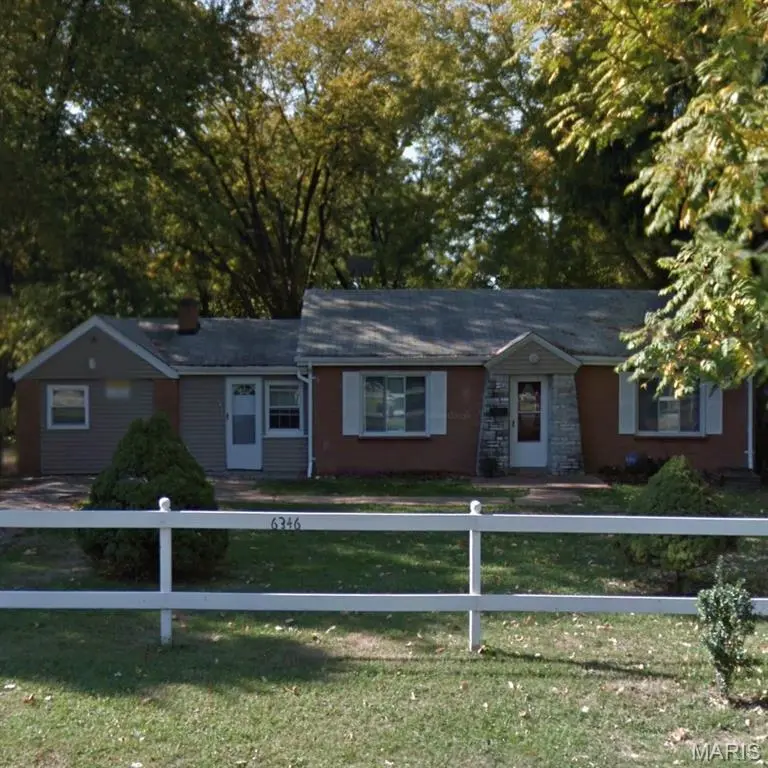
6346 Emma Ave · Jennings, MO
Flood risk 1/10 · Minimal
- FEMA flood zone
- X (unshaded)
- Chance of flooding over 30 yrs
- 0.0%
- Est. flood insurance / yr
- $473 – $860
Fire risk 1/10 · Minimal
- Est. fire insurance / yr
- $1,054 – $1,958
Heat risk 5/10 · Moderate
- Hot days now (above 107°F)
- 7 days/yr
- Hot days in 30 yrs
- 20 days/yr
Wind risk 2/10 · Minimal
- Chance of severe wind over 30 yrs
- 1.0%
Air-quality risk 4/10 · Minor
- Unhealthy air days now
- 4 days/yr
- Unhealthy air days in 30 yrs
- 5 days/yr
Risk factors via First Street. Map © Google.
Why this score? — see what drove the C+ grade
The composite is a weighted blend of 9 inputs, each scored 0–100. Each bar is that input's sub-score; the figure is the points it added to the 100-point composite (weight × sub-score).
- Cash flow +24.4/30.0
- DSCR +7.9/10.0
- ARV discount +7.5/15.0
- Appreciation +6.9/10.0
- 1% rule +5.4/10.0
- Rent growth +3.7/5.0
- Livability +3.4/5.0
- Condition / age +2.5/5.0
- Schools +1.1/10.0
$127,000
🖨 Deal sheet 📄 Offer letter ✓ Due diligence
Listing remarks MLS
This is a Great Opportunity to own a stable investment property. Property can be viewed in the interior with an Accepted Contract. Property is being Sold AS-IS. Seller to do No Repairs. Property has been very well maintained- roof is only 5 years old.
Key facts
- Solid construction
- Highways
- Convenient access
Tags
Property features AI
Exterior
- Utilities: Public water; Public sewer; Electric service by Ameren; Electricity and natural gas available
- Home design: Single-family residence; One story
- Construction: Brick and vinyl siding construction
- Exterior features: Front yard; Back yard
Interior
- Bedrooms: Three bedrooms on the main level
- Bathrooms: One full bathroom on the main level
- Heating & cooling: Natural gas heating; Central air conditioning
- Interior features: Central air
Neighborhood map
What this means for you Summary
Snapshot
- This is a 3-bed/1.0-bath single-family listed at $127k.
Deal economics
- At list price, monthly cash flow is $258 ($3k/yr) — positive.
- The deal already cash-flows at list — no discount required.
- Meets the 1% rule at list price ($1k rent vs $127k).
- Recommended offer: $125k (1.5% below list) — sets the bar for market timing.
- Cap rate 8.7% vs local median 12.2% in Jennings — below-typical yield; the buyer is paying a premium for something (appreciation thesis, condition, location) that the cap rate doesn't capture.
Location & tenants
- Location reads 67/100 on livability (#208 in MO) — a middle-class / working-renter tenant base. Strengths: cost of living A+, commute A-, housing A-; Watch: crime F, amenities F, employment F.
- Jennings (suburban): math 8% / reading 20% proficiency, ranked #315 of 324 in MO (top 97%) — low school quality limits family demand, transient renter base, plan for 1-2y turnover; 86% free/reduced lunch — lower-income household profile, screen leases tightly.
- Zoned schools: Fairview Primary (math 34% / reading 34%, grade F, #676 of 1,115 statewide, top 66%, 267 students, 100% FRL); Jennings High (math 8% / reading 17%, grade F, #497 of 521 statewide, top 96%, 691 students, 100% FRL).
- Market conditions: Rents rising fast (+5.0%/yr); 372 active listings in the ZIP; 23 comparable units currently listed for rent nearby; rentals at typical pace (median 24d on market — plan ~3-4 weeks tenant-placement turnaround); lower-income renter base — watch delinquency; 920 units permitted in St. Louis County in 2024 (250 in 5+ unit buildings).
- This rent runs 39% of the median local income ($41k/yr) — at the standard rent-burdened threshold; future hikes will face affordability resistance.
Forward outlook
- In year one you build about $6k of equity ($878 loan paydown + $5k appreciation (3.8% local appreciation)).
- At projected returns (3.8% appreciation + 5.0% rent growth), your $36k cash investment doubles in ~4 years — after that, you're playing with house money.
- By year 6, paydown + projected appreciation supports a ~$30k cash-out refi (75% LTV) — recoverable capital for the next deal without selling this one.
Negotiation context
- It's been on market 21 days — a 2% lower offer ($125k) is reasonable based on typical stale-listing flexibility.
- 4 sale attempts since 2y ago with the ask held roughly flat each time — persistent listings suggest the price (not the market) is what's stuck; bring a comps-based counter.
Risks & watch-outs
- Watch-outs: built in 1947 — expect roof / HVAC / electrical / plumbing capex.
- Climate carrying-cost: extreme-heat days projected 7→20/yr by 2055 (HVAC capex compounding) — expect insurance premiums to compound above CPI over the hold.
Questions for the listing agent
- Built in 1947 — when were the roof, HVAC, electrical panel, plumbing, and water heater last replaced?
- Is there a deadline driving the sale (1031 exchange, divorce, estate, relocation)? That informs how much negotiation room exists.
- Schools are D-rated, which usually means shorter tenancies and higher turnover. Who's the typical renter profile here, and what's been the actual vacancy rate?
- Crime grade is F in this area — have there been break-ins, vandalism, or insurance claims at this property in the last 3 years? What carrier currently insures it and at what premium?
- What's the average days-on-market for RENTAL listings here right now (not sales)? A rising rental-DOM trend means longer vacancies and softer asking-rent achievability than the comps imply.
- What's the recent tenant-quality profile in this submarket — average credit score on applications, eviction rate, late-payment / NSF rate, and stable-employment percentage? A property-management company in the area should have these aggregated.
- How much new for-sale + rental construction is in the pipeline within 1–3 miles? Heavy new supply typically softens prices + rents 12–24 months out; constrained supply supports both.
Investment metrics
- 1% rule
- 1.04% ✓
- Cap rate
- 8.73%
- Cash-on-cash
- 8.69%
- DSCR
- 1.39
- GRM
- 8.0
CMA / ARV
- ARV (on-the-fly)
- $69,120
- Comps found
- 12
Show comp detail 12 sales within ~0.75 mi
| Address | Dist | Beds/Ba | Sqft | Sold | Price | $/sf | Match |
|---|---|---|---|---|---|---|---|
| 6117 Lalite Ave | 0.37mi | 4/1.0 (+1) | 1,568 (+2%) | 1mo | $55,000 | $35 | 73 |
| 6100 Garesche Ave | 0.35mi | 3/2.5 | 1,456 (-5%) | 2mo | $52,000 | $36 | 67 |
| 6610 W Florissant Ave | 0.48mi | 2/1.5 (-1) | 1,560 (+2%) | 3mo | $59,900 | $38 | 65 |
| 6375 Lillian Ave | 0.48mi | 4/1.0 (+1) | 1,512 (-2%) | 10mo | $75,000 | $50 | 62 |
| 5714 Park Ln | 0.54mi | 2/1.0 (-1) | 1,374 (-10%) | 3mo | $70,000 | $51 | 50 |
| 7205 Emma Ave | 0.68mi | 3/1.0 | 1,687 (+10%) | 10mo | $38,900 | $23 | 44 |
| 5934 Pamplin Ave | 0.66mi | 3/1.0 | 1,436 (-6%) | 20mo | $121,900 | $85 | 42 |
| 8510 Hamilton Ave | 0.67mi | 4/2.0 (+1) | 1,595 (+4%) | 14mo | $90,000 | $56 | 41 |
| 7130 Theodore Ave | 0.64mi | 3/1.5 | 1,308 (-15%) | 13mo | $59,000 | $45 | 32 |
| 6138 N Pointe Blvd | 0.50mi | 4/2.0 (+1) | 1,715 (+12%) | 23mo | $154,900 | $90 | 30 |
| 5816 Vivian Ave | 0.70mi | 3/1.0 | 1,764 (+15%) | 19mo | $57,200 | $32 | 27 |
| 2050 Belle Ave | 0.73mi | 2/1.0 (-1) | 1,312 (-15%) | 16mo | $15,000 | $11 | 23 |
Match score weights: distance 35% · size 25% · config 20% · recency 20%. Top-matched comps best support the ARV.
Projected returns pro-forma
3.79% appreciation · 4.97% rent growth · sell at horizon
- IRR
- 18.6%
- Equity multiple
- 2.12×
- Total profit
- $39,731
- Equity at exit
- $62,838
- IRR
- 20.2%
- Equity multiple
- 4.27×
- Total profit
- $116,207
- Equity at exit
- $101,557
Cash invested: $35,560 (down + closing). Projections, not guarantees.
Landlord ↔ Tenant lean methodology
- Overall (STATE)
- 81 Strongly Landlord-Friendly
- State Missouri
- 81 Strongly Landlord-Friendly · R+10
- County
- — inherits STATE
- City
- — inherits STATE
ZIP-level market 63136
- Home prices YoY
- 0.9%
- Rents YoY
- 5.0%
- Active inventory
- 372
- Price-to-rent
- 8.0×
Monthly cashflow live
- Estimated rent
- $1,323 high interval (Pro) →
- Mortgage (P&I)
- −$666
- Tax from tax record
- −$69 /mo · $825/yr
- Insurance
- −$53
- HOA
- −$0
- Vacancy / Maint / Mgmt
- −$278
- Net cashflow
- $258
Break-even live
UW: 25.0% down · 7.5% · 30yr · 1.5% tax · 5.0% vac · 8.0% maint · 8.0% mgmt
Financing live
Cash to close
- Down payment
- $31,750
- Closing costs
- $3,810
- Reserves months
- —
- Total cash needed
- —
Loan-product check · same deal, 3 products live
Conventional
25% down · 7.5% · 30yr
- Down + closing
- —
- Monthly P&I
- —
- Monthly cashflow
- —
- DSCR
- —
- Eligible?
- —
Personal DTI + credit; lowest rate.
DSCR
20% down · 8.5% · 30yr
- Down + closing
- —
- Monthly P&I
- —
- Monthly cashflow
- —
- DSCR
- —
- Eligible?
- —
No personal income docs; deal must DSCR.
Hard money
10% down · 12.0% · 12mo
- Down + closing
- —
- Monthly P&I
- —
- Monthly cashflow
- —
- DSCR
- —
- Eligible?
- —
Short-term bridge; refi at stabilization.
Rent comps 23 comps
| Address | Beds | Baths | Sqft | Rent | $/sqft | DOM | Units | Dist |
|---|---|---|---|---|---|---|---|---|
| 5515 Wilborn Dr Saint Louis, MO | 3.0 | 1.0 | 1248 | $1,400 | $1.12 | 43d | 1 | 0.05mi |
| 5612 Hodiamont Ave Saint Louis, MO | 3.0 | 1.5 | 1200 | $1,150 | $0.96 | 10d | 1 | 0.20mi |
| 5664 Hamilton Ave Saint Louis, MO | 2.0 | 2.0 | 1700 | $1,600 | $0.94 | 43d | 1 | 0.29mi |
| 5756 Floy Ave Saint Louis, MO | 2.0 | 1.0 | 1080 | $995 | $0.92 | 43d | 1 | 0.38mi |
| 5637 Jennings Station Rd Saint Louis, MO | 3.0 | 1.0 | 1116 | $895 | $0.80 | 43d | 1 | 0.40mi |
| 5944 Thekla Ave Saint Louis, MO | 2.0 | 1.0 | 1760 | $975 | $0.55 | 43d | 1 | 0.50mi |
| 7121 Garesche Ave Saint Louis, MO | 3.0 | 1.0 | 1156 | $1,200 | $1.04 | 43d | 1 | 0.51mi |
| 5932 Floy Ave Saint Louis, MO | 3.0 | 1.0 | 1080 | $1,373 | $1.27 | 20d | 1 | 0.56mi |
| 5730 Park Ln Saint Louis, MO | 4.0 | 1.0 | 1174 | $1,600 | $1.36 | 20d | 1 | 0.57mi |
| 7120 Greenhaven Dr Saint Louis, MO | 3.0 | 2.0 | 1131 | $1,050 | $0.93 | 23d | 1 | 0.58mi |
| 5516 Fairridge Ct Saint Louis, MO | 2.0 | 1.0 | 1110 | $995 | $0.90 | 23d | 1 | 0.60mi |
| 8502 Dianthus Ln Saint Louis, MO | 2.0 | 1.0 | 1072 | $1,175 | $1.10 | 23d | 1 | 0.65mi |
| 7218 Albright Ave Saint Louis, MO | 2.0 | 1.0 | 1100 | $980 | $0.89 | 23d | 1 | 0.71mi |
| 2022 McLaran Ave Saint Louis, MO | 3.0 | 2.0 | 1181 | $1,593 | $1.35 | 14d | 1 | 0.83mi |
| 8548 Drury Ln Saint Louis, MO | 3.0 | 2.0 | 1107 | $1,420 | $1.28 | 43d | 1 | 0.91mi |
| 4914 Plover Ave Saint Louis, MO | 3.0 | 2.0 | 1248 | $925 | $0.74 | 23d | 1 | 0.98mi |
| 4737 Plover Ave Saint Louis, MO | 4.0 | 1.5 | 1200 | $1,400 | $1.17 | 43d | 1 | 1.00mi |
| 7426 Calvin Ave Saint Louis, MO | 2.0 | 1.0 | 1100 | $1,125 | $1.02 | 17d | 1 | 1.08mi |
| 7441 Calvin Ave Saint Louis, MO | 3.0 | 1.0 | 1068 | $1,350 | $1.26 | 12d | 1 | 1.12mi |
| 8817 Shady Grove Ave Saint Louis, MO | 2.0 | 1.0 | 1085 | $1,075 | $0.99 | 23d | 1 | 1.14mi |
| 2646 Terrace Ln Saint Louis, MO | 3.0 | 2.0 | 1565 | $1,275 | $0.81 | 23d | 1 | 1.32mi |
| 44 Jendale Ct Saint Louis, MO | 2.0 | 2.0 | 1820 | $1,350 | $0.74 | 23d | 1 | 1.42mi |
| 5338 Claxton Ave Unit 33 St. Louis, MO | 3.0 | 2.0 | 1196 | $1,550 | $1.30 | 43d | 1 | 1.43mi |
Listing history 19 events
-
2026-06-18days on market $127,000 Active 21 DOM
-
2026-06-17days on market $127,000 Active 20 DOM
-
2026-06-16days on market $127,000 Active 19 DOM
-
2026-06-15days on market $127,000 Active 18 DOM
-
2026-06-13days on market $127,000 Active 16 DOM
-
2026-06-09days on market $127,000 Active 12 DOM
-
2026-06-08days on market $127,000 Active 11 DOM
-
2026-06-07days on market $127,000 Active 10 DOM
-
2026-06-03days on market $127,000 Active 6 DOM
-
2026-06-02days on market $127,000 Active 5 DOM
-
2026-06-01days on market $127,000 Active 4 DOM
-
2026-05-31days on market $127,000 Active 3 DOM
-
2026-05-28$127,000 Active
-
2026-01-14status Active
-
2026-01-10$127,000 Active
-
2026-01-09historical
-
2024-03-26soldstatus Closed 256-char remark
Show marketing remark (256 chars)
This is a Great Opportunity to own a stable investment property. Property can be viewed in the interior with an Accepted Contract. Property is being Sold AS-IS. Seller to do No Repairs. Property has been very well maintained- roof is only 5 years old.
-
2024-02-14status Pending 256-char remark
Show marketing remark (256 chars)
This is a Great Opportunity to own a stable investment property. Property can be viewed in the interior with an Accepted Contract. Property is being Sold AS-IS. Seller to do No Repairs. Property has been very well maintained- roof is only 5 years old.
-
2024-01-16$75,500 Active 256-char remark
Show marketing remark (256 chars)
This is a Great Opportunity to own a stable investment property. Property can be viewed in the interior with an Accepted Contract. Property is being Sold AS-IS. Seller to do No Repairs. Property has been very well maintained- roof is only 5 years old.
ⓘ Source: listings_history table (triggers on properties + properties_extension) + one-shot
backfill from property_details.listing_events for pre-trigger history.
Tax reassessment forecast MO · Resets to sale price
- Current annual tax
- $825 · $69/mo
- Projected year-2 tax
- $1,232 · $103/mo
- Expected delta
- +$407/yr (+$34/mo · 49.4%)
ⓘ Screening estimate from a state-policy table — verify with the county assessor before closing.
Climate risk First Street
- Flood 1/10 Low FEMA zone X (unshaded) · 0% chance over 30 yrs
- Wildfire 1/10 Low
- Heat 5/10 Major 7 d/yr ≥107°F today · 20 d/yr by 30 yrs out
- Wind 2/10 Low 100% chance of damaging wind over 30 yrs
- Air quality 4/10 Moderate 4 unhealthy d/yr today · 5 by 30 yrs out
Nearby sold comps map
Loading sold comps map…
Walkable amenities ~0.75 mi
Loading nearby amenities…
Taxation est. · year 1
- Rental income
- $15,876
- − Mortgage interest
- −$7,114
- − Property taxes
- −$825
- − Insurance
- −$635
- − Repairs & maintenance
- −$1,270
- − Management
- −$1,270
- − Depreciation
- −$3,695
- Taxable income
- $1,068
- Est. tax owed @ 24.0%
- −$256
- After-tax cash flow
- $2,834/yr
For passive investors: Depreciation is non-cash, so a rental often shows a tax loss while cash-flowing — sheltering income. Rental losses are passive: they offset passive income freely, and up to $25,000/yr can offset ordinary (W-2) income if you actively participate and your MAGI is under $100k (phasing out to $0 by $150k); unused losses carry forward. On sale, claimed depreciation is recaptured at up to 25%, and gains may owe capital-gains tax (a 1031 exchange can defer both). Figures are a year-1 estimate at your 24.0% rate — not tax advice; consult a CPA.
Schools (NCES district)
- District
- Jennings
- NCES district ID
- 2916290
- Math proficiency
- 8% ▼ -16.00%
- Reading proficiency
- 20% ▼ -4.00%
- Median HH income
- $30,595
- Composite
- 11.04/100
- National rank
- #9739
- State rank
- #315 of 324 in MO
Livability — Jennings
- Score
- 67/100
- State rank
- #208
- US rank
- #10499
Category grades
Schools grade is shown separately in the Schools card above.
Census & demographics
- Census place
- Jennings, MO
- County
- Saint Louis County · 888,823 people
- Metro
- St. Louis, MO-IL
- Population (ZIP)
- 40,929
- Household income
- $41,154
- Rent vs Own
- Severe rent burden
- 3085.0
Population outlook (St. Louis County) Hauer SSP2
- Today (2025)
- 1,025,227 people
- By 2030
- 1,028,023 · +0.3%
- By 2040
- 1,020,940 · -0.4%
- By 2050
- 1,007,280 · -1.8%
- By 2075
- 987,277 · -3.7%
- By 2100
- 921,984 · -10.1%
Race, ethnicity, and origin ACS 2023
- Neighborhood character
- Predominantly Black (90%)
- Race & ethnicity
- Black 90% White 5% Two or more races 3%
- Foreign-born
- 1% · Canada
Political lean MEDSL · St. Louis
- 2024 margin
- Strong D (+23.4) · D 60.8% · R 37.4% · Other 1.7%
- 2008→2024 swing
- +3.5pp toward D · 2008: 19.9pp · 2024: 23.4pp
- All cycles
- 2024: D+23.4 2020: D+24.0 2016: D+16.2 2012: D+13.7 2008: D+19.9
Not yet ingested
- Civics
- —
Market trends
- HPI YoY
- ▲ 3.79%
- Current HPI
- 420.28
- Rent YoY
- ▲ 4.97%
- Metro
- St. Louis, MO-IL
- State GDP YoY
- ▲ 1.84%
- F500 in state
- 20
Industry mix (Fortune 500 HQ in MO)
| Industry | F500 HQs | Revenue |
|---|---|---|
| Healthcare | 1 | $163B |
|
||
| Insurance | 1 | $21B |
|
||
| Industrial Technology | 1 | $17B |
|
||
| Retail | 1 | $16B |
|
||
| Industrial Distribution | 1 | $10B |
|
||
| Utilities | 1 | $9B |
|
||
Price history
+68.2% since first listed7 events — show timeline
- 2026-05-28 Listed $127,000 MARIS as Distributed by MLS Grid
- 2026-01-14 Relisted — MARIS as Distributed by MLS Grid
- 2026-01-10 Listed $127,000 MARIS as Distributed by MLS Grid
- 2026-01-09 Coming Soon — MARIS as Distributed by MLS Grid
- 2024-03-26 Sold (MLS) — MARIS as Distributed by MLS Grid
- 2024-02-14 Pending — MARIS as Distributed by MLS Grid
- 2024-01-16 Listed $75,500 MARIS as Distributed by MLS Grid
Property tax history
-3.2%/yrLatest (2022): $825 · +1.5% YoY. Source: county tax records.
Cash-flow waterfall
monthlySold comps — $/sqft
last 12 mo · ≤1 miLoading sold comps…