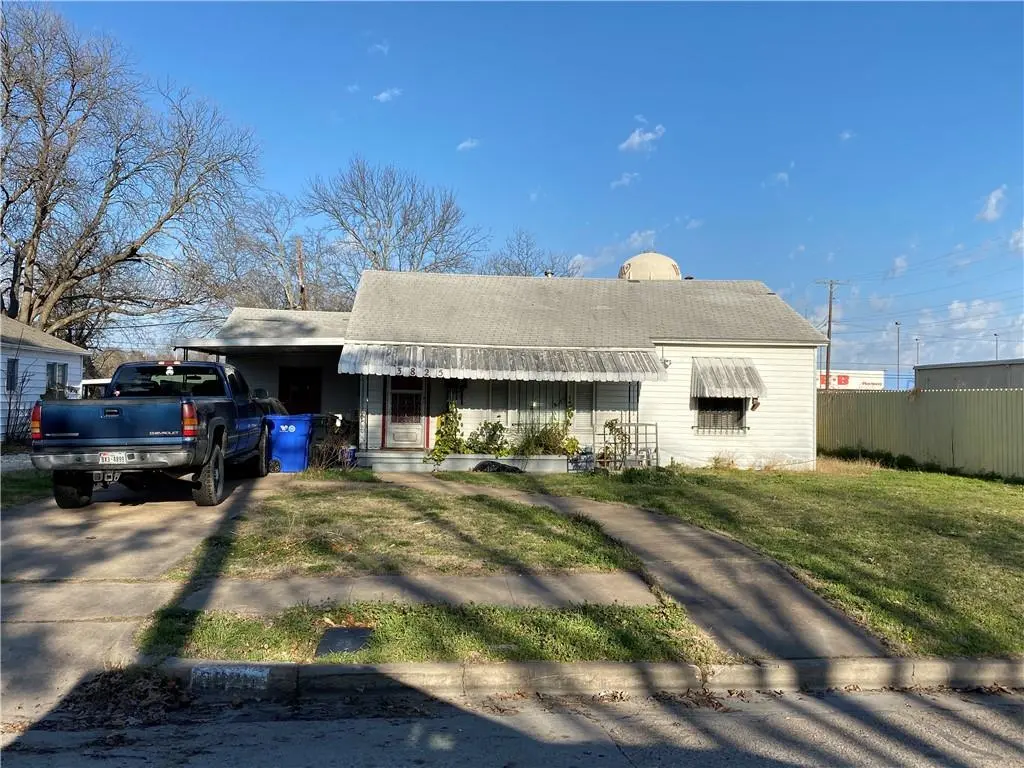
3825 N 20th · Waco, TX
Flood risk 1/10 · Minimal
- FEMA flood zone
- X (unshaded)
- Chance of flooding over 30 yrs
- 0.0%
- Est. flood insurance / yr
- $507 – $1,088
Fire risk 3/10 · Minor
- Est. fire insurance / yr
- $1,222 – $2,270
Heat risk 7/10 · Major
- Hot days now (above 109°F)
- 7 days/yr
- Hot days in 30 yrs
- 24 days/yr
Wind risk 6/10 · Moderate
- Chance of severe wind over 30 yrs
- 56.0%
Air-quality risk 2/10 · Minimal
- Unhealthy air days now
- 0 days/yr
- Unhealthy air days in 30 yrs
- 1 days/yr
Risk factors via First Street. Map © Google.
Why this score? — see what drove the C grade
The composite is a weighted blend of 9 inputs, each scored 0–100. Each bar is that input's sub-score; the figure is the points it added to the 100-point composite (weight × sub-score).
- Cash flow +21.3/30.0
- ARV discount +13.8/15.0
- DSCR +6.8/10.0
- 1% rule +5.1/10.0
- Livability +3.7/5.0
- Condition / age +2.5/5.0
- Rent growth +2.3/5.0
- Schools +1.8/10.0
- Appreciation +0.0/10.0
$123,000
🖨 Deal sheet 📄 Offer letter ✓ Due diligence
Listing remarks MLS
This 2/1 has great potential for maximizing rental income. Property is currently occupied by a Tenant. Lease details upon request. This property can be sold as a one-off or grouped with other properties as an investment package. For further details, please ask.
Key facts
- 8,063 sq ft lot
- Garage
- Built 1950
Neighborhood map
What this means for you Summary
Snapshot
- This is a 2-bed/1.0-bath single-family listed at $123k.
Deal economics
- At list price, monthly cash flow is $181 ($2k/yr) — positive.
- The deal already cash-flows at list — no discount required.
- Meets the 1% rule at list price ($1k rent vs $123k).
- Recommended offer: $108k (12.0% below list) — sets the bar for market timing.
- Cap rate 8.1% vs local median 3.9% in Waco — top-decile yield for the area; either an underpriced asset or a hidden risk that comps aren't pricing in. Stress-test before assuming the spread holds.
Location & tenants
- Location reads 74/100 on livability (#166 in TX, #4,378 nationally) — a middle-class / working-renter tenant base. Strengths: cost of living A+, housing A+, health & safety A+; Watch: schools D, crime D, commute F.
- Waco ISD (urban): math 20% / reading 24% proficiency, ranked #773 of 826 in TX (top 94%) — low school quality limits family demand, transient renter base, plan for 1-2y turnover; 81% free/reduced lunch — lower-income household profile, screen leases tightly.
- Market conditions: Rents soft (-0.8%/yr); 376 active listings in the ZIP; 22 comparable units currently listed for rent nearby; rentals at typical pace (median 21d on market — plan ~3-4 weeks tenant-placement turnaround); 1,014 units permitted in McLennan County in 2024 (200 in 5+ unit buildings).
Forward outlook
- Local home prices are declining (-3.0%/yr); year-one equity from $850 of loan paydown is wiped out by about $4k of value loss. Plan a longer hold.
- McLennan County population projected at +17% by 2050 — long-run rental-demand tailwind backs the buy-and-hold thesis.
Negotiation context
- It's been on market 429 days — a 12% lower offer ($108k) is reasonable based on typical stale-listing flexibility.
- 3 sale attempts since 9y ago with the ask held roughly flat each time — persistent listings suggest the price (not the market) is what's stuck; bring a comps-based counter.
Risks & watch-outs
- Watch-outs: built in 1950 — expect roof / HVAC / electrical / plumbing capex.
- Climate carrying-cost: major wind risk, 56% chance of damaging wind over 30y; extreme-heat days projected 7→24/yr by 2055 (HVAC capex compounding) — expect insurance premiums to compound above CPI over the hold.
Questions for the listing agent
- It's been on market 429 days. Have you received any prior offers? Is the seller open to a 12% concession, seller financing, or rate buy-down credit?
- Built in 1950 — when were the roof, HVAC, electrical panel, plumbing, and water heater last replaced?
- Why hasn't it sold? Are there any deal-killer items the seller is aware of (foundation, flood, title, zoning, code violations)?
- Is there a deadline driving the sale (1031 exchange, divorce, estate, relocation)? That informs how much negotiation room exists.
- Schools are D-rated, which usually means shorter tenancies and higher turnover. Who's the typical renter profile here, and what's been the actual vacancy rate?
- Crime grade is D in this area — have there been break-ins, vandalism, or insurance claims at this property in the last 3 years? What carrier currently insures it and at what premium?
- What's the average days-on-market for RENTAL listings here right now (not sales)? A rising rental-DOM trend means longer vacancies and softer asking-rent achievability than the comps imply.
- What's the recent tenant-quality profile in this submarket — average credit score on applications, eviction rate, late-payment / NSF rate, and stable-employment percentage? A property-management company in the area should have these aggregated.
- How much new for-sale + rental construction is in the pipeline within 1–3 miles? Heavy new supply typically softens prices + rents 12–24 months out; constrained supply supports both.
Investment metrics
- 1% rule
- 1.01% ✓
- Cap rate
- 8.06%
- Cash-on-cash
- 6.30%
- DSCR
- 1.28
- GRM
- 8.3
CMA / ARV
- ARV (median comp)
- $142,860
- List price
- $123,000
- Delta
- -13.90%
- Verdict
- UNDERPRICED
- Comps
- 20 within 1.0 mi
Show comp detail 12 sales within ~0.75 mi
| Address | Dist | Beds/Ba | Sqft | Sold | Price | $/sf | Match |
|---|---|---|---|---|---|---|---|
| 3525 N 25th St | 0.51mi | 2/1.0 | 819 (-0%) | 4mo | $110,000 | $134 | 72 |
| 3209 N 23rd St | 0.58mi | 2/1.0 | 818 (-0%) | 5mo | $149,000 | $182 | 69 |
| 3208 N 20th St | 0.53mi | 2/1.0 | 792 (-3%) | 18mo | $159,900 | $202 | 54 |
| 3301 N 24th St | 0.57mi | 2/1.0 | 865 (+6%) | 12mo | $145,000 | $168 | 54 |
| 3528 N 25th St | 0.53mi | 2/1.0 | 924 (+13%) | 1mo | $150,000 | $162 | 53 |
| 3628 N 24th St | 0.40mi | 2/1.0 | 728 (-11%) | 14mo | $165,000 | $227 | 51 |
| 3113 N 25th St | 0.70mi | 2/1.0 | 812 (-1%) | 18mo | $85,000 | $105 | 50 |
| 1617 Blackmon St | 0.68mi | 2/1.0 | 720 (-12%) | 4mo | $210,000 | $292 | 45 |
| 3208 N 24th St | 0.62mi | 2/1.0 | 728 (-11%) | 16mo | $145,000 | $199 | 39 |
| 1709 Wilson Ave | 0.54mi | 3/1.0 (+1) | 924 (+13%) | 13mo | $99,998 | $108 | 38 |
| 3220 N 26th St | 0.70mi | 3/1.0 (+1) | 896 (+9%) | 14mo | $171,000 | $191 | 36 |
| 2617 Edna Ave | 0.75mi | 3/1.0 (+1) | 920 (+12%) | 15mo | $134,900 | $147 | 27 |
Match score weights: distance 35% · size 25% · config 20% · recency 20%. Top-matched comps best support the ARV.
Projected returns pro-forma
-3.0% appreciation · 0.0% rent growth · sell at horizon
- IRR
- -9.9%
- Equity multiple
- 0.65×
- Total profit
- $-12,056
- Equity at exit
- $18,340
- IRR
- -5.0%
- Equity multiple
- 0.72×
- Total profit
- $-9,748
- Equity at exit
- $10,635
Cash invested: $34,440 (down + closing). Projections, not guarantees.
Landlord ↔ Tenant lean methodology
- Overall (STATE)
- 87 Strongly Landlord-Friendly
- State Texas
- 87 Strongly Landlord-Friendly · R+5
- County
- — inherits STATE
- City
- — inherits STATE
ZIP-level market 76708
- Home prices YoY
- -26.5%
- Rents YoY
- -0.8%
- Active inventory
- 376
- Price-to-rent
- 8.3×
Monthly cashflow live
- Estimated rent
- $1,238 high interval (Pro) →
- Mortgage (P&I)
- −$645
- Tax from tax record
- −$101 /mo · $1,214/yr
- Insurance
- −$51
- HOA
- −$0
- Vacancy / Maint / Mgmt
- −$260
- Net cashflow
- $181
Break-even live
UW: 25.0% down · 7.5% · 30yr · 1.5% tax · 5.0% vac · 8.0% maint · 8.0% mgmt
Financing live
Cash to close
- Down payment
- $30,750
- Closing costs
- $3,690
- Reserves months
- —
- Total cash needed
- —
Loan-product check · same deal, 3 products live
Conventional
25% down · 7.5% · 30yr
- Down + closing
- —
- Monthly P&I
- —
- Monthly cashflow
- —
- DSCR
- —
- Eligible?
- —
Personal DTI + credit; lowest rate.
DSCR
20% down · 8.5% · 30yr
- Down + closing
- —
- Monthly P&I
- —
- Monthly cashflow
- —
- DSCR
- —
- Eligible?
- —
No personal income docs; deal must DSCR.
Hard money
10% down · 12.0% · 12mo
- Down + closing
- —
- Monthly P&I
- —
- Monthly cashflow
- —
- DSCR
- —
- Eligible?
- —
Short-term bridge; refi at stabilization.
Rent comps 22 comps
| Address | Beds | Baths | Sqft | Rent | $/sqft | DOM | Units | Dist |
|---|---|---|---|---|---|---|---|---|
| 2612 Alice Ave Waco, TX | 2.0 | 1.0 | 964 | $1,250 | $1.30 | 21d | 1 | 0.57mi |
| 1611 Bryan Ave Unit B Waco, TX | 3.0 | 1.0 | 838 | $985 | $1.18 | 13d | 1 | 0.62mi |
| 1614 Bryan Ave Unit B Waco, TX | 3.0 | 1.0 | 838 | $925 | $1.10 | 13d | 1 | 0.65mi |
| 2736 Lake Shore Dr Waco, TX | 1.0–2.0 | 1.0–2.0 | 1034 | $1,774 | $1.71 | 13d | 1 | 0.80mi |
| 1500 Lake Shore Dr Waco, TX | 2.0 | 1.0 | 876 | $1,150 | $1.31 | 13d | 1 | 0.82mi |
| 1500 Lake Shore Dr Apt 201 Waco, TX | 2.0 | 1.0 | 876 | $1,050 | $1.20 | 13d | 1 | 0.82mi |
| 1600 Lake Shore Dr Waco, TX | 1.0–3.0 | 1.0–2.0 | 829 | $1,150 | $1.39 | 13d | 1 | 0.85mi |
| 2408 McKenzie Ave Unit A Waco, TX | 3.0 | 2.0 | 872 | $1,350 | $1.55 | 21d | 1 | 0.99mi |
| 2600 McKenzie Ave Waco, TX | 3.0 | 1.0 | 1096 | $1,395 | $1.27 | 21d | 1 | 1.04mi |
| 2313 Mitchell Ave Waco, TX | 2.0 | 1.0 | 804 | $1,150 | $1.43 | 21d | 1 | 1.09mi |
| 2121 Lyle Ave Waco, TX | 2.0 | 1.0 | 1080 | $1,000 | $0.93 | 13d | 1 | 1.13mi |
| 2712 Mitchell Ave Waco, TX | 3.0 | 1.0 | 1120 | $1,300 | $1.16 | 21d | 1 | 1.23mi |
| 2504 Lyle Ave Waco, TX | 3.0 | 2.0 | 1028 | $1,475 | $1.43 | 21d | 1 | 1.23mi |
| 2805 Mitchell Ave Waco, TX | 2.0 | 1.0 | 1024 | $1,145 | $1.12 | 13d | 1 | 1.23mi |
| 1827 Proctor Ave Waco, TX | 2.0 | 1.0 | 600 | $1,000 | $1.67 | 13d | 1 | 1.28mi |
| 1827 Proctor Ave Unit A Waco, TX | 2.0 | 1.0 | 600 | $1,000 | $1.67 | 21d | 1 | 1.28mi |
| 2712 Lyle Ave Waco, TX | 3.0 | 1.0 | 1100 | $1,500 | $1.36 | 43d | 1 | 1.30mi |
| 2712 Lyle Ave Waco, TX | 3.0 | 1.0 | 1100 | $1,500 | $1.36 | 21d | 1 | 1.30mi |
| 2601 Herring Ave Unit 1 Waco, TX | 3.0 | 1.0 | 989 | $1,295 | $1.31 | 43d | 1 | 1.30mi |
| 2404 Proctor Ave Unit 2 Waco, TX | 1.0 | 1.0 | 837 | $950 | $1.14 | 13d | 1 | 1.35mi |
| 2402 Proctor Ave Waco, TX | 1.0 | 1.0 | 1000 | $950 | $0.95 | 13d | 1 | 1.35mi |
| 2404 Proctor Ave Waco, TX | 1.0 | 1.0 | 837 | $1,000 | $1.19 | 21d | 1 | 1.35mi |
Listing history 22 events
-
2026-06-18days on market $123,000 Active 429 DOM
-
2026-06-17days on market $123,000 Active 428 DOM
-
2026-06-16days on market $123,000 Active 427 DOM
-
2026-06-15days on market $123,000 Active 426 DOM
-
2026-06-14days on market $123,000 Active 424 DOM
-
2026-06-13days on market $123,000 Active 423 DOM
-
2026-06-10days on market $123,000 Active 421 DOM
-
2026-06-09days on market $123,000 Active 420 DOM
-
2026-06-08days on market $123,000 Active 419 DOM
-
2026-06-07days on market $123,000 Active 418 DOM
-
2026-06-05days on market $123,000 Active 415 DOM
-
2026-06-03days on market $123,000 Active 414 DOM
-
2026-06-02days on market $123,000 Active 413 DOM
-
2026-06-01days on market $123,000 Active 412 DOM
-
2026-05-31days on market $123,000 Active 411 DOM
-
2026-05-30days on market $123,000 Active 410 DOM
-
2024-10-01$123,000 Active 261-char remark
Show marketing remark (261 chars)
This 2/1 has great potential for maximizing rental income. Property is currently occupied by a Tenant. Lease details upon request. This property can be sold as a one-off or grouped with other properties as an investment package. For further details, please ask.
-
2024-03-22historical
-
2023-06-14$123,000
-
2019-09-16historical
-
2017-12-13$69,700
-
2014-02-21soldstatus
ⓘ Source: listings_history table (triggers on properties + properties_extension) + one-shot
backfill from property_details.listing_events for pre-trigger history.
Tax reassessment forecast TX · Resets to sale price
- Current annual tax
- $1,214 · $101/mo
- Projected year-2 tax
- $2,251 · $188/mo
- Expected delta
- +$1,036/yr (+$86/mo · 85.3%)
ⓘ Screening estimate from a state-policy table — verify with the county assessor before closing.
Climate risk First Street
- Flood 1/10 Low FEMA zone X (unshaded) · 0% chance over 30 yrs
- Wildfire 3/10 Moderate
- Heat 7/10 Severe 7 d/yr ≥109°F today · 24 d/yr by 30 yrs out
- Wind 6/10 Major 56% chance of damaging wind over 30 yrs
- Air quality 2/10 Low 0 unhealthy d/yr today · 1 by 30 yrs out
Nearby sold comps map
Loading sold comps map…
Walkable amenities ~0.75 mi
Loading nearby amenities…
Taxation est. · year 1
- Rental income
- $14,861
- − Mortgage interest
- −$6,890
- − Property taxes
- −$1,214
- − Insurance
- −$615
- − Repairs & maintenance
- −$1,189
- − Management
- −$1,189
- − Depreciation
- −$3,578
- Taxable income
- $185
- Est. tax owed @ 24.0%
- −$44
- After-tax cash flow
- $2,126/yr
For passive investors: Depreciation is non-cash, so a rental often shows a tax loss while cash-flowing — sheltering income. Rental losses are passive: they offset passive income freely, and up to $25,000/yr can offset ordinary (W-2) income if you actively participate and your MAGI is under $100k (phasing out to $0 by $150k); unused losses carry forward. On sale, claimed depreciation is recaptured at up to 25%, and gains may owe capital-gains tax (a 1031 exchange can defer both). Figures are a year-1 estimate at your 24.0% rate — not tax advice; consult a CPA.
Schools (NCES district)
- District
- Waco ISD
- NCES district ID
- 4844280
- Math proficiency
- 20% ▼ -14.00%
- Reading proficiency
- 24% ▼ -6.00%
- Median HH income
- $29,208
- Composite
- 17.57/100
- National rank
- #9043
- State rank
- #773 of 826 in TX
Livability — Waco
- Score
- 74/100
- State rank
- #166
- US rank
- #4378
Category grades
Schools grade is shown separately in the Schools card above.
Census & demographics
- Census place
- Waco, TX
- County
- McLennan County · 213,088 people
- City population
- 125,319
- Metro
- Waco, TX
- Population (ZIP)
- 27,790
- Household income
- $68,856
- Rent vs Own
- Severe rent burden
- 583.0
Population outlook (McLennan County) Hauer SSP2
- Today (2025)
- 264,191 people
- By 2030
- 273,578 · +3.6%
- By 2040
- 291,506 · +10.3%
- By 2050
- 308,044 · +16.6%
- By 2075
- 349,648 · +32.3%
- By 2100
- 364,779 · +38.1%
Race, ethnicity, and origin ACS 2023
- Neighborhood character
- Diverse neighborhood (Simpson 0.63)
- Race & ethnicity
- White 50% Hispanic / Latino 31% Two or more races 20% Black 13% Asian 2%
- Hispanic origin (detail)
- Mexican 28%
- Common ancestry
- Slovak 2% Lithuanian 1% Italian 1%
- Foreign-born
- 11% · Canada, Vietnam
- Languages at home
- 76% English-only · Spanish 21% Other Asian/Pacific 1%
Political lean MEDSL · McLennan
- 2024 margin
- Solid R (+30.9) · D 34.0% · R 64.9% · Other 1.0%
- 2008→2024 swing
- -7.0pp toward R · 2008: -23.9pp · 2024: -30.9pp
- All cycles
- 2024: R+30.9 2020: R+23.4 2016: R+27.1 2012: R+29.8 2008: R+23.9
Not yet ingested
- Civics
- —
Market trends
- HPI YoY
- ▼ -78.80%
- Current HPI
- 218.9643
- Rent YoY
- ▼ -0.80%
- Metro
- Waco, TX
- State GDP YoY
- ▲ 3.95%
- F500 in state
- 110
Industry mix (Fortune 500 HQ in TX)
| Industry | F500 HQs | Revenue |
|---|---|---|
| Energy | 16 | $1,198B |
|
||
| Technology | 5 | $198B |
|
||
| Engineering / Construction | 4 | $72B |
|
||
| Energy Services | 3 | $60B |
|
||
| Utilities | 3 | $41B |
|
||
| Healthcare | 2 | $330B |
|
||
Price history
+76.5% since first listed6 events — show timeline
- 2024-10-01 Listed $123,000 NTREIS
- 2024-03-22 Listing Removed — NTREIS
- 2023-06-14 Listed $123,000 NTREIS
- 2019-09-16 Listing Removed — NTREIS
- 2017-12-13 Listed $69,700 NTREIS
- 2014-02-21 Sold (Public Records) — Public Records
Property tax history
-0.8%/yrLatest (2025): $1,214 · -0.3% YoY. Source: county tax records.
Cash-flow waterfall
monthlySold comps — $/sqft
last 12 mo · ≤1 miLoading sold comps…