67729 195th St · Bartlett, IA
Flood risk 7/10 · Major
- FEMA flood zone
- X (unshaded)
- Chance of flooding over 30 yrs
- 0.76%
- Est. flood insurance / yr
- $507 – $1,088
Fire risk 1/10 · Minimal
- Est. fire insurance / yr
- $902 – $1,676
Heat risk 3/10 · Minor
- Hot days now (above 105°F)
- 7 days/yr
- Hot days in 30 yrs
- 16 days/yr
Wind risk 2/10 · Minimal
- Chance of severe wind over 30 yrs
- —
Air-quality risk 1/10 · Minimal
- Unhealthy air days now
- 0 days/yr
- Unhealthy air days in 30 yrs
- 0 days/yr
Risk factors via First Street. Map © Google.
Why this score? — see what drove the C+ grade
The composite is a weighted blend of 9 inputs, each scored 0–100. Each bar is that input's sub-score; the figure is the points it added to the 100-point composite (weight × sub-score).
- Cash flow +19.4/30.0
- ARV discount +15.0/15.0
- Schools +6.2/10.0
- DSCR +6.1/10.0
- 1% rule +5.2/10.0
- Appreciation +5.1/10.0
- Rent growth +2.5/5.0
- Condition / age +2.5/5.0
- Livability +1.9/5.0
$120,000
🖨 Deal sheet 📄 Offer letter ✓ Due diligence
Listing remarks
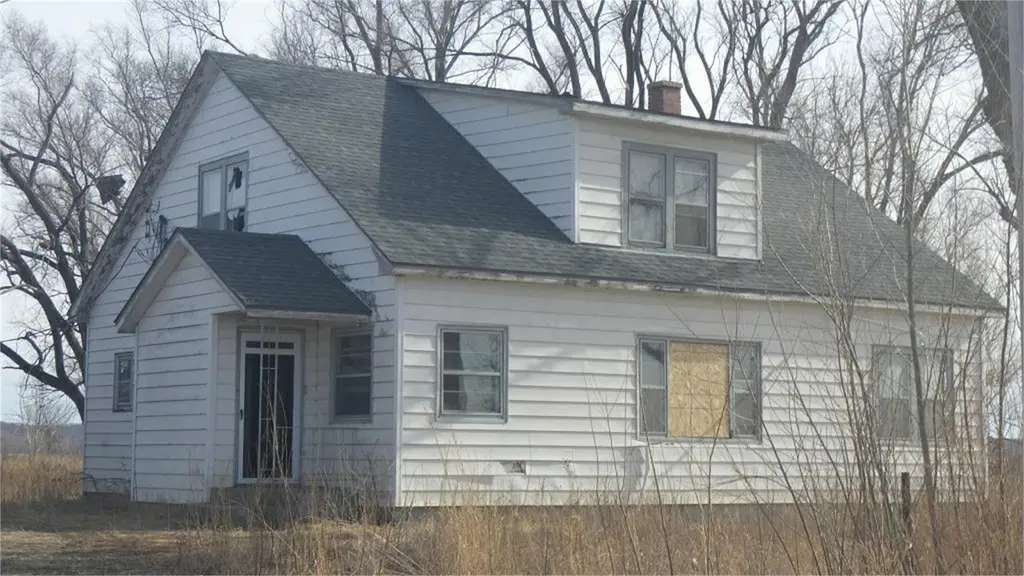
Endless possibilities await on this 7-acre property--just 30 minutes from Omaha! This home has been completely gutted and is ready for your vision to take shape. Whether you're an investor looking for your next rehab project or a homeowner ready to create your dream retreat, the hard part is done--the blank canvas is waiting. The property offers a peaceful rural setting with room to expand, build additional structures, or design the modern farmhouse you've always imagined. Enjoy the best of both worlds-country living with easy access to city conveniences. Opportunities like this are rare--bring your contractor, your imagination, and your blueprints!
Key facts
- 7 acre property
- Blank canvas
- Room to expand
Tags
Property features AI
Exterior
- Parking: Off-street parking; 2-car garage
- Utilities: Private well water; Septic tank; Electricity available
- Home design: Single-family residence; 2-story home; Frame and brick construction
- Construction: Frame and brick construction; Composition roof; Crawl space foundation
- Exterior features: Waterfront lot; Asphalt road access; Composition roof
Interior
- Flooring: Wood floors
- Heating & cooling: Central air; Ceiling fans; Gas and propane heating; Forced air heat
- Interior features: Ceiling fans
- Laundry & utility: Washer hookup on the main level; Crawl space basement (no finished basement)
Neighborhood map
What this means for you Summary
Snapshot
- This is a 2-bed/1.0-bath single-family listed at $120k.
Deal economics
- At list price, monthly cash flow is $68 ($821/yr) — positive.
- The deal already cash-flows at list — no discount required.
- Meets the 1% rule at list price ($1k rent vs $120k).
- Recommended offer: $116k (3.0% below list) — sets the bar for market timing.
Location & tenants
- Location reads 37/100 on livability (#999 in IA) — a limited-amenity area; tenant pool skews transient or value-seeking. Strengths: cost of living A+, crime A; Watch: schools F, amenities F, commute F.
- Fremont-Mills Community School District (rural): math 73% / reading 71% proficiency, ranked #92 of 289 in IA (top 32%) — strong family-tenant draw, lease renewals of 3-5y typical.
- Market conditions: 4 active listings in the ZIP; 39 units permitted in Mills County in 2024 (0 in 5+ unit buildings).
Forward outlook
- In year one you build about $957 of equity ($830 loan paydown + $127 appreciation (0.1% local appreciation)).
- Mills County population projected at -16% by 2050 — secular population decline; favor cash flow + early exit over multi-decade hold.
- At projected returns (0.1% appreciation + 3.0% rent growth), your $34k cash investment doubles in ~10 years — after that, you're playing with house money.
Negotiation context
- It's been on market 51 days — a 3% lower offer ($116k) is reasonable based on typical stale-listing flexibility.
- 4 sale attempts since 24y ago with the ask held roughly flat each time — persistent listings suggest the price (not the market) is what's stuck; bring a comps-based counter.
- Current owner paid $88k; 37% above their basis — modest negotiation headroom, anchor on the comps not their cost.
Risks & watch-outs
- Watch-outs: flood insurance adds $66/mo; built in 1910 — expect roof / HVAC / electrical / plumbing capex.
- Climate carrying-cost: major flood risk — expect insurance premiums to compound above CPI over the hold.
Questions for the listing agent
- It's been on market 51 days. Have you received any prior offers? Is the seller open to a 3% concession, seller financing, or rate buy-down credit?
- Built in 1910 — when were the roof, HVAC, electrical panel, plumbing, and water heater last replaced?
- What's the actual annual flood-insurance premium (NFIP or private), and is the property in a SFHA with mandatory coverage?
- Is there a deadline driving the sale (1031 exchange, divorce, estate, relocation)? That informs how much negotiation room exists.
- Schools are F-rated, which usually means shorter tenancies and higher turnover. Who's the typical renter profile here, and what's been the actual vacancy rate?
- What's the average days-on-market for RENTAL listings here right now (not sales)? A rising rental-DOM trend means longer vacancies and softer asking-rent achievability than the comps imply.
- What's the recent tenant-quality profile in this submarket — average credit score on applications, eviction rate, late-payment / NSF rate, and stable-employment percentage? A property-management company in the area should have these aggregated.
- How much new for-sale + rental construction is in the pipeline within 1–3 miles? Heavy new supply typically softens prices + rents 12–24 months out; constrained supply supports both.
Investment metrics
- 1% rule
- 1.02% ✓
- Cap rate
- 7.64%
- Cash-on-cash
- 4.82%
- DSCR
- 1.21
- GRM
- 8.2
CMA / ARV
- ARV (median comp)
- $225,834
- List price
- $120,000
- Delta
- -46.86%
- Verdict
- UNDERPRICED
- Comps
- 2 within 2.0 mi
Projected returns pro-forma
0.11% appreciation · 3.0% rent growth · sell at horizon
- IRR
- 0.9%
- Equity multiple
- 1.04×
- Total profit
- $1,502
- Equity at exit
- $35,479
- IRR
- 6.4%
- Equity multiple
- 1.70×
- Total profit
- $23,579
- Equity at exit
- $43,158
Cash invested: $33,600 (down + closing). Projections, not guarantees.
Landlord ↔ Tenant lean methodology
- Overall (STATE)
- 83 Strongly Landlord-Friendly
- State Iowa
- 83 Strongly Landlord-Friendly · R+6
- County
- — inherits STATE
- City
- — inherits STATE
ZIP-level market 51561
- Home prices YoY
- 0.1%
- Active inventory
- 4
- Price-to-rent
- 8.2×
Monthly cashflow live
- Estimated rent
- $1,220 medium interval (Pro) →
- Mortgage (P&I)
- −$629
- Tax est. 1.5%
- −$150 /mo · $1,800/yr
- Insurance
- −$50
- Flood insurance flood zone
- −$66 /mo · $798/yr
- HOA
- −$0
- Vacancy / Maint / Mgmt
- −$256
- Net cashflow
- $68
Break-even live
UW: 25.0% down · 7.5% · 30yr · 1.5% tax · 5.0% vac · 8.0% maint · 8.0% mgmt
Financing live
Cash to close
- Down payment
- $30,000
- Closing costs
- $3,600
- Reserves months
- —
- Total cash needed
- —
Loan-product check · same deal, 3 products live
Conventional
25% down · 7.5% · 30yr
- Down + closing
- —
- Monthly P&I
- —
- Monthly cashflow
- —
- DSCR
- —
- Eligible?
- —
Personal DTI + credit; lowest rate.
DSCR
20% down · 8.5% · 30yr
- Down + closing
- —
- Monthly P&I
- —
- Monthly cashflow
- —
- DSCR
- —
- Eligible?
- —
No personal income docs; deal must DSCR.
Hard money
10% down · 12.0% · 12mo
- Down + closing
- —
- Monthly P&I
- —
- Monthly cashflow
- —
- DSCR
- —
- Eligible?
- —
Short-term bridge; refi at stabilization.
Listing history 21 events
-
2026-06-18days on market $120,000 Active 51 DOM
-
2026-06-17days on market $120,000 Active 50 DOM
-
2026-06-16days on market $120,000 Active 49 DOM
-
2026-06-15days on market $120,000 Active 48 DOM
-
2026-06-13days on market $120,000 Active 46 DOM
-
2026-06-10days on market $120,000 Active 43 DOM
-
2026-06-09days on market $120,000 Active 42 DOM
-
2026-06-08days on market $120,000 Active 41 DOM
-
2026-06-07days on market $120,000 Active 40 DOM
-
2026-06-03days on market $120,000 Active 36 DOM
-
2026-06-03days on market $120,000 Active 35 DOM
-
2026-06-01days on market $120,000 Active 34 DOM
-
2026-05-31days on market $120,000 Active 33 DOM
-
2026-04-28$120,000 Active 657-char remark
-
2026-04-15historical
-
2025-11-18price $125,000
-
2025-11-18price $125,000
-
2025-10-16$140,000 New
-
2025-10-16$140,000 Active
-
2004-07-09soldstatus $87,500
-
2002-09-16$87,500
ⓘ Source: listings_history table (triggers on properties + properties_extension) + one-shot
backfill from property_details.listing_events for pre-trigger history.
Climate risk First Street
- Flood 7/10 Severe FEMA zone X (unshaded) · 76% chance over 30 yrs
- Wildfire 1/10 Low
- Heat 3/10 Moderate 7 d/yr ≥105°F today · 16 d/yr by 30 yrs out
- Wind 2/10 Low
- Air quality 1/10 Low 0 unhealthy d/yr today · 0 by 30 yrs out
Nearby sold comps map
Loading sold comps map…
Walkable amenities ~0.75 mi
Loading nearby amenities…
Taxation est. · year 1
- Rental income
- $14,645
- − Mortgage interest
- −$6,722
- − Property taxes
- −$1,800
- − Insurance
- −$1,398
- − Repairs & maintenance
- −$1,172
- − Management
- −$1,172
- − Depreciation
- −$3,491
- Taxable loss
- −$1,108
- Est. tax savings @ 24.0%
- +$266
- After-tax cash flow
- $1,087/yr
For passive investors: Depreciation is non-cash, so a rental often shows a tax loss while cash-flowing — sheltering income. Rental losses are passive: they offset passive income freely, and up to $25,000/yr can offset ordinary (W-2) income if you actively participate and your MAGI is under $100k (phasing out to $0 by $150k); unused losses carry forward. On sale, claimed depreciation is recaptured at up to 25%, and gains may owe capital-gains tax (a 1031 exchange can defer both). Figures are a year-1 estimate at your 24.0% rate — not tax advice; consult a CPA.
Schools (NCES district)
- District
- Fremont-Mills Community School District
- NCES district ID
- 1912120
- Math proficiency
- 73% ▼ -5.00%
- Reading proficiency
- 71% ▲ 1.00%
- Median HH income
- $61,386
- Composite
- 62.13/100
- National rank
- #706
- State rank
- #92 of 289 in IA
Livability — Bartlett
- Score
- 37/100
- State rank
- #999
- US rank
- #27573
Category grades
Schools grade is shown separately in the Schools card above.
Census & demographics
- Population (ZIP)
- 716
Population outlook (Mills County) Hauer SSP2
- Today (2025)
- 14,342 people
- By 2030
- 13,928 · -2.9%
- By 2040
- 12,997 · -9.4%
- By 2050
- 12,123 · -15.5%
- By 2075
- 10,462 · -27.1%
- By 2100
- 9,025 · -37.1%
Race, ethnicity, and origin ACS 2023
- Neighborhood character
- Predominantly White (94%)
- Race & ethnicity
- White 94% Two or more races 5% Hispanic / Latino 3%
- Common ancestry
- Slovak 14% Scottish 6% Romanian 2%
- Foreign-born
- 0% · China
- Languages at home
- 98% English-only · Spanish 1% German/W. Germanic 1%
Political lean MEDSL · Mills
- 2024 margin
- Solid R (+39.1) · D 29.9% · R 69.0% · Other 1.2%
- 2008→2024 swing
- -22.5pp toward R · 2008: -16.6pp · 2024: -39.1pp
- All cycles
- 2024: R+39.1 2020: R+37.2 2016: R+39.0 2012: R+19.1 2008: R+16.6
Not yet ingested
- Civics
- —
Market trends
- HPI YoY
- ▲ 0.11%
- Current HPI
- 94.5113
- Rent YoY
- —
- Metro
- —
- State GDP YoY
- ▲ 2.48%
- F500 in state
- 4
Industry mix (Fortune 500 HQ in IA)
| Industry | F500 HQs | Revenue |
|---|---|---|
| Financial Services | 1 | $16B |
|
||
| Retail / Convenience | 1 | $15B |
|
||
Price history
+37.1% since first listed8 events — show timeline
- 2026-04-28 Listed $120,000 SWIAR
- 2026-04-15 Listing Removed — GPRMLS
- 2025-11-18 Price Changed $125,000 SWIAR
- 2025-11-18 Price Changed $125,000 GPRMLS
- 2025-10-16 Listed $140,000 SWIAR
- 2025-10-16 Listed $140,000 GPRMLS
- 2004-07-09 Sold (MLS) $87,500 SWIAR
- 2002-09-16 Listed $87,500 SWIAR
Property tax history
-24.3%/yrLatest (2025): $226 · -35.8% YoY. Source: county tax records.
Cash-flow waterfall
monthlySold comps — $/sqft
last 12 mo · ≤1 miLoading sold comps…