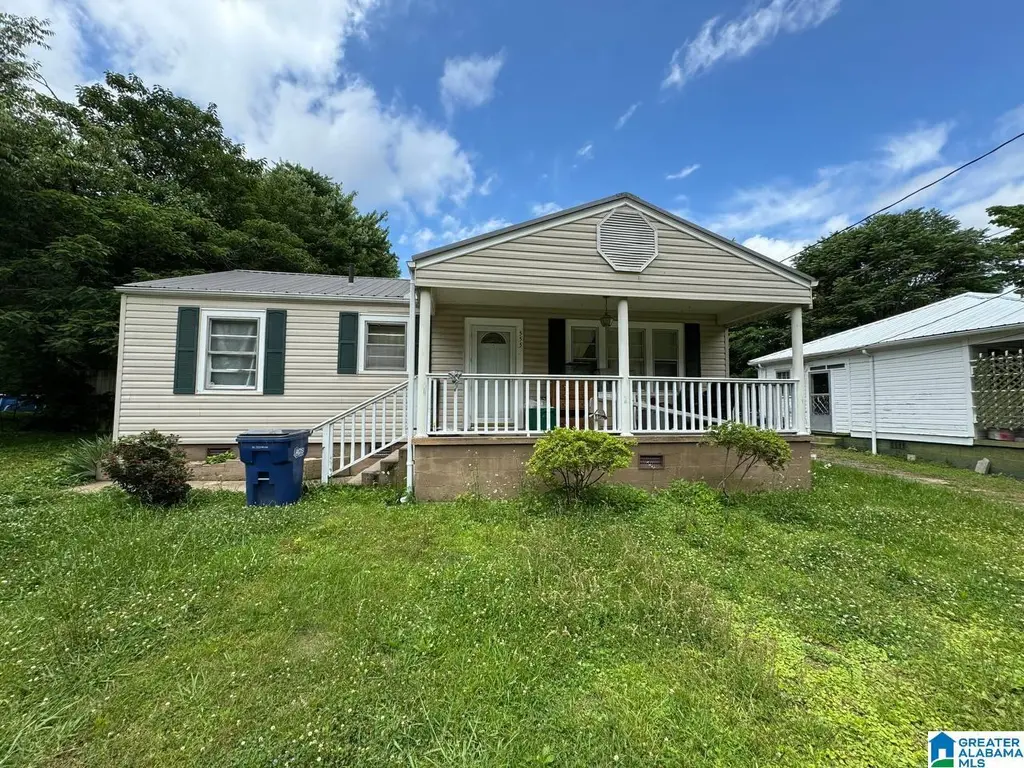
555 5th St NW · Arab, AL
Flood risk 1/10 · Minimal
- FEMA flood zone
- X (unshaded)
- Chance of flooding over 30 yrs
- 0.0%
- Est. flood insurance / yr
- $507 – $1,088
Fire risk 3/10 · Minor
- Est. fire insurance / yr
- $916 – $1,700
Heat risk 4/10 · Minor
- Hot days now (above 103°F)
- 7 days/yr
- Hot days in 30 yrs
- 20 days/yr
Wind risk 4/10 · Minor
- Chance of severe wind over 30 yrs
- 21.0%
Air-quality risk 2/10 · Minimal
- Unhealthy air days now
- 1 days/yr
- Unhealthy air days in 30 yrs
- 3 days/yr
Risk factors via First Street. Map © Google.
Why this score? — see what drove the B- grade
The composite is a weighted blend of 9 inputs, each scored 0–100. Each bar is that input's sub-score; the figure is the points it added to the 100-point composite (weight × sub-score).
- Cash flow +29.7/30.0
- DSCR +10.0/10.0
- ARV discount +7.5/15.0
- 1% rule +7.3/10.0
- Schools +4.7/10.0
- Livability +3.2/5.0
- Rent growth +2.5/5.0
- Condition / age +2.5/5.0
- Appreciation +0.0/10.0
$100,000
🖨 Deal sheet 📄 Offer letter ✓ Due diligence
Listing remarks MLS
This super cute remodeled home has 3 bedrooms and 1 updated bath, large living room, dining room and an office area. Hardwood floors, new metal roof, new water heater, fresh paint and a front porch swing that is just waiting for you! Step out to the fenced back yard and you'll find a great workshop, storage shed and an oversized concrete carport. Located in the middle of Arab and convenient to shopping and schools.
Key facts
- Metal roof
- Flexible office area
- Large living room
Tags
Property features AI
Finance
- Other: Parcel ID included in public records; Approximately 0.2 acre lot; Located in TIDMORE ADDITION subdivision
- HOA & community: No association fees
Exterior
- Parking: Driveway parking
- Utilities: Public water; Septic system; Electric water heater; Internet service availability unknown
- Home design: Existing single-family-style home
- Construction: Vinyl siding; Crawl space foundation
- Exterior features: Front porch
Interior
- Kitchen: Dishwasher (built-in); Refrigerator; Electric stove
- Bedrooms: Three bedrooms, all on the main level
- Flooring: Vinyl flooring
- Bathrooms: One full bathroom with tub/shower combo (main level)
- Heating & cooling: Central heating; Central air conditioning
- Interior features: Smooth ceilings; Solid surface kitchen countertops; No interior special features listed
- Laundry & utility: Washer hookup; Electric dryer hookup; Laundry located on the main level in a closet
Neighborhood map
What this means for you Summary
Snapshot
- This is a 3-bed/1.0-bath single-family listed at $100k.
Deal economics
- At list price, monthly cash flow is $365 ($4k/yr) — positive.
- The deal already cash-flows at list — no discount required.
- Meets the 1% rule at list price ($1k rent vs $100k).
- Recommended offer: $98k (1.5% below list) — sets the bar for market timing.
- Cap rate 10.7% vs local median 3.0% in Arab — top-decile yield for the area; either an underpriced asset or a hidden risk that comps aren't pricing in. Stress-test before assuming the spread holds.
Location & tenants
- Location reads 64/100 on livability (#149 in AL) — a middle-class / working-renter tenant base. Strengths: cost of living A+, housing A+; Watch: employment C-, crime D, amenities F.
- Arab City (rural): math 47% / reading 64% proficiency, ranked #9 of 129 in AL (top 7%) — acceptable for families but not a draw, mixed tenant base, ~2y average lease.
- Zoned schools: Arab Primary School (702 students, 44% FRL); Arab High School (math 37% / reading 47%, grade F, #28 of 305 statewide, top 10%, 779 students, 40% FRL).
- Zoned-school proficiency averages 42% at this address vs 56% district-wide (-14 pts) — the specific schools serving this property underperform the Arab City average; the district grade overstates school quality for this exact location.
- Market conditions: 178 active listings in the ZIP; 7 comparable units currently listed for rent nearby; rentals leasing fast (median 14d on market — plan ~1-2 weeks tenant-placement turnaround); 163 units permitted in Marshall County in 2024 (0 in 5+ unit buildings).
Forward outlook
- Local home prices are declining (-3.0%/yr); year-one equity from $691 of loan paydown is wiped out by about $3k of value loss. Plan a longer hold.
- At projected returns (-3.0% appreciation + 3.0% rent growth), your $28k cash investment doubles in ~8 years — after that, you're playing with house money.
Negotiation context
- It's been on market 22 days — a 2% lower offer ($98k) is reasonable based on typical stale-listing flexibility.
- 2 sale attempts since 9y ago with the ask held roughly flat each time — persistent listings suggest the price (not the market) is what's stuck; bring a comps-based counter.
- Current owner paid $72k; 39% above their basis — modest negotiation headroom, anchor on the comps not their cost.
Risks & watch-outs
- Watch-outs: built in 1951 — expect roof / HVAC / electrical / plumbing capex.
Questions for the listing agent
- Built in 1951 — when were the roof, HVAC, electrical panel, plumbing, and water heater last replaced?
- Is there a deadline driving the sale (1031 exchange, divorce, estate, relocation)? That informs how much negotiation room exists.
- Crime grade is D in this area — have there been break-ins, vandalism, or insurance claims at this property in the last 3 years? What carrier currently insures it and at what premium?
- What's the average days-on-market for RENTAL listings here right now (not sales)? A rising rental-DOM trend means longer vacancies and softer asking-rent achievability than the comps imply.
- What's the recent tenant-quality profile in this submarket — average credit score on applications, eviction rate, late-payment / NSF rate, and stable-employment percentage? A property-management company in the area should have these aggregated.
- How much new for-sale + rental construction is in the pipeline within 1–3 miles? Heavy new supply typically softens prices + rents 12–24 months out; constrained supply supports both.
Investment metrics
- 1% rule
- 1.23% ✓
- Cap rate
- 10.67%
- Cash-on-cash
- 15.63%
- DSCR
- 1.70
- GRM
- 6.8
CMA / ARV
- ARV (on-the-fly)
- $214,240
- Comps found
- 12
Show comp detail 12 sales within ~0.75 mi
| Address | Dist | Beds/Ba | Sqft | Sold | Price | $/sf | Match |
|---|---|---|---|---|---|---|---|
| 606 N Main St | 0.28mi | 3/1.5 | 1,375 (+3%) | 12mo | $194,900 | $142 | 71 |
| 104 Guntersville Rd | 0.37mi | 3/1.0 | 1,224 (-9%) | 3mo | $160,000 | $131 | 66 |
| 853 NW 4th Ave | 0.54mi | 3/1.0 | 1,248 (-7%) | 3mo | $200,000 | $160 | 61 |
| 872 1st Way NE | 0.55mi | 3/2.0 | 1,406 (+5%) | 3mo | $286,999 | $204 | 59 |
| 106 Voltz Dr | 0.42mi | 3/2.0 | 1,200 (-10%) | 4mo | $205,000 | $171 | 55 |
| 204 10th Ave | 0.71mi | 3/1.0 | 1,312 (-2%) | 11mo | $201,000 | $153 | 55 |
| 500 4th St NE | 0.64mi | 3/1.0 | 1,219 (-9%) | 1mo | $110,000 | $90 | 54 |
| 423 Shoal Creek Trl NE | 0.73mi | 3/2.0 | 1,417 (+6%) | 2mo | $260,000 | $183 | 50 |
| 476 NE 2nd St | 0.42mi | 3/2.0 | 1,499 (+12%) | 8mo | $240,000 | $160 | 50 |
| 147 NW 10th St | 0.75mi | 3/2.0 | 1,270 (-5%) | 12mo | $219,900 | $173 | 43 |
| 161 2nd St SW | 0.73mi | 3/1.0 | 1,198 (-10%) | 13mo | $108,000 | $90 | 38 |
| 303 4th Ave NE | 0.58mi | 3/2.0 | 1,516 (+13%) | 14mo | $257,000 | $170 | 35 |
Match score weights: distance 35% · size 25% · config 20% · recency 20%. Top-matched comps best support the ARV.
Projected returns pro-forma
-3.0% appreciation · 3.0% rent growth · sell at horizon
- IRR
- 6.4%
- Equity multiple
- 1.25×
- Total profit
- $6,982
- Equity at exit
- $14,910
- IRR
- 15.7%
- Equity multiple
- 2.28×
- Total profit
- $35,841
- Equity at exit
- $8,646
Cash invested: $28,000 (down + closing). Projections, not guarantees.
Landlord ↔ Tenant lean methodology
- Overall (STATE)
- 90 Strongly Landlord-Friendly
- State Alabama
- 90 Strongly Landlord-Friendly · R+15
- County
- — inherits STATE
- City
- — inherits STATE
ZIP-level market 35016
- Home prices YoY
- -28.0%
- Active inventory
- 178
- Price-to-rent
- 6.8×
Monthly cashflow live
- Estimated rent
- $1,227 high interval (Pro) →
- Mortgage (P&I)
- −$524
- Tax from tax record
- −$39 /mo · $465/yr
- Insurance
- −$42
- HOA
- −$0
- Vacancy / Maint / Mgmt
- −$258
- Net cashflow
- $365
Break-even live
UW: 25.0% down · 7.5% · 30yr · 1.5% tax · 5.0% vac · 8.0% maint · 8.0% mgmt
Financing live
Cash to close
- Down payment
- $25,000
- Closing costs
- $3,000
- Reserves months
- —
- Total cash needed
- —
Loan-product check · same deal, 3 products live
Conventional
25% down · 7.5% · 30yr
- Down + closing
- —
- Monthly P&I
- —
- Monthly cashflow
- —
- DSCR
- —
- Eligible?
- —
Personal DTI + credit; lowest rate.
DSCR
20% down · 8.5% · 30yr
- Down + closing
- —
- Monthly P&I
- —
- Monthly cashflow
- —
- DSCR
- —
- Eligible?
- —
No personal income docs; deal must DSCR.
Hard money
10% down · 12.0% · 12mo
- Down + closing
- —
- Monthly P&I
- —
- Monthly cashflow
- —
- DSCR
- —
- Eligible?
- —
Short-term bridge; refi at stabilization.
Rent comps 7 comps
| Address | Beds | Baths | Sqft | Rent | $/sqft | DOM | Units | Dist |
|---|---|---|---|---|---|---|---|---|
| 543 7th Ave NW Arab, AL | 2.0 | 1.0 | 1126 | $1,050 | $0.93 | 21d | 1 | 0.16mi |
| 353 4th Ave NW Arab, AL | 3.0 | 1.0 | 1092 | $1,250 | $1.14 | 2d | 1 | 0.20mi |
| 500 4th St NE Arab, AL | 4.0 | 2.0 | 1219 | $1,350 | $1.11 | 11d | 1 | 0.62mi |
| 249 12th Ave NE Arab, AL | 3.0 | 2.0 | 1500 | $1,500 | $1.00 | 23d | 1 | 0.99mi |
| 320 Jordan Ln SE Arab, AL | 3.0 | 2.0 | 1418 | $1,550 | $1.09 | 13d | 1 | 1.16mi |
| 1608 Old Huntsville Hwy Arab, AL | 2.0 | 2.0 | 980 | $1,195 | $1.22 | 13d | 1 | 1.36mi |
| 28 Arad Thompson Rd NE Arab, AL | 3.0 | 2.0 | 1314 | $1,500 | $1.14 | 11d | 1 | 1.49mi |
Listing history 19 events
-
2026-06-19days on market $100,000 Active 22 DOM
-
2026-06-18days on market $100,000 Active 21 DOM
-
2026-06-17days on market $100,000 Active 20 DOM
-
2026-06-16days on market $100,000 Active 19 DOM
-
2026-06-15days on market $100,000 Active 18 DOM
-
2026-06-14days on market $100,000 Active 16 DOM
-
2026-06-12days on market $100,000 Active 15 DOM
-
2026-06-09days on market $100,000 Active 12 DOM
-
2026-06-08days on market $100,000 Active 11 DOM
-
2026-06-07days on market $100,000 Active 10 DOM
-
2026-06-04days on market $100,000 Active 6 DOM
-
2026-06-02days on market $100,000 Active 5 DOM
-
2026-06-01days on market $100,000 Active 4 DOM
-
2026-05-31days on market $100,000 Active 3 DOM
-
2026-05-31days on market $100,000 Active 2 DOM
-
2026-05-27$100,000 Active
-
2018-01-08soldstatus $71,807
-
2018-01-03soldstatus $70,000 419-char remark
Show marketing remark (419 chars)
This super cute remodeled home has 3 bedrooms and 1 updated bath, large living room, dining room and an office area. Hardwood floors, new metal roof, new water heater, fresh paint and a front porch swing that is just waiting for you! Step out to the fenced back yard and you'll find a great workshop, storage shed and an oversized concrete carport. Located in the middle of Arab and convenient to shopping and schools.
-
2017-10-25$74,900 419-char remark
Show marketing remark (419 chars)
This super cute remodeled home has 3 bedrooms and 1 updated bath, large living room, dining room and an office area. Hardwood floors, new metal roof, new water heater, fresh paint and a front porch swing that is just waiting for you! Step out to the fenced back yard and you'll find a great workshop, storage shed and an oversized concrete carport. Located in the middle of Arab and convenient to shopping and schools.
ⓘ Source: listings_history table (triggers on properties + properties_extension) + one-shot
backfill from property_details.listing_events for pre-trigger history.
Tax reassessment forecast AL · Resets to sale price
- Current annual tax
- $465 · $39/mo
- Projected year-2 tax
- $465 · $39/mo
- Expected delta
- $0/yr ($0/mo · 0.0%)
ⓘ Screening estimate from a state-policy table — verify with the county assessor before closing.
Climate risk First Street
- Flood 1/10 Low FEMA zone X (unshaded) · 0% chance over 30 yrs
- Wildfire 3/10 Moderate
- Heat 4/10 Moderate 7 d/yr ≥103°F today · 20 d/yr by 30 yrs out
- Wind 4/10 Moderate 21% chance of damaging wind over 30 yrs
- Air quality 2/10 Low 1 unhealthy d/yr today · 3 by 30 yrs out
Nearby sold comps map
Loading sold comps map…
Walkable amenities ~0.75 mi
Loading nearby amenities…
Taxation est. · year 1
- Rental income
- $14,725
- − Mortgage interest
- −$5,602
- − Property taxes
- −$465
- − Insurance
- −$500
- − Repairs & maintenance
- −$1,178
- − Management
- −$1,178
- − Depreciation
- −$2,909
- Taxable income
- $2,894
- Est. tax owed @ 24.0%
- −$694
- After-tax cash flow
- $3,681/yr
For passive investors: Depreciation is non-cash, so a rental often shows a tax loss while cash-flowing — sheltering income. Rental losses are passive: they offset passive income freely, and up to $25,000/yr can offset ordinary (W-2) income if you actively participate and your MAGI is under $100k (phasing out to $0 by $150k); unused losses carry forward. On sale, claimed depreciation is recaptured at up to 25%, and gains may owe capital-gains tax (a 1031 exchange can defer both). Figures are a year-1 estimate at your 24.0% rate — not tax advice; consult a CPA.
Schools (NCES district)
- District
- Arab City
- NCES district ID
- 0100100
- Math proficiency
- 47% ▼ -25.00%
- Reading proficiency
- 64% ▬ 0.00%
- Median HH income
- $42,728
- Composite
- 46.58/100
- National rank
- #2422
- State rank
- #9 of 129 in AL
Livability — Arab
- Score
- 64/100
- State rank
- #149
- US rank
- #13733
Category grades
Schools grade is shown separately in the Schools card above.
Census & demographics
- Census place
- Arab, AL
- City population
- 17,435
- Population (ZIP)
- 17,435
Population outlook (Marshall County) Hauer SSP2
- Today (2025)
- 97,402 people
- By 2030
- 98,138 · +0.8%
- By 2040
- 98,502 · +1.1%
- By 2050
- 97,024 · -0.4%
- By 2075
- 89,334 · -8.3%
- By 2100
- 74,749 · -23.3%
Race, ethnicity, and origin ACS 2023
- Neighborhood character
- Predominantly White (89%)
- Race & ethnicity
- White 89% Hispanic / Latino 5% Two or more races 5% Asian 1%
- Hispanic origin (detail)
- Mexican 4%
- Common ancestry
- Slovak 2% Italian 1% Serbian 1%
- Foreign-born
- 2% · Canada, China
- Languages at home
- 97% English-only · Spanish 2%
Political lean MEDSL · Marshall
- 2024 margin
- Solid R (+71.7) · D 13.8% · R 85.5%
- 2008→2024 swing
- -15.4pp toward R · 2008: -56.4pp · 2024: -71.7pp
- All cycles
- 2024: R+71.7 2020: R+68.7 2016: R+69.5 2012: R+60.1 2008: R+56.4
Not yet ingested
- Civics
- —
Market trends
- HPI YoY
- ▼ -70.17%
- Current HPI
- 180.2225
- Rent YoY
- —
- Metro
- —
- State GDP YoY
- ▲ 2.94%
- F500 in state
- 4
Industry mix (Fortune 500 HQ in AL)
| Industry | F500 HQs | Revenue |
|---|---|---|
| Financial Services | 1 | $8B |
|
||
| Healthcare | 1 | $5B |
|
||
Price history
+33.5% since first listed4 events — show timeline
- 2026-05-27 Listed $100,000 Greater Alabama MLS
- 2018-01-08 Sold (Public Records) $71,807 Public Records
- 2018-01-03 Sold (MLS) $70,000 VMLS
- 2017-10-25 Listed $74,900 VMLS
Property tax history
+30.3%/yrLatest (2018): $465 · +0.0% YoY. Source: county tax records.
Cash-flow waterfall
monthlySold comps — $/sqft
last 12 mo · ≤1 miLoading sold comps…