20 South Kenny Dr · Wiley Ford, WV
Flood risk No data
- FEMA flood zone
- —
- Chance of flooding over 30 yrs
- —
- Est. flood insurance / yr
- —
Fire risk No data
- Est. fire insurance / yr
- —
Heat risk No data
- Hot days now (above threshold)
- —
- Hot days in 30 yrs
- —
Wind risk No data
- Chance of severe wind over 30 yrs
- —
Air-quality risk No data
- Unhealthy air days now
- —
- Unhealthy air days in 30 yrs
- —
Risk factors via First Street. Map © Google.
Why this score? — see what drove the B grade
The composite is a weighted blend of 9 inputs, each scored 0–100. Each bar is that input's sub-score; the figure is the points it added to the 100-point composite (weight × sub-score).
- Cash flow +30.0/30.0
- 1% rule +10.0/10.0
- DSCR +10.0/10.0
- ARV discount +7.5/15.0
- Appreciation +5.4/10.0
- Livability +3.1/5.0
- Rent growth +2.5/5.0
- Schools +2.5/10.0
- Condition / age +2.5/5.0
$55,000
🖨 Deal sheet 📄 Offer letter ✓ Due diligence
Listing remarks
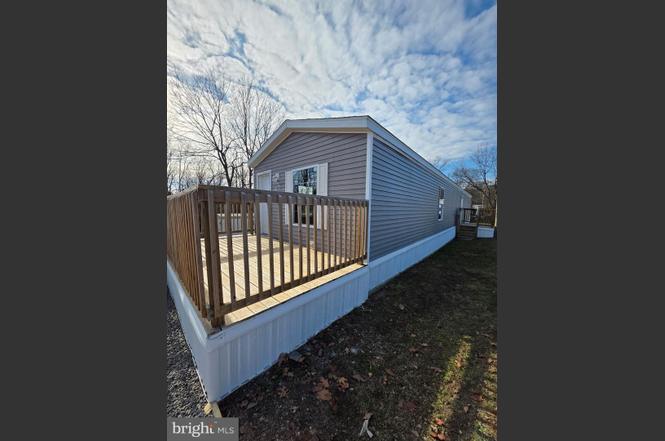
Move-in ready 3-bedroom, 2-bath mobile home offering approximately 1,200 square feet of well-maintained living space. Built in 2019, this home features a functional open layout, spacious bedrooms, and modern finishes throughout. The primary suite includes a private bath, while the additional bedrooms provide flexibility for family, guests, or a home office. Located in a desirable area, this property offers comfortable living in a convenient setting. Ideal for owner-occupants or investors seeking a newer, low-maintenance home.
Key facts
- Built 2019
- Listed 160 days
Property features AI
Finance
- Financial info: Land lease (monthly $577); lease years remaining: 0; Annual ground rent listed in income/expense
Exterior
- Parking: On-street parking
- Utilities: Public water; Public septic
- Home design: Manufactured home; Estimated year built
- Construction: Steel siding
- Exterior features: Ground rent exists (land lease); Monthly land lease payment of $577; Above-grade other structures present
Interior
- Bedrooms: 3 bedrooms on the main level
- Bathrooms: 2 full bathrooms (both on the main level)
- Heating & cooling: Forced air heating (electric); Central air conditioning (electric); Electric hot water
- Interior features: Estimated living area
Neighborhood map
What this means for you Summary
Snapshot
- This is a 3-bed/2.0-bath single-family listed at $55k.
Deal economics
- At list price, monthly cash flow is $519 ($6k/yr) — positive.
- The deal already cash-flows at list — no discount required.
- Meets the 1% rule at list price ($1k rent vs $55k).
- Recommended offer: $48k (12.0% below list) — sets the bar for market timing.
- Cap rate 17.6% vs local median 1.6% in Wiley Ford — top-decile yield for the area; either an underpriced asset or a hidden risk that comps aren't pricing in. Stress-test before assuming the spread holds.
Location & tenants
- Location reads 62/100 on livability (#192 in WV) — a middle-class / working-renter tenant base. Strengths: cost of living A+, housing A+, crime B+; Watch: amenities F, commute F, employment F.
- Mineral County Schools (rural): math 26% / reading 34% proficiency, ranked #32 of 55 in WV (top 58%) — families likely to look elsewhere, expect single-tenant / working-renter base with shorter leases.
- Zoned schools: Frankfort Intermediate School (math 35% / reading 25%, grade F, #218 of 377 statewide, top 59%, 285 students, 0% FRL); Frankfort Middle School (math 34% / reading 42%, grade F, #25 of 109 statewide, top 23%, 481 students, 0% FRL); Frankfort High School (math 37% / reading 47%, grade F, #14 of 110 statewide, top 16%, 488 students, 0% FRL) — zoned schools average 0% FRL vs 41% district-wide (41 pts lower); this property's tenant base skews higher-income than the district average.
- Market conditions: 49 active listings in the ZIP; 64 units permitted in Mineral County in 2024 (0 in 5+ unit buildings).
Forward outlook
- In year one you build about $805 of equity ($380 loan paydown + $425 appreciation (0.8% local appreciation)).
- Mineral County population projected at -26% by 2050 — secular population decline; favor cash flow + early exit over multi-decade hold.
- At projected returns (0.8% appreciation + 3.0% rent growth), your $15k cash investment doubles in ~3 years — after that, you're playing with house money.
Negotiation context
- It's been on market 161 days — a 12% lower offer ($48k) is reasonable based on typical stale-listing flexibility.
Questions for the listing agent
- It's been on market 161 days. Have you received any prior offers? Is the seller open to a 12% concession, seller financing, or rate buy-down credit?
- Why hasn't it sold? Are there any deal-killer items the seller is aware of (foundation, flood, title, zoning, code violations)?
- Is there a deadline driving the sale (1031 exchange, divorce, estate, relocation)? That informs how much negotiation room exists.
- Schools are D-rated, which usually means shorter tenancies and higher turnover. Who's the typical renter profile here, and what's been the actual vacancy rate?
- What's the average days-on-market for RENTAL listings here right now (not sales)? A rising rental-DOM trend means longer vacancies and softer asking-rent achievability than the comps imply.
- What's the recent tenant-quality profile in this submarket — average credit score on applications, eviction rate, late-payment / NSF rate, and stable-employment percentage? A property-management company in the area should have these aggregated.
- How much new for-sale + rental construction is in the pipeline within 1–3 miles? Heavy new supply typically softens prices + rents 12–24 months out; constrained supply supports both.
Investment metrics
- 1% rule
- 2.07% ✓
- Cap rate
- 17.62%
- Cash-on-cash
- 40.46%
- DSCR
- 2.80
- GRM
- 4.0
CMA / ARV
- ARV (on-the-fly)
- $248,400
- Comps found
- 1
Show comp detail 1 sale within ~0.75 mi
| Address | Dist | Beds/Ba | Sqft | Sold | Price | $/sf | Match |
|---|---|---|---|---|---|---|---|
| 246 Joy Dr | 0.70mi | 3/2.0 | 1,040 (-13%) | 4mo | $215,000 | $207 | 42 |
Match score weights: distance 35% · size 25% · config 20% · recency 20%. Top-matched comps best support the ARV.
Projected returns pro-forma
0.77% appreciation · 3.0% rent growth · sell at horizon
- IRR
- 42.7%
- Equity multiple
- 3.18×
- Total profit
- $33,511
- Equity at exit
- $18,130
- IRR
- 44.8%
- Equity multiple
- 6.29×
- Total profit
- $81,424
- Equity at exit
- $23,601
Cash invested: $15,400 (down + closing). Projections, not guarantees.
Landlord ↔ Tenant lean methodology
- Overall (STATE)
- 83 Strongly Landlord-Friendly
- State West Virginia
- 83 Strongly Landlord-Friendly · R+22
- County
- — inherits STATE
- City
- — inherits STATE
ZIP-level market 26753
- Home prices YoY
- 0.3%
- Active inventory
- 49
- Price-to-rent
- 4.0×
Monthly cashflow live
- Estimated rent
- $1,138 medium interval (Pro) →
- Mortgage (P&I)
- −$288
- Tax est. 1.5%
- −$69 /mo · $825/yr
- Insurance
- −$23
- HOA
- −$0
- Vacancy / Maint / Mgmt
- −$239
- Net cashflow
- $519
Break-even live
UW: 25.0% down · 7.5% · 30yr · 1.5% tax · 5.0% vac · 8.0% maint · 8.0% mgmt
Financing live
Cash to close
- Down payment
- $13,750
- Closing costs
- $1,650
- Reserves months
- —
- Total cash needed
- —
Loan-product check · same deal, 3 products live
Conventional
25% down · 7.5% · 30yr
- Down + closing
- —
- Monthly P&I
- —
- Monthly cashflow
- —
- DSCR
- —
- Eligible?
- —
Personal DTI + credit; lowest rate.
DSCR
20% down · 8.5% · 30yr
- Down + closing
- —
- Monthly P&I
- —
- Monthly cashflow
- —
- DSCR
- —
- Eligible?
- —
No personal income docs; deal must DSCR.
Hard money
10% down · 12.0% · 12mo
- Down + closing
- —
- Monthly P&I
- —
- Monthly cashflow
- —
- DSCR
- —
- Eligible?
- —
Short-term bridge; refi at stabilization.
Listing history 17 events
-
2026-06-19days on market $55,000 Active 161 DOM
-
2026-06-18days on market $55,000 Active 160 DOM
-
2026-06-17days on market $55,000 Active 159 DOM
-
2026-06-16days on market $55,000 Active 158 DOM
-
2026-06-15days on market $55,000 Active 157 DOM
-
2026-06-14days on market $55,000 Active 155 DOM
-
2026-06-12days on market $55,000 Active 154 DOM
-
2026-06-09days on market $55,000 Active 151 DOM
-
2026-06-08days on market $55,000 Active 150 DOM
-
2026-06-07days on market $55,000 Active 149 DOM
-
2026-06-03days on market $55,000 Active 145 DOM
-
2026-06-02days on market $55,000 Active 144 DOM
-
2026-06-01days on market $55,000 Active 143 DOM
-
2026-05-31days on market $55,000 Active 142 DOM
-
2026-05-30days on market $55,000 Active 141 DOM
-
2026-02-19price $55,000
-
2026-01-09$60,000 Active
ⓘ Source: listings_history table (triggers on properties + properties_extension) + one-shot
backfill from property_details.listing_events for pre-trigger history.
Nearby sold comps map
Loading sold comps map…
Walkable amenities ~0.75 mi
Loading nearby amenities…
Taxation est. · year 1
- Rental income
- $13,661
- − Mortgage interest
- −$3,081
- − Property taxes
- −$825
- − Insurance
- −$275
- − Repairs & maintenance
- −$1,093
- − Management
- −$1,093
- − Depreciation
- −$1,600
- Taxable income
- $5,695
- Est. tax owed @ 24.0%
- −$1,367
- After-tax cash flow
- $4,865/yr
For passive investors: Depreciation is non-cash, so a rental often shows a tax loss while cash-flowing — sheltering income. Rental losses are passive: they offset passive income freely, and up to $25,000/yr can offset ordinary (W-2) income if you actively participate and your MAGI is under $100k (phasing out to $0 by $150k); unused losses carry forward. On sale, claimed depreciation is recaptured at up to 25%, and gains may owe capital-gains tax (a 1031 exchange can defer both). Figures are a year-1 estimate at your 24.0% rate — not tax advice; consult a CPA.
Schools (NCES district)
- District
- Mineral County Schools
- NCES district ID
- 5400870
- Math proficiency
- 26% ▼ -12.00%
- Reading proficiency
- 34% ▼ -7.00%
- Median HH income
- $36,161
- Composite
- 24.85/100
- National rank
- #7590
- State rank
- #32 of 55 in WV
Livability — Wiley Ford
- Score
- 62/100
- State rank
- #192
- US rank
- #17247
Category grades
Schools grade is shown separately in the Schools card above.
Census & demographics
- City population
- 419
- Population (ZIP)
- 5,858
Population outlook (Mineral County) Hauer SSP2
- Today (2025)
- 25,357 people
- By 2030
- 24,009 · -5.3%
- By 2040
- 21,321 · -15.9%
- By 2050
- 18,801 · -25.9%
- By 2075
- 13,934 · -45.0%
- By 2100
- 10,141 · -60.0%
Race, ethnicity, and origin ACS 2023
- Neighborhood character
- Predominantly White (97%)
- Race & ethnicity
- White 97% Two or more races 3% Hispanic / Latino 1%
- Common ancestry
- Slovak 9% Scottish 2% Lithuanian 1%
- Foreign-born
- 1% · Canada
- Languages at home
- 99% English-only · German/W. Germanic 1%
Political lean MEDSL · Mineral
- 2024 margin
- Solid R (+60.2) · D 19.2% · R 79.4% · Other 1.4%
- 2008→2024 swing
- -26.7pp toward R · 2008: -33.5pp · 2024: -60.2pp
- All cycles
- 2024: R+60.2 2020: R+57.3 2016: R+60.8 2012: R+45.0 2008: R+33.5
Not yet ingested
- Civics
- —
Market trends
- HPI YoY
- ▲ 0.77%
- Current HPI
- 231.8437
- Rent YoY
- —
- Metro
- —
- State GDP YoY
- —
- F500 in state
- 0
Price history
-8.3% since first listed2 events — show timeline
- 2026-02-19 Price Changed $55,000 BRIGHT MLS
- 2026-01-09 Listed $60,000 BRIGHT MLS
Cash-flow waterfall
monthlySold comps — $/sqft
last 12 mo · ≤1 miLoading sold comps…