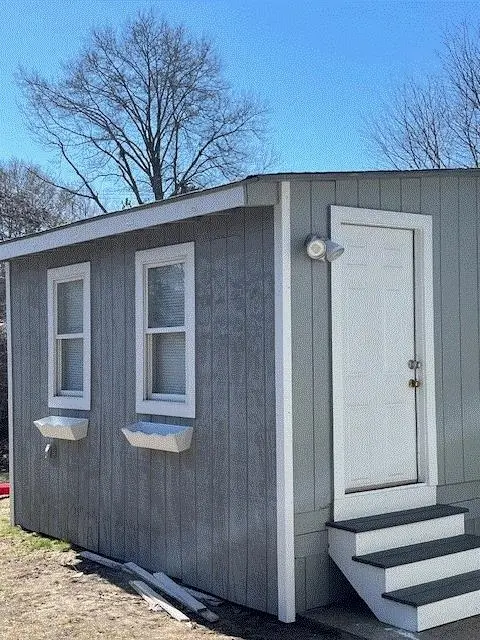
15 Princess Dr · Methuen Town, MA
Flood risk 1/10 · Minimal
- FEMA flood zone
- X (unshaded)
- Chance of flooding over 30 yrs
- 0.0%
- Est. flood insurance / yr
- $507 – $1,088
Fire risk 1/10 · Minimal
- Est. fire insurance / yr
- $507 – $941
Heat risk 4/10 · Minor
- Hot days now (above 96°F)
- 7 days/yr
- Hot days in 30 yrs
- 15 days/yr
Wind risk 6/10 · Moderate
- Chance of severe wind over 30 yrs
- 27.0%
Air-quality risk 2/10 · Minimal
- Unhealthy air days now
- 2 days/yr
- Unhealthy air days in 30 yrs
- 2 days/yr
Risk factors via First Street. Map © Google.
Why this score? — see what drove the B+ grade
The composite is a weighted blend of 9 inputs, each scored 0–100. Each bar is that input's sub-score; the figure is the points it added to the 100-point composite (weight × sub-score).
- Cash flow +30.0/30.0
- ARV discount +12.4/15.0
- 1% rule +10.0/10.0
- DSCR +10.0/10.0
- Schools +4.6/10.0
- Livability +3.7/5.0
- Rent growth +3.2/5.0
- Condition / age +2.5/5.0
- Appreciation +0.0/10.0
$159,999
🖨 Deal sheet 📄 Offer letter ✓ Due diligence
Listing remarks MLS
Come see this well-maintained unit in the heart of Salem NH! New electric, furnace, tub, new roof, stairs, paint and plaster. This is your Salem NH home. In a quiet park but close to all of the action, you will be able to enjoy life if you make this home yours. Great NH schools, close to stores, highways, and Tuscan Village, you can do all this area offers or just relax and do nothing. The unit is large, with a redone kitchen, a painted living room, a bedroom with a large closet and even a bonus room with large windows and its own entrance. Come take a look at this excellent location in sought after Salem NH. HOA includes plowing and trash. Park application approval applies.
Key facts
- New furnace
- Large closet
- Bonus room
Tags
Neighborhood map
What this means for you Summary
Snapshot
- This is a 2-bed/1.0-bath manufactured listed at $160k.
Deal economics
- At list price, monthly cash flow is $606 ($7k/yr) — positive.
- The deal already cash-flows at list — no discount required.
- Meets the 1% rule at list price ($3k rent vs $160k).
- Recommended offer: $150k (6.0% below list) — sets the bar for market timing.
- Cap rate 10.8% vs local median 2.9% in Methuen Town — top-decile yield for the area; either an underpriced asset or a hidden risk that comps aren't pricing in. Stress-test before assuming the spread holds.
Location & tenants
- Location reads 73/100 on livability (#108 in MA) — a middle-class / working-renter tenant base. Strengths: housing A+, crime A, employment A; Watch: schools D+, commute D+, amenities F.
- Salem School District (suburban): math 47% / reading 56% proficiency, ranked #28 of 98 in NH (top 29%) — acceptable for families but not a draw, mixed tenant base, ~2y average lease; only 14% free/reduced lunch — higher-income household profile.
- Market conditions: Rents rising (+2.6%/yr); 9 comparable units currently listed for rent nearby; rentals leasing fast (median 2d on market — plan ~1-2 weeks tenant-placement turnaround); high-income renter base; 1,276 units permitted in Rockingham County in 2024 (593 in 5+ unit buildings).
Forward outlook
- Local home prices are declining (-3.0%/yr); year-one equity from $1k of loan paydown is wiped out by about $5k of value loss. Plan a longer hold.
- At projected returns (-3.0% appreciation + 2.6% rent growth), your $45k cash investment doubles in ~8 years — after that, you're playing with house money.
Negotiation context
- It's been on market 68 days — a 6% lower offer ($150k) is reasonable based on typical stale-listing flexibility.
- 3 sale attempts since 3y ago with the ask held roughly flat each time — persistent listings suggest the price (not the market) is what's stuck; bring a comps-based counter.
- Current owner paid $24k; list at $160k implies a 581% gain — meaningful room to come down on a strong offer.
Risks & watch-outs
- Climate carrying-cost: major wind risk, 27% chance of damaging wind over 30y — expect insurance premiums to compound above CPI over the hold.
Questions for the listing agent
- It's been on market 68 days. Have you received any prior offers? Is the seller open to a 6% concession, seller financing, or rate buy-down credit?
- What does the HOA fee cover, when was the last increase, and are there any pending special assessments or reserve-fund shortfalls?
- Why hasn't it sold? Are there any deal-killer items the seller is aware of (foundation, flood, title, zoning, code violations)?
- Is there a deadline driving the sale (1031 exchange, divorce, estate, relocation)? That informs how much negotiation room exists.
- Schools are D-rated, which usually means shorter tenancies and higher turnover. Who's the typical renter profile here, and what's been the actual vacancy rate?
- What's the average days-on-market for RENTAL listings here right now (not sales)? A rising rental-DOM trend means longer vacancies and softer asking-rent achievability than the comps imply.
- What's the recent tenant-quality profile in this submarket — average credit score on applications, eviction rate, late-payment / NSF rate, and stable-employment percentage? A property-management company in the area should have these aggregated.
- How much new for-sale + rental construction is in the pipeline within 1–3 miles? Heavy new supply typically softens prices + rents 12–24 months out; constrained supply supports both.
Investment metrics
- 1% rule
- 1.65% ✓
- Cap rate
- 10.84%
- Cash-on-cash
- 16.23%
- DSCR
- 1.72
- GRM
- 5.0
CMA / ARV
- ARV (median comp)
- $179,528
- List price
- $159,999
- Delta
- -10.88%
- Verdict
- UNDERPRICED
- Comps
- 8 within 1.0 mi
Show comp detail 1 sale within ~0.75 mi
| Address | Dist | Beds/Ba | Sqft | Sold | Price | $/sf | Match |
|---|---|---|---|---|---|---|---|
| 19 Princess Dr | 0.01mi | 2/1.0 | 650 (+6%) | 11mo | $159,900 | $246 | 80 |
Match score weights: distance 35% · size 25% · config 20% · recency 20%. Top-matched comps best support the ARV.
Projected returns pro-forma
-3.0% appreciation · 2.64% rent growth · sell at horizon
- IRR
- 6.9%
- Equity multiple
- 1.27×
- Total profit
- $11,991
- Equity at exit
- $23,856
- IRR
- 15.9%
- Equity multiple
- 2.28×
- Total profit
- $57,362
- Equity at exit
- $13,834
Cash invested: $44,800 (down + closing). Projections, not guarantees.
Landlord ↔ Tenant lean methodology
- Overall (STATE)
- 20 Strongly Tenant-Friendly
- State Massachusetts
- 20 Strongly Tenant-Friendly · D+15
- County
- — inherits STATE
- City
- — inherits STATE
ZIP-level market 03079
- Rents YoY
- 2.6%
- Price-to-rent
- 5.0×
Monthly cashflow live
- Estimated rent
- $2,647 high interval (Pro) →
- Mortgage (P&I)
- −$839
- Tax from tax record
- −$65 /mo · $775/yr
- Insurance
- −$67
- HOA
- −$515
- Vacancy / Maint / Mgmt
- −$556
- Net cashflow
- $606
Break-even live
UW: 25.0% down · 7.5% · 30yr · 1.5% tax · 5.0% vac · 8.0% maint · 8.0% mgmt
Financing live
Cash to close
- Down payment
- $40,000
- Closing costs
- $4,800
- Reserves months
- —
- Total cash needed
- —
Loan-product check · same deal, 3 products live
Conventional
25% down · 7.5% · 30yr
- Down + closing
- —
- Monthly P&I
- —
- Monthly cashflow
- —
- DSCR
- —
- Eligible?
- —
Personal DTI + credit; lowest rate.
DSCR
20% down · 8.5% · 30yr
- Down + closing
- —
- Monthly P&I
- —
- Monthly cashflow
- —
- DSCR
- —
- Eligible?
- —
No personal income docs; deal must DSCR.
Hard money
10% down · 12.0% · 12mo
- Down + closing
- —
- Monthly P&I
- —
- Monthly cashflow
- —
- DSCR
- —
- Eligible?
- —
Short-term bridge; refi at stabilization.
Rent comps 9 comps
| Address | Beds | Baths | Sqft | Rent | $/sqft | DOM | Units | Dist |
|---|---|---|---|---|---|---|---|---|
| 3 Lancelot Ct Salem, NH | 2.0 | 1.0 | 736 | $1,800 | $2.45 | 43d | 1 | 0.28mi |
| 1 Lancelot Ct #2 Salem, NH | 2.0 | 1.0 | 728 | $1,950 | $2.68 | 24d | 1 | 0.30mi |
| 11 Lancelot Ct #7 Salem, NH | 2.0 | 1.0 | 676 | $1,850 | $2.74 | 4d | 1 | 0.31mi |
| 103 S Policy St Unit 4 Salem, NH | 1.0 | 1.0 | 650 | $2,000 | $3.08 | 14d | 1 | 0.52mi |
| 22 Via Toscana Salem, NH | 2.0 | 1.0–2.0 | 846 | $4,598 | $5.43 | 1d | 61 | 0.62mi |
| 15 Artisan Dr Salem, NH | 2.0 | 1.0–2.0 | 910 | $3,873 | $4.26 | 1d | 35 | 0.68mi |
| 3 Artisan Dr Salem, NH | 2.0 | 1.0–2.0 | 920 | $4,401 | $4.78 | 1d | 43 | 0.68mi |
| 4 Tuscan Blvd Salem, NH | 2.0 | 1.0–2.0 | 739 | $3,390 | $4.58 | 1d | 18 | 0.87mi |
| 800 Central St Salem, NH | 2.0 | 1.0–2.0 | 776 | $2,825 | $3.64 | 1d | 14 | 1.00mi |
HOA detail
- Monthly dues
- $515 · $6,180/yr
- Likely covers
- trashelectric
Listing history 20 events
-
2026-06-18days on market $159,999 Active 68 DOM
-
2026-06-17days on market $159,999 Active 67 DOM
-
2026-06-16days on market $159,999 Active 66 DOM
-
2026-06-15days on market $159,999 Active 65 DOM
-
2026-06-13days on market $159,999 Active 63 DOM
-
2026-06-09days on market $159,999 Active 59 DOM
-
2026-06-08days on market $159,999 Active 58 DOM
-
2026-06-07days on market $159,999 Active 57 DOM
-
2026-06-04days on market $159,999 Active 54 DOM
-
2026-06-03days on market $159,999 Active 53 DOM
-
2026-06-02days on market $159,999 Active 52 DOM
-
2026-06-01days on market $159,999 Active 51 DOM
-
2026-05-31days on market $159,999 Active 50 DOM
-
2026-04-11$159,999 Active 683-char remark
Show marketing remark (683 chars)
Come see this well-maintained unit in the heart of Salem NH! New electric, furnace, tub, new roof, stairs, paint and plaster. This is your Salem NH home. In a quiet park but close to all of the action, you will be able to enjoy life if you make this home yours. Great NH schools, close to stores, highways, and Tuscan Village, you can do all this area offers or just relax and do nothing. The unit is large, with a redone kitchen, a painted living room, a bedroom with a large closet and even a bonus room with large windows and its own entrance. Come take a look at this excellent location in sought after Salem NH. HOA includes plowing and trash. Park application approval applies.
-
2023-09-26soldstatus $23,500 Closed 94-char remark
Show marketing remark (94 chars)
Motivated Seller! One bedroom manufactured home located in Suburban Park. Home needs some TLC.
-
2023-09-05price $24,000 94-char remark
Show marketing remark (94 chars)
Motivated Seller! One bedroom manufactured home located in Suburban Park. Home needs some TLC.
-
2023-09-05status Pending 94-char remark
Show marketing remark (94 chars)
Motivated Seller! One bedroom manufactured home located in Suburban Park. Home needs some TLC.
-
2023-08-24status Active 94-char remark
Show marketing remark (94 chars)
Motivated Seller! One bedroom manufactured home located in Suburban Park. Home needs some TLC.
-
2023-08-23historical 94-char remark
Show marketing remark (94 chars)
Motivated Seller! One bedroom manufactured home located in Suburban Park. Home needs some TLC.
-
2023-08-22$54,000 Active 94-char remark
Show marketing remark (94 chars)
Motivated Seller! One bedroom manufactured home located in Suburban Park. Home needs some TLC.
ⓘ Source: listings_history table (triggers on properties + properties_extension) + one-shot
backfill from property_details.listing_events for pre-trigger history.
Tax reassessment forecast MA · Partial reset (capped growth)
- Current annual tax
- $775 · $65/mo
- Projected year-2 tax
- $1,371 · $114/mo
- Expected delta
- +$596/yr (+$50/mo · 77.0%)
ⓘ Screening estimate from a state-policy table — verify with the county assessor before closing.
Climate risk First Street
- Flood 1/10 Low FEMA zone X (unshaded) · 0% chance over 30 yrs
- Wildfire 1/10 Low
- Heat 4/10 Moderate 7 d/yr ≥96°F today · 15 d/yr by 30 yrs out
- Wind 6/10 Major 27% chance of damaging wind over 30 yrs
- Air quality 2/10 Low 2 unhealthy d/yr today · 2 by 30 yrs out
Nearby sold comps map
Loading sold comps map…
Walkable amenities ~0.75 mi
Loading nearby amenities…
Taxation est. · year 1
- Rental income
- $31,767
- − Mortgage interest
- −$8,962
- − Property taxes
- −$775
- − Insurance
- −$800
- − Repairs & maintenance
- −$2,541
- − Management
- −$2,541
- − HOA
- −$6,180
- − Depreciation
- −$4,655
- Taxable income
- $5,313
- Est. tax owed @ 24.0%
- −$1,275
- After-tax cash flow
- $5,998/yr
For passive investors: Depreciation is non-cash, so a rental often shows a tax loss while cash-flowing — sheltering income. Rental losses are passive: they offset passive income freely, and up to $25,000/yr can offset ordinary (W-2) income if you actively participate and your MAGI is under $100k (phasing out to $0 by $150k); unused losses carry forward. On sale, claimed depreciation is recaptured at up to 25%, and gains may owe capital-gains tax (a 1031 exchange can defer both). Figures are a year-1 estimate at your 24.0% rate — not tax advice; consult a CPA.
Schools (NCES district)
- District
- Salem School District
- NCES district ID
- 3306060
- Math proficiency
- 47% ▼ -4.00%
- Reading proficiency
- 56% ▼ -2.00%
- Median HH income
- $75,648
- Composite
- 46.45/100
- National rank
- #2446
- State rank
- #28 of 98 in NH
Livability — Methuen Town
- Score
- 73/100
- State rank
- #108
- US rank
- #5537
Category grades
Schools grade is shown separately in the Schools card above.
Census & demographics
- County
- Rockingham County
- City population
- 53,015
- Metro
- Boston-Cambridge-Newton, MA-NH
- Population (ZIP)
- 30,964
- Household income
- $110,490
- Rent vs Own
- Severe rent burden
- 702.0
Population outlook (Rockingham County) Hauer SSP2
- Today (2025)
- 316,118 people
- By 2030
- 320,929 · +1.5%
- By 2040
- 323,358 · +2.3%
- By 2050
- 314,977 · -0.4%
- By 2075
- 297,686 · -5.8%
- By 2100
- 256,363 · -18.9%
Race, ethnicity, and origin ACS 2023
- Neighborhood character
- Predominantly White (82%)
- Race & ethnicity
- White 82% Hispanic / Latino 9% Two or more races 4% Asian 4%
- Hispanic origin (detail)
- Puerto Rican 2% Dominican 4%
- Common ancestry
- Lithuanian 9% Romanian 4% Russian 4%
- Foreign-born
- 11% · Canada, Vietnam, South Korea
- Languages at home
- 88% English-only · Spanish 6% Other Asian/Pacific 2% Other Indo-European 1%
Political lean MEDSL · Rockingham
- 2024 margin
- Toss-up / Even · D 48.3% · R 50.8%
- 2008→2024 swing
- -3.5pp toward R · 2008: 1.1pp · 2024: -2.4pp
- All cycles
- 2024: R+2.4 2020: D+2.1 2016: R+5.8 2012: R+4.5 2008: D+1.1
Not yet ingested
- Civics
- —
Market trends
- HPI YoY
- ▼ -265.55%
- Current HPI
- 311.547
- Rent YoY
- ▲ 2.64%
- Metro
- Boston-Cambridge-Newton, MA-NH
- State GDP YoY
- ▲ 2.28%
- F500 in state
- 38
Industry mix (Fortune 500 HQ in MA)
| Industry | F500 HQs | Revenue |
|---|---|---|
| Technology | 3 | $17B |
|
||
| Insurance | 2 | $84B |
|
||
| Retail | 2 | $76B |
|
||
| Life Sciences | 1 | $43B |
|
||
| Energy Technology | 1 | $31B |
|
||
| Aerospace / Defense | 1 | $18B |
|
||
Price history
+196.3% since first listed7 events — show timeline
- 2026-04-11 Listed $159,999 PrimeMLS
- 2023-09-26 Sold (MLS) $23,500 PrimeMLS
- 2023-09-05 Price Changed $24,000 PrimeMLS
- 2023-09-05 Pending — PrimeMLS
- 2023-08-24 Relisted — PrimeMLS
- 2023-08-23 Delisted — PrimeMLS
- 2023-08-22 Listed $54,000 PrimeMLS
Property tax history
+13.7%/yrLatest (2025): $775 · +3.1% YoY. Source: county tax records.
Cash-flow waterfall
monthlySold comps — $/sqft
last 12 mo · ≤1 miLoading sold comps…