357 Westpark Rd · Lehigh Acres, FL
Flood risk 1/10 · Minimal
- FEMA flood zone
- X (unshaded)
- Chance of flooding over 30 yrs
- 0.0%
- Est. flood insurance / yr
- $507 – $1,088
Fire risk 1/10 · Minimal
- Est. fire insurance / yr
- $947 – $1,759
Heat risk 10/10 · Severe
- Hot days now (above 108°F)
- 7 days/yr
- Hot days in 30 yrs
- 28 days/yr
Wind risk 10/10 · Severe
- Chance of severe wind over 30 yrs
- 99.0%
Air-quality risk 2/10 · Minimal
- Unhealthy air days now
- 1 days/yr
- Unhealthy air days in 30 yrs
- 2 days/yr
Risk factors via First Street. Map © Google.
Why this score? — see what drove the C+ grade
The composite is a weighted blend of 9 inputs, each scored 0–100. Each bar is that input's sub-score; the figure is the points it added to the 100-point composite (weight × sub-score).
- Cash flow +24.5/30.0
- 1% rule +8.6/10.0
- DSCR +7.9/10.0
- ARV discount +7.5/15.0
- Schools +4.1/10.0
- Livability +3.0/5.0
- Condition / age +2.5/5.0
- Rent growth +2.3/5.0
- Appreciation +0.0/10.0
$119,900
🖨 Deal sheet (PDF) 📄 Offer letter ✓ Due diligence
Listing remarks MLS
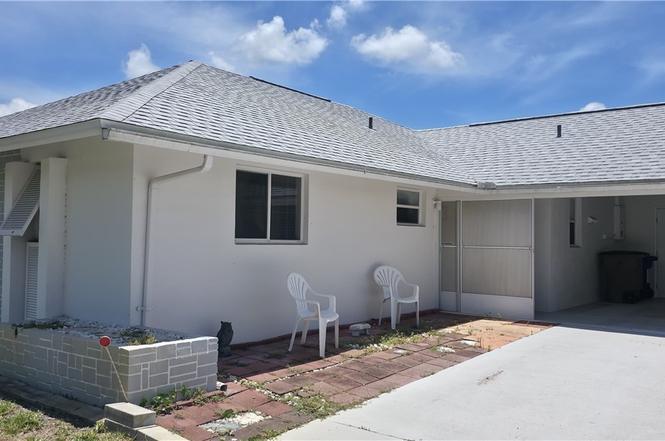
FURNISHED GOLFWOOD CONDO!! 2BR/2BA with Den that could be used as a formal dining area. Within a short walking distance from an 18 hole golfcourse. Well-maintained corner unit with new roof, new hot water heater, new compressor. Lovely screened lanai with fruit trees just outside the door for your enjoyment! Condo includes utility room w/ laundry tub, washer/dryer, wall cabinets. Utility Room is accessible from inside the condo which is unique since most of the condo's in this area you need to go outside to get to your utility room. Kitchen includes range, dishwasher, garbage disposal, microwave & pantry; double-bowl sink; stand-alone microwave. Laundry area has extra storage space. Low monthly fees that include insurance, lawn care & exterior maintenance for Golfwood Landominium.
Key facts
- Formal dining room
- Eat-in kitchen
- Large florida room
Tags
Property features AI
Finance
- Financial info: Pets allowed on a conditional basis (call for details)
- HOA & community: Part of a community of 36 units; Homeowners association with monthly fee ($290) that covers grounds maintenance; Association provides management; Non-gated, senior community
Exterior
- Parking: Assigned covered parking; Attached carport (1 covered space); Driveway with two spaces, paved
- Security: Smoke detector(s)
- Utilities: Public water; Public sewer; Cable available
- Home design: Single-story home; Resale property; Property faces north; Has property attached
- Construction: Block, concrete and stucco construction; Shingle roof
- Exterior features: Corner lot; Private, paved road frontage on a privately maintained road; South exposure; Guest house attached; Smoke detectors
Interior
- Kitchen: Eat-in kitchen
- Bedrooms: Master bedroom (main level); Additional bedroom (12 x 11)
- Flooring: Carpet; Tile; Vinyl
- Bathrooms: 2 full bathrooms
- Heating & cooling: Central heating (electric); Central air conditioning (electric); Ceiling fans
- Interior features: Casement windows; Attic with pull-down stairs; Bedroom on main level; Separate/formal dining room; Eat-in kitchen; Main-level primary bedroom; Shower-only bath with separate shower; Unfurnished
- Laundry & utility: Interior laundry / utility room
Neighborhood map
What this means for you Summary
Snapshot
- This is a 2-bed/2.0-bath townhouse listed at $120k.
Deal economics
- At list price, monthly cash flow is $245 ($3k/yr) — positive.
- The deal already cash-flows at list — no discount required.
- Meets the 1% rule at list price ($2k rent vs $120k).
- Cap rate 8.7% vs local median 4.7% in Lehigh Acres — top-decile yield for the area; either an underpriced asset or a hidden risk that comps aren't pricing in. Stress-test before assuming the spread holds.
Location & tenants
- Location reads 59/100 on livability (#826 in FL) — a working-class tenant base; expect higher turnover. Strengths: cost of living A+, housing A+; Watch: crime C-, employment D+, amenities F.
- Lee (suburban): math 47% / reading 50% proficiency, ranked #42 of 73 in FL (top 58%) — families likely to look elsewhere, expect single-tenant / working-renter base with shorter leases.
- Zoned schools: Veterans Park Academy For The Arts (math 41% / reading 45%, grade F, #1,366 of 2,144 statewide, top 64%, 2,133 students, 36% FRL); Oak Hammock Middle School (math 43% / reading 41%, grade D-, #340 of 571 statewide, top 61%, 1,563 students, 56% FRL); Lehigh Senior High School (math 23% / reading 45%, grade F, #394 of 667 statewide, top 60%, 2,476 students, 57% FRL).
- Market conditions: Rents soft (-0.8%/yr); 644 active listings in the ZIP; 37 comparable units currently listed for rent nearby; rentals at typical pace (median 25d on market — plan ~3-4 weeks tenant-placement turnaround); 15,411 units permitted in Lee County in 2024 (4,686 in 5+ unit buildings).
- This rent runs 38% of the median local income ($51k/yr) — at the standard rent-burdened threshold; future hikes will face affordability resistance.
Forward outlook
- Local home prices are declining (-3.0%/yr); year-one equity from $829 of loan paydown is wiped out by about $4k of value loss. Plan a longer hold.
- Lee County population projected at +44% by 2050 — long-run rental-demand tailwind backs the buy-and-hold thesis.
Negotiation context
- Only 5 days on market — expect competitive offers; lowballing is unlikely to land.
- Current owner paid $60k; list at $120k implies a 100% gain — meaningful room to come down on a strong offer.
Risks & watch-outs
- Climate carrying-cost: severe wind risk, 99% chance of damaging wind over 30y; extreme-heat days projected 7→28/yr by 2055 (HVAC capex compounding) — expect insurance premiums to compound above CPI over the hold.
Questions for the listing agent
- Built in 1972 — when were the roof, HVAC, electrical panel, plumbing, and water heater last replaced?
- What does the HOA fee cover, when was the last increase, and are there any pending special assessments or reserve-fund shortfalls?
- Is there a deadline driving the sale (1031 exchange, divorce, estate, relocation)? That informs how much negotiation room exists.
- Schools are D-rated, which usually means shorter tenancies and higher turnover. Who's the typical renter profile here, and what's been the actual vacancy rate?
- What's the average days-on-market for RENTAL listings here right now (not sales)? A rising rental-DOM trend means longer vacancies and softer asking-rent achievability than the comps imply.
- What's the recent tenant-quality profile in this submarket — average credit score on applications, eviction rate, late-payment / NSF rate, and stable-employment percentage? A property-management company in the area should have these aggregated.
- How much new for-sale + rental construction is in the pipeline within 1–3 miles? Heavy new supply typically softens prices + rents 12–24 months out; constrained supply supports both.
Investment metrics
- 1% rule
- 1.36% ✓
- Cap rate
- 8.75%
- Cash-on-cash
- 8.77%
- DSCR
- 1.39
- GRM
- 6.1
CMA / ARV
No comps found within radius.
Projected returns pro-forma
-3.0% appreciation · 0.0% rent growth · sell at horizon
- IRR
- -7.1%
- Equity multiple
- 0.75×
- Total profit
- $-8,432
- Equity at exit
- $17,877
- IRR
- -2.7%
- Equity multiple
- 0.85×
- Total profit
- $-5,058
- Equity at exit
- $10,367
Cash invested: $33,572 (down + closing). Projections, not guarantees.
Landlord ↔ Tenant lean methodology
- Overall (STATE)
- 87 Strongly Landlord-Friendly
- State Florida
- 87 Strongly Landlord-Friendly · R+3
- County
- — inherits STATE
- City
- — inherits STATE
ZIP-level market 33936
- Home prices YoY
- -19.9%
- Rents YoY
- -0.8%
- Active inventory
- 644
- Price-to-rent
- 6.1×
Monthly cashflow live
- Estimated rent
- $1,630 high interval (Pro) →
- Mortgage (P&I)
- −$629
- Tax from tax record
- −$74 /mo · $885/yr
- Insurance
- −$50
- HOA
- −$290
- Vacancy / Maint / Mgmt
- −$342
- Net cashflow
- $245
Break-even live
Sensitivity live
| Price | -10% $313 | -5% $279 | +0% $245 | +5% $211 | +10% $177 |
|---|---|---|---|---|---|
| Rent | -10% $116 | -5% $181 | +0% $245 | +5% $310 | +10% $374 |
| Rate | -1.0pp $306 | -0.5pp $276 | base $245 | +0.5pp $214 | +1.0pp $183 |
UW: 25.0% down · 7.5% · 30yr · 1.5% tax · 5.0% vac · 8.0% maint · 8.0% mgmt
Financing live
Cash to close
- Down payment
- $29,975
- Closing costs
- $3,597
- Reserves months
- —
- Total cash needed
- —
Loan-product check · same deal, 3 products live
Conventional
25% down · 7.5% · 30yr
- Down + closing
- —
- Monthly P&I
- —
- Monthly cashflow
- —
- DSCR
- —
- Eligible?
- —
Personal DTI + credit; lowest rate.
DSCR
20% down · 8.5% · 30yr
- Down + closing
- —
- Monthly P&I
- —
- Monthly cashflow
- —
- DSCR
- —
- Eligible?
- —
No personal income docs; deal must DSCR.
Hard money
10% down · 12.0% · 12mo
- Down + closing
- —
- Monthly P&I
- —
- Monthly cashflow
- —
- DSCR
- —
- Eligible?
- —
Short-term bridge; refi at stabilization.
Rent comps 37 comps
| Address | Beds | Baths | Sqft | Rent | $/sqft | DOM | Units | Dist |
|---|---|---|---|---|---|---|---|---|
| 347 Richland Rd Lehigh Acres, FL | 2.0 | 2.0 | 1040 | $1,150 | $1.11 | 25d | 1 | 0.04mi |
| 907 E 3rd St Lehigh Acres, FL | 3.0 | 2.0 | 1531 | $1,710 | $1.12 | 25d | 1 | 0.25mi |
| 241 Thistle Ct Lehigh Acres, FL | 2.0 | 2.0 | 1376 | $1,195 | $0.87 | 25d | 1 | 0.30mi |
| 226 North Ave Lehigh Acres, FL | 3.0 | 2.0 | 1758 | $1,806 | $1.03 | 4d | 1 | 0.40mi |
| 505 E 8th St Lehigh Acres, FL | 3.0 | 2.0 | 1501 | $2,800 | $1.87 | 25d | 1 | 0.52mi |
| 1204 E 6th St Lehigh Acres, FL | 3.0 | 2.0 | 1196 | $1,825 | $1.53 | 4d | 1 | 0.57mi |
| 198 Joel Blvd #6 Lehigh Acres, FL | 2.0 | 2.0 | 1036 | $1,200 | $1.16 | 4d | 1 | 0.61mi |
| 1101 Leeland Heights Blvd E Lehigh Acres, FL | 3.0 | 2.0 | 1250 | $1,350 | $1.08 | 17d | 1 | 0.65mi |
| 609 Maple Ave N Lehigh Acres, FL | 3.0 | 2.0 | 1497 | $2,050 | $1.37 | 25d | 1 | 0.70mi |
| 321 Dania St Lehigh Acres, FL | 2.0 | 2.0 | 915 | $1,800 | $1.97 | 25d | 1 | 0.75mi |
| 333 Joel Blvd Lehigh Acres, FL | 2.0 | 1.0–2.0 | 877 | $1,048 | $1.19 | 17d | 2 | 0.83mi |
| 311 Inman St Lehigh Acres, FL | 3.0 | 2.0 | 1604 | $2,300 | $1.43 | 25d | 1 | 0.83mi |
| 518 Sheldon Ave Lehigh Acres, FL | 3.0 | 2.0 | 1659 | $1,600 | $0.96 | 25d | 1 | 0.85mi |
| 1406 Ford Cir Lehigh Acres, FL | 3.0 | 2.5 | 1662 | $2,100 | $1.26 | 25d | 1 | 0.85mi |
| 343 Joel Blvd #111 Lehigh Acres, FL | 2.0 | 2.0 | 921 | $900 | $0.98 | 25d | 1 | 0.89mi |
| 1601 E 7th St Lehigh Acres, FL | 3.0 | 2.0 | 1197 | $1,650 | $1.38 | 25d | 1 | 0.94mi |
| 704 Broadway Ave Unit 1 Lehigh Acres, FL | 3.0 | 2.0 | 1197 | $1,650 | $1.38 | 17d | 1 | 0.97mi |
| 2201 E 5th St #23 Lehigh Acres, FL | 2.0 | 2.0 | 1011 | $1,300 | $1.29 | 4d | 1 | 1.00mi |
| 2213 Gardenia Way Lehigh Acres, FL | 2.0 | 1.5 | 900 | $1,740 | $1.93 | 25d | 1 | 1.01mi |
| 815 Porter St E Lehigh Acres, FL | 3.0 | 2.0 | 1659 | $1,800 | $1.08 | 25d | 1 | 1.04mi |
| 322 Edward Ave Lehigh Acres, FL | 2.0 | 2.0 | 1347 | $1,400 | $1.04 | 4d | 1 | 1.06mi |
| 104 McKinley Ave Lehigh Acres, FL | 3.0 | 2.0 | 1756 | $1,950 | $1.11 | 25d | 1 | 1.11mi |
| 107 W Lake Dr Lehigh Acres, FL | 3.0 | 2.0 | 1610 | $2,100 | $1.30 | 25d | 1 | 1.11mi |
| 525 Glendale Ave Unit 529 Lehigh Acres, FL | 3.0 | 2.0 | 1459 | $1,695 | $1.16 | 25d | 1 | 1.13mi |
| 110 Texas Rd Lehigh Acres, FL | 3.0 | 1.0 | 1118 | $1,750 | $1.57 | 17d | 1 | 1.14mi |
| 1440 Graham Cir Lehigh Acres, FL | 3.0 | 2.0 | 1767 | $2,300 | $1.30 | 25d | 1 | 1.14mi |
| 201 Fireside Ct Lehigh Acres, FL | 2.0 | 2.0 | 1370 | $1,550 | $1.13 | 4d | 1 | 1.18mi |
| 719 Center Lake St Lehigh Acres, FL | 3.0 | 2.0 | 1616 | $1,750 | $1.08 | 25d | 1 | 1.18mi |
| 201 Fireside Ct Unit N/A Lehigh Acres, FL | 2.0 | 2.0 | 1370 | $1,675 | $1.22 | 4d | 1 | 1.18mi |
| 101 Edward Ave Lehigh Acres, FL | 3.0 | 2.0 | 1531 | $3,200 | $2.09 | 25d | 1 | 1.23mi |
| 808 Greenwood Ave Lehigh Acres, FL | 3.0 | 2.0 | 1419 | $1,800 | $1.27 | 25d | 1 | 1.24mi |
| 621 Joel Blvd Unit 102 Lehigh Acres, FL | 2.0 | 2.0 | 1200 | $1,300 | $1.08 | 25d | 1 | 1.26mi |
| 127 Highview Ave Lehigh Acres, FL | 3.0 | 2.0 | 1495 | $1,860 | $1.24 | 4d | 1 | 1.30mi |
| 217 Jayview Ave Lehigh Acres, FL | 3.0 | 2.0 | 1491 | $1,600 | $1.07 | 15d | 1 | 1.34mi |
| 242 S Lake Dr Lehigh Acres, FL | 3.0 | 2.0 | 1572 | $1,600 | $1.02 | 25d | 1 | 1.37mi |
| 738 Joel Blvd Lehigh Acres, FL | 2.0 | 2.0 | 968 | $1,050 | $1.08 | 25d | 1 | 1.43mi |
| 503 Penn Rd W Lehigh Acres, FL | 3.0 | 2.0 | 1256 | $1,750 | $1.39 | 15d | 1 | 1.48mi |
HOA detail
- Monthly dues
- $290 · $3,480/yr
- Likely covers
- watertrashlandscapingexterior maint.
Listing history 4 events
-
2026-06-22days on market $119,900 Active 5 DOM
-
2026-06-18days on market $119,900 Active 2 DOM
-
2026-06-16remarks 413-char remark
-
2026-06-16$119,900 Active 1 DOM
ⓘ Source: listings_history table (triggers on properties + properties_extension) + one-shot
backfill from property_details.listing_events for pre-trigger history.
Tax reassessment forecast FL · Resets to sale price
- Current annual tax
- $885 · $74/mo
- Projected year-2 tax
- $995 · $83/mo
- Expected delta
- +$111/yr (+$9/mo · 12.5%)
ⓘ Screening estimate from a state-policy table — verify with the county assessor before closing.
Climate risk First Street
- Flood 1/10 Low FEMA zone X (unshaded) · 0% chance over 30 yrs
- Wildfire 1/10 Low
- Heat 10/10 Extreme 7 d/yr ≥108°F today · 28 d/yr by 30 yrs out
- Wind 10/10 Extreme 99% chance of damaging wind over 30 yrs
- Air quality 2/10 Low 1 unhealthy d/yr today · 2 by 30 yrs out
Nearby sold comps map
Loading sold comps map…
Walkable amenities ~0.75 mi
Loading nearby amenities…
Taxation est. · year 1
- Rental income
- $19,559
- − Mortgage interest
- −$6,716
- − Property taxes
- −$885
- − Insurance
- −$600
- − Repairs & maintenance
- −$1,565
- − Management
- −$1,565
- − HOA
- −$3,480
- − Depreciation
- −$3,488
- Taxable income
- $1,262
- Est. tax owed @ 24.0%
- −$303
- After-tax cash flow
- $2,640/yr
For passive investors: Depreciation is non-cash, so a rental often shows a tax loss while cash-flowing — sheltering income. Rental losses are passive: they offset passive income freely, and up to $25,000/yr can offset ordinary (W-2) income if you actively participate and your MAGI is under $100k (phasing out to $0 by $150k); unused losses carry forward. On sale, claimed depreciation is recaptured at up to 25%, and gains may owe capital-gains tax (a 1031 exchange can defer both). Figures are a year-1 estimate at your 24.0% rate — not tax advice; consult a CPA.
Schools (NCES district)
- District
- Lee
- NCES district ID
- 1201080
- Math proficiency
- 47% ▼ -11.00%
- Reading proficiency
- 50% ▼ -4.00%
- Median HH income
- $49,518
- Composite
- 41.49/100
- National rank
- #3458
- State rank
- #42 of 73 in FL
Livability — Lehigh Acres
- Score
- 59/100
- State rank
- #826
- US rank
- #20055
Category grades
Schools grade is shown separately in the Schools card above.
Census & demographics
- Census place
- Lehigh Acres, FL
- County
- Lee County · 788,662 people
- City population
- 130,638
- Metro
- Cape Coral-Fort Myers, FL
- Population (ZIP)
- 27,967
- Household income
- $51,417
- Rent vs Own
- Severe rent burden
- 1027.0
Population outlook (Lee County) Hauer SSP2
- Today (2025)
- 871,946 people
- By 2030
- 955,468 · +9.6%
- By 2040
- 1,113,587 · +27.7%
- By 2050
- 1,256,891 · +44.1%
- By 2075
- 1,560,270 · +78.9%
- By 2100
- 1,726,848 · +98.0%
Race, ethnicity, and origin ACS 2023
- Neighborhood character
- Diverse neighborhood (Simpson 0.63)
- Race & ethnicity
- Hispanic / Latino 44% White 41% Two or more races 21% Black 9% Asian 1%
- Hispanic origin (detail)
- Mexican 7% Puerto Rican 9% Cuban 18% Dominican 2%
- Common ancestry
- Hispanic 3% Romanian 2% Lithuanian 1%
- Foreign-born
- 28% · Canada, Jamaica
- Languages at home
- 59% English-only · Spanish 36% French/Haitian/Cajun 3% Tagalog/Filipino 1%
Political lean MEDSL · Lee
- 2024 margin
- Strong R (+28.4) · D 35.5% · R 63.9%
- 2008→2024 swing
- -18.0pp toward R · 2008: -10.4pp · 2024: -28.4pp
- All cycles
- 2024: R+28.4 2020: R+19.2 2016: R+20.4 2012: R+16.6 2008: R+10.4
Not yet ingested
- Civics
- —
Market trends
- HPI YoY
- ▼ -86.78%
- Current HPI
- 348.8631
- Rent YoY
- ▼ -0.77%
- Metro
- Cape Coral-Fort Myers, FL
- State GDP YoY
- ▲ 3.28%
- F500 in state
- 36
Industry mix (Fortune 500 HQ in FL)
| Industry | F500 HQs | Revenue |
|---|---|---|
| Industrial Technology | 2 | $29B |
|
||
| Insurance | 2 | $17B |
|
||
| Retail | 1 | $60B |
|
||
| Technology Distribution | 1 | $58B |
|
||
| Homebuilding | 1 | $35B |
|
||
| Technology Manufacturing | 1 | $35B |
|
||
Price history
+87.6% since first listed5 events — show timeline
- 2026-06-16 Listed $119,900 FORTMLS
- 2009-05-06 Sold (Public Records) $60,000 Public Records
- 2009-04-30 Sold (MLS) $60,000 FORTMLS
- 2009-04-15 Price Changed $69,900 FORTMLS
- 1996-06-10 Sold (Public Records) $63,900 Public Records
Property tax history
+9.3%/yrLatest (2025): $885 · +14.3% YoY. Source: county tax records.
Cash-flow waterfall
monthlySold comps — $/sqft
last 12 mo · ≤1 miLoading sold comps…