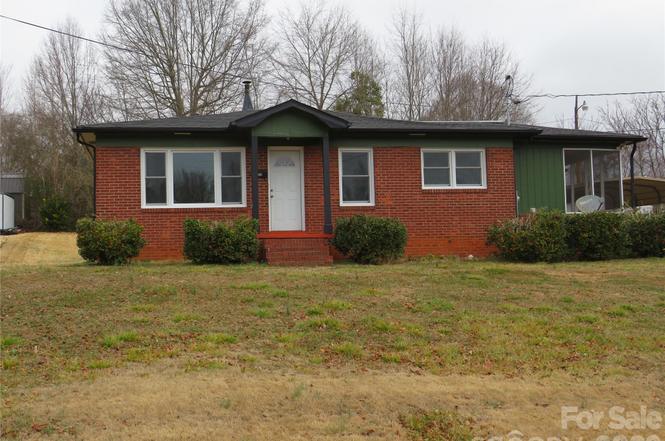
274 Georgia St · Spindale, NC
Flood risk 1/10 · Minimal
- FEMA flood zone
- X (unshaded)
- Chance of flooding over 30 yrs
- 0.0%
- Est. flood insurance / yr
- $507 – $1,088
Fire risk 4/10 · Minor
- Est. fire insurance / yr
- $906 – $1,684
Heat risk 6/10 · Moderate
- Hot days now (above 105°F)
- 7 days/yr
- Hot days in 30 yrs
- 17 days/yr
Wind risk 2/10 · Minimal
- Chance of severe wind over 30 yrs
- 0.0%
Air-quality risk 3/10 · Minor
- Unhealthy air days now
- 3 days/yr
- Unhealthy air days in 30 yrs
- 3 days/yr
Risk factors via First Street. Map © Google.
Why this score? — see what drove the C+ grade
The composite is a weighted blend of 9 inputs, each scored 0–100. Each bar is that input's sub-score; the figure is the points it added to the 100-point composite (weight × sub-score).
- Cash flow +22.6/30.0
- Appreciation +10.0/10.0
- ARV discount +7.5/15.0
- DSCR +7.2/10.0
- 1% rule +5.2/10.0
- Schools +3.6/10.0
- Livability +3.4/5.0
- Rent growth +2.5/5.0
- Condition / age +2.5/5.0
$179,000
🖨 Deal sheet 📄 Offer letter ✓ Due diligence
Listing remarks
Welcome home to this adorable bungalow full of charm and modern updates! This 2-bedroom, 1-bath home features beautiful hardwood floors that add warmth and character throughout. The completely refreshed kitchen shines with stunning new cabinets, updated flooring, and brand-new appliances, making it both stylish and functional. Enjoy the comfort of new windows and fresh interior paint, creating a bright, move-in-ready space. Relax on the cozy screened porch—perfect for morning coffee or unwinding in the evening. Step outside to a spacious backyard offering plenty of room for entertaining, gardening, or play. Whether you're a first-time buyer, downsizing, or looking for the perfect inve
Key facts
- New cabinets
- Updated flooring
- Fresh interior paint
Tags
Property features AI
Finance
- HOA & community: No HOA
Exterior
- Parking: Detached carport; Driveway
- Utilities: City water; Public sewer
- Home design: Single-family residence; One story; Site-built construction; R6 zoning
- Construction: Brick full and wood exterior materials; Crawl space foundation; Built on-site
- Exterior features: Concrete and paved road access; Publicly maintained road
Interior
- Kitchen: Electric oven; Microwave; Refrigerator
- Bedrooms: 2 bedrooms (both on main level)
- Flooring: Vinyl flooring; Wood flooring
- Bathrooms: 1 full bathroom (on main level)
- Heating & cooling: Heat pump for heating and cooling
- Interior features: Ceiling fans in multiple rooms; 6 total rooms
- Laundry & utility: Utility room for laundry
Neighborhood map
What this means for you Summary
Snapshot
- This is a 2-bed/1.0-bath single-family listed at $179k.
Deal economics
- At list price, monthly cash flow is $303 ($4k/yr) — positive.
- The deal already cash-flows at list — no discount required.
- Meets the 1% rule at list price ($2k rent vs $179k).
- Recommended offer: $163k (9.0% below list) — sets the bar for market timing.
Location & tenants
- Location reads 67/100 on livability (#211 in NC) — a middle-class / working-renter tenant base. Strengths: cost of living A+, health & safety A, housing B; Watch: crime C-, schools D+, amenities F.
- Rutherford County Schools (rural): math 43% / reading 44% proficiency, ranked #98 of 178 in NC (top 55%) — families likely to look elsewhere, expect single-tenant / working-renter base with shorter leases; 60% free/reduced lunch — lower-income household profile, screen leases tightly.
- Market conditions: 55 active listings in the ZIP; 1 comparable units currently listed for rent nearby; 193 units permitted in Rutherford County in 2024 (0 in 5+ unit buildings).
Forward outlook
- In year one you build about $19k of equity ($1k loan paydown + $18k appreciation (10.0% local appreciation)).
- Rutherford County population projected at -17% by 2050 — secular population decline; favor cash flow + early exit over multi-decade hold.
- At projected returns (10.0% appreciation + 3.0% rent growth), your $50k cash investment doubles in ~3 years — after that, you're playing with house money.
- By year 2, paydown + projected appreciation supports a ~$31k cash-out refi (75% LTV) — recoverable capital for the next deal without selling this one.
Negotiation context
- It's been on market 120 days — a 9% lower offer ($163k) is reasonable based on typical stale-listing flexibility.
- Current owner paid $28k; list at $179k implies a 539% gain — meaningful room to come down on a strong offer.
Risks & watch-outs
- Watch-outs: built in 1950 — expect roof / HVAC / electrical / plumbing capex.
- Climate carrying-cost: extreme-heat days projected 7→17/yr by 2055 (HVAC capex compounding) — expect insurance premiums to compound above CPI over the hold.
Questions for the listing agent
- It's been on market 120 days. Have you received any prior offers? Is the seller open to a 9% concession, seller financing, or rate buy-down credit?
- Built in 1950 — when were the roof, HVAC, electrical panel, plumbing, and water heater last replaced?
- Why hasn't it sold? Are there any deal-killer items the seller is aware of (foundation, flood, title, zoning, code violations)?
- Is there a deadline driving the sale (1031 exchange, divorce, estate, relocation)? That informs how much negotiation room exists.
- Schools are D-rated, which usually means shorter tenancies and higher turnover. Who's the typical renter profile here, and what's been the actual vacancy rate?
- What's the average days-on-market for RENTAL listings here right now (not sales)? A rising rental-DOM trend means longer vacancies and softer asking-rent achievability than the comps imply.
- What's the recent tenant-quality profile in this submarket — average credit score on applications, eviction rate, late-payment / NSF rate, and stable-employment percentage? A property-management company in the area should have these aggregated.
- How much new for-sale + rental construction is in the pipeline within 1–3 miles? Heavy new supply typically softens prices + rents 12–24 months out; constrained supply supports both.
Investment metrics
- 1% rule
- 1.02% ✓
- Cap rate
- 8.33%
- Cash-on-cash
- 7.26%
- DSCR
- 1.32
- GRM
- 8.2
CMA / ARV
No comps found within radius.
Projected returns pro-forma
10.0% appreciation · 3.0% rent growth · sell at horizon
- IRR
- 29.6%
- Equity multiple
- 3.33×
- Total profit
- $116,766
- Equity at exit
- $161,257
- IRR
- 25.6%
- Equity multiple
- 7.56×
- Total profit
- $328,598
- Equity at exit
- $347,758
Cash invested: $50,120 (down + closing). Projections, not guarantees.
Landlord ↔ Tenant lean methodology
- Overall (STATE)
- 85 Strongly Landlord-Friendly
- State North Carolina
- 85 Strongly Landlord-Friendly · R+3
- County
- — inherits STATE
- City
- — inherits STATE
ZIP-level market 28160
- Home prices YoY
- 3.2%
- Active inventory
- 55
- Price-to-rent
- 8.2×
Monthly cashflow live
- Estimated rent
- $1,820 medium interval (Pro) →
- Mortgage (P&I)
- −$939
- Tax from tax record
- −$121 /mo · $1,455/yr
- Insurance
- −$75
- HOA
- −$0
- Vacancy / Maint / Mgmt
- −$382
- Net cashflow
- $303
Break-even live
UW: 25.0% down · 7.5% · 30yr · 1.5% tax · 5.0% vac · 8.0% maint · 8.0% mgmt
Financing live
Cash to close
- Down payment
- $44,750
- Closing costs
- $5,370
- Reserves months
- —
- Total cash needed
- —
Loan-product check · same deal, 3 products live
Conventional
25% down · 7.5% · 30yr
- Down + closing
- —
- Monthly P&I
- —
- Monthly cashflow
- —
- DSCR
- —
- Eligible?
- —
Personal DTI + credit; lowest rate.
DSCR
20% down · 8.5% · 30yr
- Down + closing
- —
- Monthly P&I
- —
- Monthly cashflow
- —
- DSCR
- —
- Eligible?
- —
No personal income docs; deal must DSCR.
Hard money
10% down · 12.0% · 12mo
- Down + closing
- —
- Monthly P&I
- —
- Monthly cashflow
- —
- DSCR
- —
- Eligible?
- —
Short-term bridge; refi at stabilization.
Rent comps 1 comps
| Address | Beds | Baths | Sqft | Rent | $/sqft | DOM | Units | Dist |
|---|---|---|---|---|---|---|---|---|
| 125 Central St Rutherfordton, NC | 1.0 | 1.0 | 740 | $1,820 | $2.46 | 13d | 1 | 1.41mi |
Listing history 18 events
-
2026-06-19days on market $179,000 Active 120 DOM
-
2026-06-18days on market $179,000 Active 119 DOM
-
2026-06-17days on market $179,000 Active 118 DOM
-
2026-06-16days on market $179,000 Active 117 DOM
-
2026-06-15days on market $179,000 Active 116 DOM
-
2026-06-14days on market $179,000 Active 114 DOM
-
2026-06-13days on market $179,000 Active 113 DOM
-
2026-06-10days on market $179,000 Active 111 DOM
-
2026-06-09days on market $179,000 Active 110 DOM
-
2026-06-08days on market $179,000 Active 109 DOM
-
2026-06-07days on market $179,000 Active 108 DOM
-
2026-06-02days on market $179,000 Active 103 DOM
-
2026-06-01days on market $179,000 Active 102 DOM
-
2026-05-31days on market $179,000 Active 101 DOM
-
2026-05-30days on market $179,000 Active 100 DOM
-
2026-03-31price $179,000
-
2026-02-19$185,000 Active
-
2014-09-29soldstatus $28,000
ⓘ Source: listings_history table (triggers on properties + properties_extension) + one-shot
backfill from property_details.listing_events for pre-trigger history.
Tax reassessment forecast NC · Resets to sale price
- Current annual tax
- $1,455 · $121/mo
- Projected year-2 tax
- $1,468 · $122/mo
- Expected delta
- +$12/yr (+$1/mo · 0.9%)
ⓘ Screening estimate from a state-policy table — verify with the county assessor before closing.
Climate risk First Street
- Flood 1/10 Low FEMA zone X (unshaded) · 0% chance over 30 yrs
- Wildfire 4/10 Moderate
- Heat 6/10 Major 7 d/yr ≥105°F today · 17 d/yr by 30 yrs out
- Wind 2/10 Low 0% chance of damaging wind over 30 yrs
- Air quality 3/10 Moderate 3 unhealthy d/yr today · 3 by 30 yrs out
Nearby sold comps map
Loading sold comps map…
Walkable amenities ~0.75 mi
Loading nearby amenities…
Taxation est. · year 1
- Rental income
- $21,840
- − Mortgage interest
- −$10,027
- − Property taxes
- −$1,455
- − Insurance
- −$895
- − Repairs & maintenance
- −$1,747
- − Management
- −$1,747
- − Depreciation
- −$5,207
- Taxable income
- $761
- Est. tax owed @ 24.0%
- −$183
- After-tax cash flow
- $3,456/yr
For passive investors: Depreciation is non-cash, so a rental often shows a tax loss while cash-flowing — sheltering income. Rental losses are passive: they offset passive income freely, and up to $25,000/yr can offset ordinary (W-2) income if you actively participate and your MAGI is under $100k (phasing out to $0 by $150k); unused losses carry forward. On sale, claimed depreciation is recaptured at up to 25%, and gains may owe capital-gains tax (a 1031 exchange can defer both). Figures are a year-1 estimate at your 24.0% rate — not tax advice; consult a CPA.
Schools (NCES district)
- District
- Rutherford County Schools
- NCES district ID
- 3704080
- Math proficiency
- 43% ▼ -1.00%
- Reading proficiency
- 44% ▼ -2.00%
- Median HH income
- $36,490
- Composite
- 36.11/100
- National rank
- #4753
- State rank
- #98 of 178 in NC
Livability — Spindale
- Score
- 67/100
- State rank
- #211
- US rank
- #10189
Category grades
Schools grade is shown separately in the Schools card above.
Census & demographics
- Census place
- Spindale, NC
- City population
- 3,825
- Population (ZIP)
- 3,825
Population outlook (Rutherford County) Hauer SSP2
- Today (2025)
- 63,695 people
- By 2030
- 61,670 · -3.2%
- By 2040
- 57,212 · -10.2%
- By 2050
- 52,763 · -17.2%
- By 2075
- 44,493 · -30.1%
- By 2100
- 38,127 · -40.1%
Race, ethnicity, and origin ACS 2023
- Neighborhood character
- Predominantly White (77%)
- Race & ethnicity
- White 77% Black 16% Two or more races 4% Hispanic / Latino 2%
- Common ancestry
- Serbian 5% Slovak 3% Subsaharan African 2%
- Foreign-born
- 2% · Canada
- Languages at home
- 95% English-only · Spanish 2% Russian/Polish/Slavic 2% Other Asian/Pacific 1%
Political lean MEDSL · Rutherford
- 2024 margin
- Solid R (+47.8) · D 25.8% · R 73.6%
- 2008→2024 swing
- -16.0pp toward R · 2008: -31.8pp · 2024: -47.8pp
- All cycles
- 2024: R+47.8 2020: R+45.8 2016: R+47.9 2012: R+33.5 2008: R+31.8
Not yet ingested
- Civics
- —
Market trends
- HPI YoY
- ▲ 10.11%
- Current HPI
- 328.8325
- Rent YoY
- —
- Metro
- —
- State GDP YoY
- ▲ 3.28%
- F500 in state
- 26
Industry mix (Fortune 500 HQ in NC)
| Industry | F500 HQs | Revenue |
|---|---|---|
| Financial Services | 2 | $213B |
|
||
| Retail | 2 | $95B |
|
||
| Industrial Conglomerate | 1 | $38B |
|
||
| Metals / Steel | 1 | $35B |
|
||
| Utilities | 1 | $30B |
|
||
| Industrial Machinery | 1 | $19B |
|
||
Price history
+539.3% since first listed3 events — show timeline
- 2026-03-31 Price Changed $179,000 CANOPYMLS as Distributed by MLS Grid
- 2026-02-19 Listed $185,000 CANOPYMLS as Distributed by MLS Grid
- 2014-09-29 Sold (Public Records) $28,000 Public Records
Property tax history
+10.8%/yrLatest (2025): $1,455 · +3.2% YoY. Source: county tax records.
Cash-flow waterfall
monthlySold comps — $/sqft
last 12 mo · ≤1 miLoading sold comps…