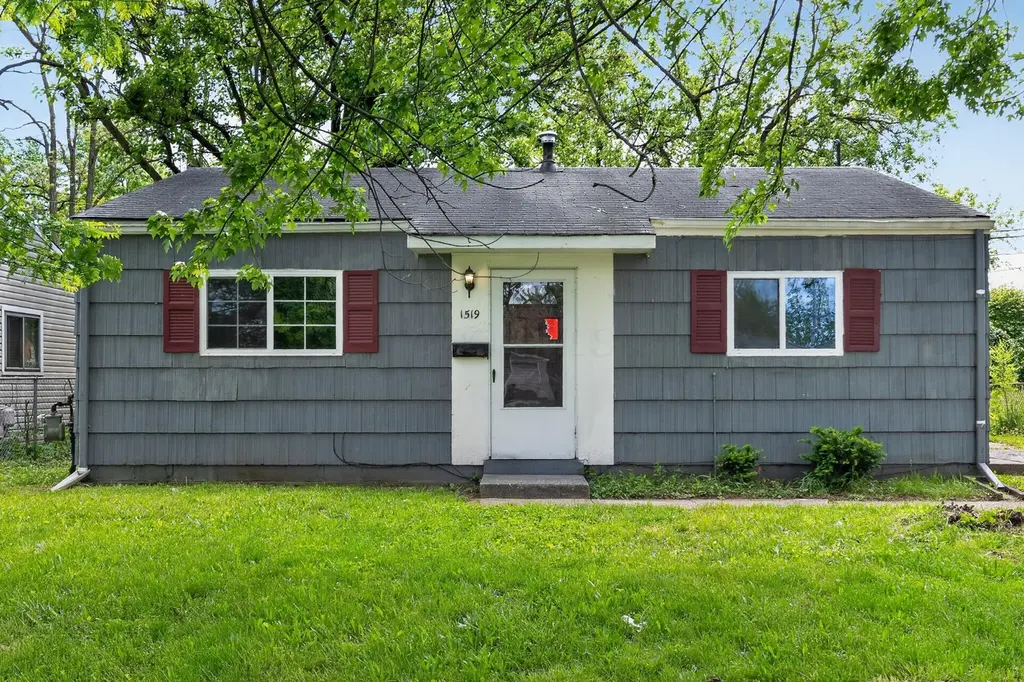
1519 Grovewood Dr · Columbus, OH
Flood risk 1/10 · Minimal
- FEMA flood zone
- X (unshaded)
- Chance of flooding over 30 yrs
- 0.0%
- Est. flood insurance / yr
- $507 – $1,088
Fire risk 1/10 · Minimal
- Est. fire insurance / yr
- $713 – $1,323
Heat risk 4/10 · Minor
- Hot days now (above 100°F)
- 7 days/yr
- Hot days in 30 yrs
- 17 days/yr
Wind risk 2/10 · Minimal
- Chance of severe wind over 30 yrs
- 1.0%
Air-quality risk 3/10 · Minor
- Unhealthy air days now
- 2 days/yr
- Unhealthy air days in 30 yrs
- 3 days/yr
Risk factors via First Street. Map © Google.
Why this score? — see what drove the C+ grade
The composite is a weighted blend of 9 inputs, each scored 0–100. Each bar is that input's sub-score; the figure is the points it added to the 100-point composite (weight × sub-score).
- Cash flow +24.7/30.0
- ARV discount +14.2/15.0
- DSCR +8.0/10.0
- 1% rule +5.9/10.0
- Livability +4.0/5.0
- Rent growth +3.1/5.0
- Condition / age +2.5/5.0
- Schools +1.7/10.0
- Appreciation +0.0/10.0
$144,900
🖨 Deal sheet (PDF) 📄 Offer letter ✓ Due diligence
Listing remarks
Welcome to this charming and move-in-ready ranch home in the established Southfield neighborhood. This property features a functional floor plan with three comfortable bedrooms and a full bathroom. The interior boasts a cozy living area with large windows that provide plenty of natural light. The kitchen and dining area are designed for efficiency and overlook the private rear yard. Outside, you will find a large, level lot perfect for gardening or outdoor entertaining, along with a detached garage providing secure parking and additional storage.
Key facts
- Large windows
- Cozy living area
- Private rear yard
Tags
Property features AI
Finance
- Other: Standard listing conditions
Exterior
- Utilities: Public water; Public sewer
- Home design: Single-family residence; One story; Built in 1960; No shared/common walls
- Construction: Built in 1960; Slab foundation
- Exterior features: Slab foundation; Lot about 0.19 acre
Interior
- Bedrooms: Three main-level bedrooms
- Flooring: Wood flooring; Vinyl flooring
- Bathrooms: One full bathroom
- Heating & cooling: Central air conditioning; Forced air heating
- Interior features: Living area approximately 864; Wood and vinyl flooring
Neighborhood map
What this means for you Summary
Snapshot
- This is a 3-bed/1.0-bath single-family listed at $145k.
Deal economics
- At list price, monthly cash flow is $303 ($4k/yr) — positive.
- The deal already cash-flows at list — no discount required.
- Meets the 1% rule at list price ($2k rent vs $145k).
- Recommended offer: $141k (3.0% below list) — sets the bar for market timing.
- Cap rate 8.8% vs local median 3.8% in Columbus — top-decile yield for the area; either an underpriced asset or a hidden risk that comps aren't pricing in. Stress-test before assuming the spread holds.
Location & tenants
- Location reads 81/100 on livability (#97 in OH, #1,491 nationally) — a professional / high-income tenant draw. Strengths: commute A+, cost of living A+, housing A+; Watch: employment C-, crime F.
- Columbus City School District (urban): math 15% / reading 26% proficiency, ranked #626 of 656 in OH (top 95%) — low school quality limits family demand, transient renter base, plan for 1-2y turnover; 72% free/reduced lunch — lower-income household profile, screen leases tightly.
- Zoned schools: Indianola Informal K-8 School (math 43% / reading 58%, grade D+, #896 of 1,584 statewide, top 57%, 684 students, 0% FRL); Arts Impact Middle School (Aims) (math 17% / reading 25%, grade F, #608 of 654 statewide, top 93%, 532 students, 0% FRL); Columbus Alternative High School (math 27% / reading 74%, grade D+, #380 of 781 statewide, top 49%, 758 students, 0% FRL) — zoned schools average 0% FRL vs 72% district-wide (72 pts lower); this property's tenant base skews higher-income than the district average.
- Zoned-school proficiency averages 41% at this address vs 20% district-wide (+20 pts) — the actual schools serving this property are materially stronger than the Columbus City School District average implies; a family-tenant draw the district grade alone would hide.
- Market conditions: Rents rising (+2.3%/yr); 198 active listings in the ZIP; 7 comparable units currently listed for rent nearby; rentals leasing fast (median 10d on market — plan ~1-2 weeks tenant-placement turnaround); 8,139 units permitted in Franklin County in 2024 (5,940 in 5+ unit buildings).
Forward outlook
- Local home prices are declining (-3.0%/yr); year-one equity from $1k of loan paydown is wiped out by about $4k of value loss. Plan a longer hold.
- Franklin County population projected at +34% by 2050 — long-run rental-demand tailwind backs the buy-and-hold thesis.
Negotiation context
- It's been on market 33 days — a 3% lower offer ($141k) is reasonable based on typical stale-listing flexibility.
Questions for the listing agent
- It's been on market 33 days. Have you received any prior offers? Is the seller open to a 3% concession, seller financing, or rate buy-down credit?
- Built in 1960 — when were the roof, HVAC, electrical panel, plumbing, and water heater last replaced?
- Is there a deadline driving the sale (1031 exchange, divorce, estate, relocation)? That informs how much negotiation room exists.
- Crime grade is F in this area — have there been break-ins, vandalism, or insurance claims at this property in the last 3 years? What carrier currently insures it and at what premium?
- What's the average days-on-market for RENTAL listings here right now (not sales)? A rising rental-DOM trend means longer vacancies and softer asking-rent achievability than the comps imply.
- What's the recent tenant-quality profile in this submarket — average credit score on applications, eviction rate, late-payment / NSF rate, and stable-employment percentage? A property-management company in the area should have these aggregated.
- How much new for-sale + rental construction is in the pipeline within 1–3 miles? Heavy new supply typically softens prices + rents 12–24 months out; constrained supply supports both.
Investment metrics
- 1% rule
- 1.09% ✓
- Cap rate
- 8.80%
- Cash-on-cash
- 8.95%
- DSCR
- 1.40
- GRM
- 7.7
CMA / ARV
- ARV (on-the-fly)
- $170,208
- Comps found
- 12
Show comp detail 12 sales within ~0.75 mi
| Address | Dist | Beds/Ba | Sqft | Sold | Price | $/sf | Match |
|---|---|---|---|---|---|---|---|
| 3067 Huntington Dr | 0.08mi | 3/1.0 | 864 (0%) | 4mo | $158,000 | $183 | 93 |
| 3072 Bluefield Dr | 0.09mi | 3/1.0 | 864 (0%) | 5mo | $180,000 | $208 | 91 |
| 3115 Houston Dr | 0.14mi | 3/1.0 | 864 (0%) | 4mo | $106,000 | $123 | 90 |
| 1471 Watkins Rd | 0.09mi | 3/1.0 | 864 (0%) | 7mo | $165,000 | $191 | 90 |
| 3018 Woodway Rd | 0.20mi | 3/1.0 | 896 (+4%) | 1mo | $176,400 | $197 | 84 |
| 2963 Fairwood Ave | 0.18mi | 3/1.0 | 896 (+4%) | 6mo | $180,200 | $201 | 80 |
| 1382 Southfield Dr S | 0.25mi | 3/1.0 | 896 (+4%) | 6mo | $175,000 | $195 | 78 |
| 3114 Fairwood Ave | 0.21mi | 3/1.0 | 932 (+8%) | 1mo | $170,000 | $182 | 76 |
| 1336 Southfield Dr S | 0.30mi | 3/1.0 | 896 (+4%) | 9mo | $182,000 | $203 | 72 |
| 3217 Fairwood Ave | 0.38mi | 3/1.0 | 825 (-4%) | 8mo | $230,000 | $279 | 68 |
| 3032 Baker Hill Rd | 0.49mi | 3/1.0 | 938 (+9%) | 2mo | $202,900 | $216 | 61 |
| 1338 Clarfield Ave | 0.33mi | 2/1.0 (-1) | 985 (+14%) | 8mo | $170,000 | $173 | 50 |
Match score weights: distance 35% · size 25% · config 20% · recency 20%. Top-matched comps best support the ARV.
Projected returns pro-forma
-3.0% appreciation · 2.32% rent growth · sell at horizon
- IRR
- -3.5%
- Equity multiple
- 0.87×
- Total profit
- $-5,289
- Equity at exit
- $21,605
- IRR
- 5.4%
- Equity multiple
- 1.39×
- Total profit
- $15,828
- Equity at exit
- $12,528
Cash invested: $40,572 (down + closing). Projections, not guarantees.
Landlord ↔ Tenant lean methodology
- Overall (STATE)
- 73 Landlord-Friendly
- State Ohio
- 73 Landlord-Friendly · R+6
- County
- — inherits STATE
- City
- — inherits STATE
ZIP-level market 43207
- Rents YoY
- 2.3%
- Active inventory
- 198
- Price-to-rent
- 7.7×
Monthly cashflow live
- Estimated rent
- $1,577 high interval (Pro) →
- Mortgage (P&I)
- −$760
- Tax from tax record
- −$123 /mo · $1,479/yr
- Insurance
- −$60
- HOA
- −$0
- Vacancy / Maint / Mgmt
- −$331
- Net cashflow
- $303
Break-even live
Sensitivity live
| Price | -10% $385 | -5% $344 | +0% $303 | +5% $262 | +10% $221 |
|---|---|---|---|---|---|
| Rent | -10% $178 | -5% $240 | +0% $303 | +5% $365 | +10% $427 |
| Rate | -1.0pp $376 | -0.5pp $339 | base $303 | +0.5pp $265 | +1.0pp $227 |
UW: 25.0% down · 7.5% · 30yr · 1.5% tax · 5.0% vac · 8.0% maint · 8.0% mgmt
Financing live
Cash to close
- Down payment
- $36,225
- Closing costs
- $4,347
- Reserves months
- —
- Total cash needed
- —
Loan-product check · same deal, 3 products live
Conventional
25% down · 7.5% · 30yr
- Down + closing
- —
- Monthly P&I
- —
- Monthly cashflow
- —
- DSCR
- —
- Eligible?
- —
Personal DTI + credit; lowest rate.
DSCR
20% down · 8.5% · 30yr
- Down + closing
- —
- Monthly P&I
- —
- Monthly cashflow
- —
- DSCR
- —
- Eligible?
- —
No personal income docs; deal must DSCR.
Hard money
10% down · 12.0% · 12mo
- Down + closing
- —
- Monthly P&I
- —
- Monthly cashflow
- —
- DSCR
- —
- Eligible?
- —
Short-term bridge; refi at stabilization.
Rent comps 7 comps
| Address | Beds | Baths | Sqft | Rent | $/sqft | DOM | Units | Dist |
|---|---|---|---|---|---|---|---|---|
| 1503 Southfield Dr S Columbus, OH | 3.0 | 1.0 | 900 | $1,395 | $1.55 | 9d | 1 | 0.21mi |
| 1584 Southfield Dr S Columbus, OH | 3.0 | 1.0 | 934 | $1,495 | $1.60 | 5d | 1 | 0.31mi |
| 1285 Evergreen Rd Columbus, OH | 3.0 | 2.0 | 888 | $1,750 | $1.97 | 0d | 1 | 0.38mi |
| 1285 Evergreen Rd Columbus, OH | 3.0 | 2.0 | 888 | $1,750 | $1.97 | 22d | 1 | 0.38mi |
| 3047 Baker Hill Rd Columbus, OH | 3.0 | 1.0 | 896 | $1,300 | $1.45 | 46d | 1 | 0.49mi |
| 838 Lock Ave Columbus, OH | 3.0 | 1.0 | 988 | $1,578 | $1.60 | 4d | 1 | 1.21mi |
| 1074 Tobi Dr Columbus, OH | 3.0 | 1.0 | 1066 | $1,495 | $1.40 | 46d | 1 | 1.41mi |
Listing history 22 events
-
2026-06-21days on market $144,900 Active 33 DOM
-
2026-06-18days on market $144,900 Active 30 DOM
-
2026-06-17days on market $144,900 Active 29 DOM
-
2026-06-16days on market $144,900 Active 28 DOM
-
2026-06-15days on market $144,900 Active 27 DOM
-
2026-06-13days on market $144,900 Active 25 DOM
-
2026-06-13days on market $144,900 Active 24 DOM
-
2026-06-09days on market $144,900 Active 21 DOM
-
2026-06-08days on market $144,900 Active 20 DOM
-
2026-06-07days on market $144,900 Active 19 DOM
-
2026-06-05days on market $144,900 Active 16 DOM
-
2026-06-03days on market $144,900 Active 15 DOM
-
2026-06-02days on market $144,900 Active 14 DOM
-
2026-06-01days on market $144,900 Active 13 DOM
-
2026-05-31days on market $144,900 Active 12 DOM
-
2026-05-19$144,900 Active
-
2024-09-10soldstatus $12,041,000
-
2019-05-31soldstatus $48,000
-
2019-05-31soldstatus $59,000
-
1992-07-30soldstatus $23,000
-
1992-05-04soldstatus $20,000
-
1992-03-13soldstatus $16,000
ⓘ Source: listings_history table (triggers on properties + properties_extension) + one-shot
backfill from property_details.listing_events for pre-trigger history.
Tax reassessment forecast OH · Partial reset (capped growth)
- Current annual tax
- $1,479 · $123/mo
- Projected year-2 tax
- $1,870 · $156/mo
- Expected delta
- +$391/yr (+$33/mo · 26.4%)
ⓘ Screening estimate from a state-policy table — verify with the county assessor before closing.
Climate risk First Street
- Flood 1/10 Low FEMA zone X (unshaded) · 0% chance over 30 yrs
- Wildfire 1/10 Low
- Heat 4/10 Moderate 7 d/yr ≥100°F today · 17 d/yr by 30 yrs out
- Wind 2/10 Low 100% chance of damaging wind over 30 yrs
- Air quality 3/10 Moderate 2 unhealthy d/yr today · 3 by 30 yrs out
Nearby sold comps map
Loading sold comps map…
Walkable amenities ~0.75 mi
Loading nearby amenities…
Taxation est. · year 1
- Rental income
- $18,928
- − Mortgage interest
- −$8,117
- − Property taxes
- −$1,479
- − Insurance
- −$724
- − Repairs & maintenance
- −$1,514
- − Management
- −$1,514
- − Depreciation
- −$4,215
- Taxable income
- $1,365
- Est. tax owed @ 24.0%
- −$328
- After-tax cash flow
- $3,304/yr
For passive investors: Depreciation is non-cash, so a rental often shows a tax loss while cash-flowing — sheltering income. Rental losses are passive: they offset passive income freely, and up to $25,000/yr can offset ordinary (W-2) income if you actively participate and your MAGI is under $100k (phasing out to $0 by $150k); unused losses carry forward. On sale, claimed depreciation is recaptured at up to 25%, and gains may owe capital-gains tax (a 1031 exchange can defer both). Figures are a year-1 estimate at your 24.0% rate — not tax advice; consult a CPA.
Schools (NCES district)
- District
- Columbus City School District
- NCES district ID
- 3904380
- Math proficiency
- 15% ▼ -17.00%
- Reading proficiency
- 26% ▼ -12.00%
- Median HH income
- $38,483
- Composite
- 17.19/100
- National rank
- #9105
- State rank
- #626 of 656 in OH
Livability — Columbus
- Score
- 81/100
- State rank
- #97
- US rank
- #1491
Category grades
Schools grade is shown separately in the Schools card above.
Census & demographics
- Census place
- Columbus, OH
- County
- Franklin County · 1,351,780 people
- City population
- 612,189
- Metro
- Columbus, OH
- Population (ZIP)
- 47,272
- Household income
- $63,310
- Rent vs Own
- Severe rent burden
- 1679.0
Population outlook (Franklin County) Hauer SSP2
- Today (2025)
- 1,456,139 people
- By 2030
- 1,556,890 · +6.9%
- By 2040
- 1,757,349 · +20.7%
- By 2050
- 1,950,539 · +34.0%
- By 2075
- 2,376,171 · +63.2%
- By 2100
- 2,636,796 · +81.1%
Race, ethnicity, and origin ACS 2023
- Neighborhood character
- Diverse neighborhood (Simpson 0.57)
- Race & ethnicity
- White 59% Black 28% Two or more races 7% Hispanic / Latino 5% Asian 1%
- Hispanic origin (detail)
- Mexican 3%
- Common ancestry
- Italian 2% Romanian 2% Slovak 1%
- Foreign-born
- 4% · Canada
- Languages at home
- 95% English-only · Spanish 3% Other Indo-European 1%
Political lean MEDSL · Franklin
- 2024 margin
- Strong D (+28.4) · D 63.7% · R 35.3% · Other 1.0%
- 2008→2024 swing
- +7.7pp toward D · 2008: 20.7pp · 2024: 28.4pp
- All cycles
- 2024: D+28.4 2020: D+31.4 2016: D+25.9 2012: D+21.7 2008: D+20.7
Not yet ingested
- Civics
- —
Market trends
- HPI YoY
- ▼ -244.33%
- Current HPI
- 268.3028
- Rent YoY
- ▲ 2.32%
- Metro
- Columbus, OH
- State GDP YoY
- ▲ 1.98%
- F500 in state
- 48
Industry mix (Fortune 500 HQ in OH)
| Industry | F500 HQs | Revenue |
|---|---|---|
| Insurance | 3 | $145B |
|
||
| Industrial Machinery | 3 | $49B |
|
||
| Financial Services | 3 | $24B |
|
||
| Consumer Goods | 2 | $93B |
|
||
| Aerospace / Defense | 2 | $47B |
|
||
| Utilities | 2 | $33B |
|
||
Price history
+805.6% since first listed7 events — show timeline
- 2026-05-19 Listed $144,900 CBRMLS
- 2024-09-10 Sold (Public Records) $12,041,000 Public Records
- 2019-05-31 Sold (Public Records) $59,000 Public Records
- 2019-05-31 Sold (Public Records) $48,000 Public Records
- 1992-07-30 Sold (Public Records) $23,000 Public Records
- 1992-05-04 Sold (Public Records) $20,000 Public Records
- 1992-03-13 Sold (Public Records) $16,000 Public Records
Property tax history
+2.4%/yrLatest (2024): $1,479 · +1.3% YoY. Source: county tax records.
Cash-flow waterfall
monthlySold comps — $/sqft
last 12 mo · ≤1 miLoading sold comps…