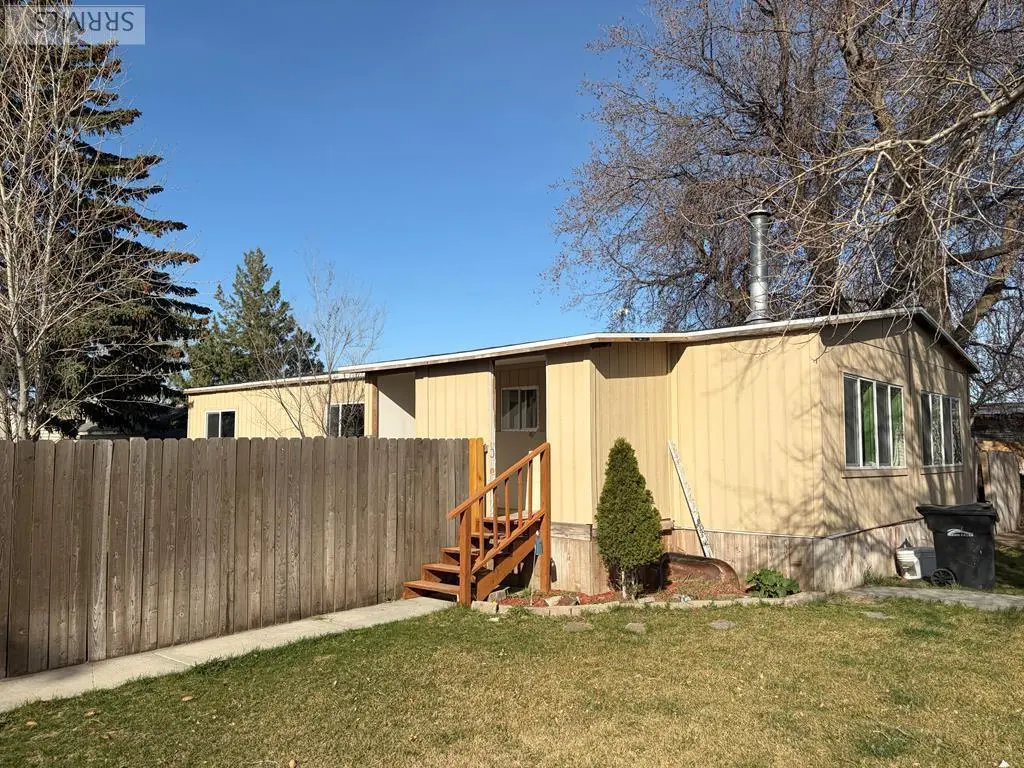
1309 Huckleberry Cir · Idaho Falls, ID
Flood risk No data
- FEMA flood zone
- —
- Chance of flooding over 30 yrs
- —
- Est. flood insurance / yr
- —
Fire risk No data
- Est. fire insurance / yr
- —
Heat risk No data
- Hot days now (above threshold)
- —
- Hot days in 30 yrs
- —
Wind risk No data
- Chance of severe wind over 30 yrs
- —
Air-quality risk No data
- Unhealthy air days now
- —
- Unhealthy air days in 30 yrs
- —
Risk factors via First Street. Map © Google.
Why this score? — see what drove the B grade
The composite is a weighted blend of 9 inputs, each scored 0–100. Each bar is that input's sub-score; the figure is the points it added to the 100-point composite (weight × sub-score).
- Cash flow +30.0/30.0
- 1% rule +10.0/10.0
- DSCR +10.0/10.0
- ARV discount +7.5/15.0
- Livability +4.3/5.0
- Schools +3.7/10.0
- Rent growth +2.6/5.0
- Condition / age +2.5/5.0
- Appreciation +0.0/10.0
$95,000
🖨 Deal sheet 📄 Offer letter ✓ Due diligence
Listing remarks MLS
Affordability and Large Lot! This fixer upper is ready for you to come make it home. Lot rent is ONLY $250 per month, and buyer must be approved by community. This is the biggest corner lot in the park. Shed included outback. Great location to all downtown amenities, shopping, school and recreation. Huge living room with wood burning fireplace open kitchen and dining room area. Master bedroom with ensuite. Only 2 bedrooms but lots of living space
Key facts
- 7,492 sq ft lot
- Built 1979
- Listed 38 days
Property features AI
Finance
- HOA & community: Homeowners association with a $250 monthly fee
Exterior
- Parking: Concrete parking
- Utilities: Public water; Public sewer
- Home design: Manufactured home (without land); Single-story / One level; Residential zoning (BONNEVILLE-R1-RESIDENTIAL)
- Construction: Metal siding; Metal roof
- Exterior features: Deck; Wood fencing
Interior
- Kitchen: Microwave
- Flooring: Laminate flooring
- Bathrooms: 2 full bathrooms
- Heating & cooling: Electric heating; Ceiling fan(s) cooling
- Interior features: Laminate counters; Fireplace (1)
Neighborhood map
What this means for you Summary
Snapshot
- This is a 5-bed/3.0-bath other listed at $95k.
Deal economics
- At list price, monthly cash flow is $761 ($9k/yr) — positive.
- The deal already cash-flows at list — no discount required.
- Meets the 1% rule at list price ($2k rent vs $95k).
- Recommended offer: $92k (3.0% below list) — sets the bar for market timing.
Location & tenants
- Location reads 86/100 on livability (#3 in ID, #428 nationally) — a professional / high-income tenant draw. Strengths: amenities A+, cost of living A+, housing A+.
- Idaho Falls District (urban): math 36% / reading 50% proficiency, ranked #54 of 92 in ID (top 59%) — families likely to look elsewhere, expect single-tenant / working-renter base with shorter leases.
- Market conditions: Rents flat; 397 active listings in the ZIP; 1 comparable units currently listed for rent nearby; solid renter incomes; 2,253 units permitted in Bonneville County in 2024 (1,051 in 5+ unit buildings).
- This rent runs 31% of the median local income ($78k/yr) — at the standard rent-burdened threshold; future hikes will face affordability resistance.
Forward outlook
- Local home prices are declining (-3.0%/yr); year-one equity from $657 of loan paydown is wiped out by about $3k of value loss. Plan a longer hold.
- Bonneville County population projected at +18% by 2050 — long-run rental-demand tailwind backs the buy-and-hold thesis.
- At projected returns (-3.0% appreciation + 0.5% rent growth), your $27k cash investment doubles in ~4 years — after that, you're playing with house money.
Negotiation context
- It's been on market 39 days — a 3% lower offer ($92k) is reasonable based on typical stale-listing flexibility.
- 2 sale attempts since 2y ago with the ask held roughly flat each time — persistent listings suggest the price (not the market) is what's stuck; bring a comps-based counter.
- Current owner paid $59k; list at $95k implies a 61% gain — meaningful room to come down on a strong offer.
Questions for the listing agent
- It's been on market 39 days. Have you received any prior offers? Is the seller open to a 3% concession, seller financing, or rate buy-down credit?
- Built in 1979 — when were the roof, HVAC, electrical panel, plumbing, and water heater last replaced?
- What does the HOA fee cover, when was the last increase, and are there any pending special assessments or reserve-fund shortfalls?
- Is there a deadline driving the sale (1031 exchange, divorce, estate, relocation)? That informs how much negotiation room exists.
- What's the average days-on-market for RENTAL listings here right now (not sales)? A rising rental-DOM trend means longer vacancies and softer asking-rent achievability than the comps imply.
- What's the recent tenant-quality profile in this submarket — average credit score on applications, eviction rate, late-payment / NSF rate, and stable-employment percentage? A property-management company in the area should have these aggregated.
- How much new for-sale + rental construction is in the pipeline within 1–3 miles? Heavy new supply typically softens prices + rents 12–24 months out; constrained supply supports both.
Investment metrics
- 1% rule
- 2.14% ✓
- Cap rate
- 15.91%
- Cash-on-cash
- 34.34%
- DSCR
- 2.53
- GRM
- 3.9
CMA / ARV
No comps found within radius.
Projected returns pro-forma
-3.0% appreciation · 0.51% rent growth · sell at horizon
- IRR
- 26.6%
- Equity multiple
- 2.06×
- Total profit
- $28,272
- Equity at exit
- $14,165
- IRR
- 32.5%
- Equity multiple
- 3.57×
- Total profit
- $68,267
- Equity at exit
- $8,214
Cash invested: $26,600 (down + closing). Projections, not guarantees.
Landlord ↔ Tenant lean methodology
- Overall (STATE)
- 91 Strongly Landlord-Friendly
- State Idaho
- 91 Strongly Landlord-Friendly · R+18
- County
- — inherits STATE
- City
- — inherits STATE
ZIP-level market 83401
- Home prices YoY
- -30.6%
- Rents YoY
- 0.5%
- Active inventory
- 397
- Price-to-rent
- 3.9×
Monthly cashflow live
- Estimated rent
- $2,030 medium interval (Pro) →
- Mortgage (P&I)
- −$498
- Tax from tax record
- −$54 /mo · $653/yr
- Insurance
- −$40
- HOA
- −$250
- Vacancy / Maint / Mgmt
- −$426
- Net cashflow
- $761
Break-even live
UW: 25.0% down · 7.5% · 30yr · 1.5% tax · 5.0% vac · 8.0% maint · 8.0% mgmt
Financing live
Cash to close
- Down payment
- $23,750
- Closing costs
- $2,850
- Reserves months
- —
- Total cash needed
- —
Loan-product check · same deal, 3 products live
Conventional
25% down · 7.5% · 30yr
- Down + closing
- —
- Monthly P&I
- —
- Monthly cashflow
- —
- DSCR
- —
- Eligible?
- —
Personal DTI + credit; lowest rate.
DSCR
20% down · 8.5% · 30yr
- Down + closing
- —
- Monthly P&I
- —
- Monthly cashflow
- —
- DSCR
- —
- Eligible?
- —
No personal income docs; deal must DSCR.
Hard money
10% down · 12.0% · 12mo
- Down + closing
- —
- Monthly P&I
- —
- Monthly cashflow
- —
- DSCR
- —
- Eligible?
- —
Short-term bridge; refi at stabilization.
Rent comps 1 comps
| Address | Beds | Baths | Sqft | Rent | $/sqft | DOM | Units | Dist |
|---|---|---|---|---|---|---|---|---|
| 507 Linden Dr Idaho Falls, ID | 5.0 | 2.0 | 1700 | $1,825 | $1.07 | 21d | 1 | 1.43mi |
HOA detail
- Monthly dues
- $250 · $3,000/yr
Listing history 23 events
-
2026-06-19days on market $95,000 Active 39 DOM
-
2026-06-18days on market $95,000 Active 38 DOM
-
2026-06-17days on market $95,000 Active 37 DOM
-
2026-06-16days on market $95,000 Active 36 DOM
-
2026-06-15days on market $95,000 Active 35 DOM
-
2026-06-14days on market $95,000 Active 33 DOM
-
2026-06-13days on market $95,000 Active 32 DOM
-
2026-06-10days on market $95,000 Active 30 DOM
-
2026-06-09days on market $95,000 Active 29 DOM
-
2026-06-08days on market $95,000 Active 28 DOM
-
2026-06-07days on market $95,000 Active 27 DOM
-
2026-06-05days on market $95,000 Active 24 DOM
-
2026-06-03days on market $95,000 Active 23 DOM
-
2026-06-02days on market $95,000 Active 22 DOM
-
2026-06-01days on market $95,000 Active 21 DOM
-
2026-05-31days on market $95,000 Active 20 DOM
-
2026-05-30days on market $95,000 Active 19 DOM
-
2026-04-29$95,000 Active
-
2025-12-07price $109,000
-
2024-05-03soldstatus Closed 450-char remark
Show marketing remark (450 chars)
Affordability and Large Lot! This fixer upper is ready for you to come make it home. Lot rent is ONLY $250 per month, and buyer must be approved by community. This is the biggest corner lot in the park. Shed included outback. Great location to all downtown amenities, shopping, school and recreation. Huge living room with wood burning fireplace open kitchen and dining room area. Master bedroom with ensuite. Only 2 bedrooms but lots of living space
-
2024-03-21status Pending 450-char remark
Show marketing remark (450 chars)
Affordability and Large Lot! This fixer upper is ready for you to come make it home. Lot rent is ONLY $250 per month, and buyer must be approved by community. This is the biggest corner lot in the park. Shed included outback. Great location to all downtown amenities, shopping, school and recreation. Huge living room with wood burning fireplace open kitchen and dining room area. Master bedroom with ensuite. Only 2 bedrooms but lots of living space
-
2024-03-16$55,000 Active 450-char remark
Show marketing remark (450 chars)
Affordability and Large Lot! This fixer upper is ready for you to come make it home. Lot rent is ONLY $250 per month, and buyer must be approved by community. This is the biggest corner lot in the park. Shed included outback. Great location to all downtown amenities, shopping, school and recreation. Huge living room with wood burning fireplace open kitchen and dining room area. Master bedroom with ensuite. Only 2 bedrooms but lots of living space
-
1990-01-01soldstatus $59,000
ⓘ Source: listings_history table (triggers on properties + properties_extension) + one-shot
backfill from property_details.listing_events for pre-trigger history.
Tax reassessment forecast ID · Resets to sale price
- Current annual tax
- $653 · $54/mo
- Projected year-2 tax
- $656 · $55/mo
- Expected delta
- +$2/yr ($0/mo · 0.4%)
ⓘ Screening estimate from a state-policy table — verify with the county assessor before closing.
Nearby sold comps map
Loading sold comps map…
Walkable amenities ~0.75 mi
Loading nearby amenities…
Taxation est. · year 1
- Rental income
- $24,356
- − Mortgage interest
- −$5,321
- − Property taxes
- −$653
- − Insurance
- −$475
- − Repairs & maintenance
- −$1,948
- − Management
- −$1,948
- − HOA
- −$3,000
- − Depreciation
- −$2,764
- Taxable income
- $8,246
- Est. tax owed @ 24.0%
- −$1,979
- After-tax cash flow
- $7,156/yr
For passive investors: Depreciation is non-cash, so a rental often shows a tax loss while cash-flowing — sheltering income. Rental losses are passive: they offset passive income freely, and up to $25,000/yr can offset ordinary (W-2) income if you actively participate and your MAGI is under $100k (phasing out to $0 by $150k); unused losses carry forward. On sale, claimed depreciation is recaptured at up to 25%, and gains may owe capital-gains tax (a 1031 exchange can defer both). Figures are a year-1 estimate at your 24.0% rate — not tax advice; consult a CPA.
Schools (NCES district)
- District
- Idaho Falls District
- NCES district ID
- 1601530
- Math proficiency
- 36% ▼ -2.00%
- Reading proficiency
- 50% ▲ 1.00%
- Median HH income
- $48,119
- Composite
- 36.75/100
- National rank
- #4581
- State rank
- #54 of 92 in ID
Livability — Idaho Falls
- Score
- 86/100
- State rank
- #3
- US rank
- #428
Category grades
Schools grade is shown separately in the Schools card above.
Census & demographics
- Census place
- Idaho Falls, ID
- County
- Bonneville County · 125,162 people
- City population
- 105,466
- Metro
- Idaho Falls, ID
- Population (ZIP)
- 47,972
- Household income
- $78,497
- Rent vs Own
- Severe rent burden
- 422.0
Population outlook (Bonneville County) Hauer SSP2
- Today (2025)
- 120,170 people
- By 2030
- 124,993 · +4.0%
- By 2040
- 134,091 · +11.6%
- By 2050
- 142,122 · +18.3%
- By 2075
- 157,767 · +31.3%
- By 2100
- 160,316 · +33.4%
Race, ethnicity, and origin ACS 2023
- Neighborhood character
- Predominantly White (80%)
- Race & ethnicity
- White 80% Hispanic / Latino 15% Two or more races 8%
- Hispanic origin (detail)
- Mexican 11% Puerto Rican 1%
- Common ancestry
- Italian 4% Slovak 3% Portuguese 2%
- Foreign-born
- 4% · Canada
- Languages at home
- 90% English-only · Spanish 9%
Political lean MEDSL · Bonneville
- 2024 margin
- Solid R (+45.4) · D 25.6% · R 71.0% · Other 3.4%
- 2008→2024 swing
- -2.4pp toward R · 2008: -43.0pp · 2024: -45.4pp
- All cycles
- 2024: R+45.4 2020: R+43.6 2016: R+40.2 2012: R+51.8 2008: R+43.0
Not yet ingested
- Civics
- —
Market trends
- HPI YoY
- ▼ -164.87%
- Current HPI
- 374.2807
- Rent YoY
- ▲ 0.51%
- Metro
- Idaho Falls, ID
- State GDP YoY
- ▲ 4.51%
- F500 in state
- 6
Industry mix (Fortune 500 HQ in ID)
| Industry | F500 HQs | Revenue |
|---|---|---|
| Retail | 1 | $79B |
|
||
| Technology | 1 | $25B |
|
||
| Food / Agriculture | 1 | $6B |
|
||
Price history
+61.0% since first listed6 events — show timeline
- 2026-04-29 Listed $95,000 SRMLS
- 2025-12-07 Price Changed $109,000 SRMLS
- 2024-05-03 Sold (MLS) — SRMLS
- 2024-03-21 Pending — SRMLS
- 2024-03-16 Listed $55,000 SRMLS
- 1990-01-01 Sold (Public Records) $59,000 Public Records
Property tax history
+7.2%/yrLatest (2025): $653 · +38.7% YoY. Source: county tax records.
Cash-flow waterfall
monthlySold comps — $/sqft
last 12 mo · ≤1 miLoading sold comps…