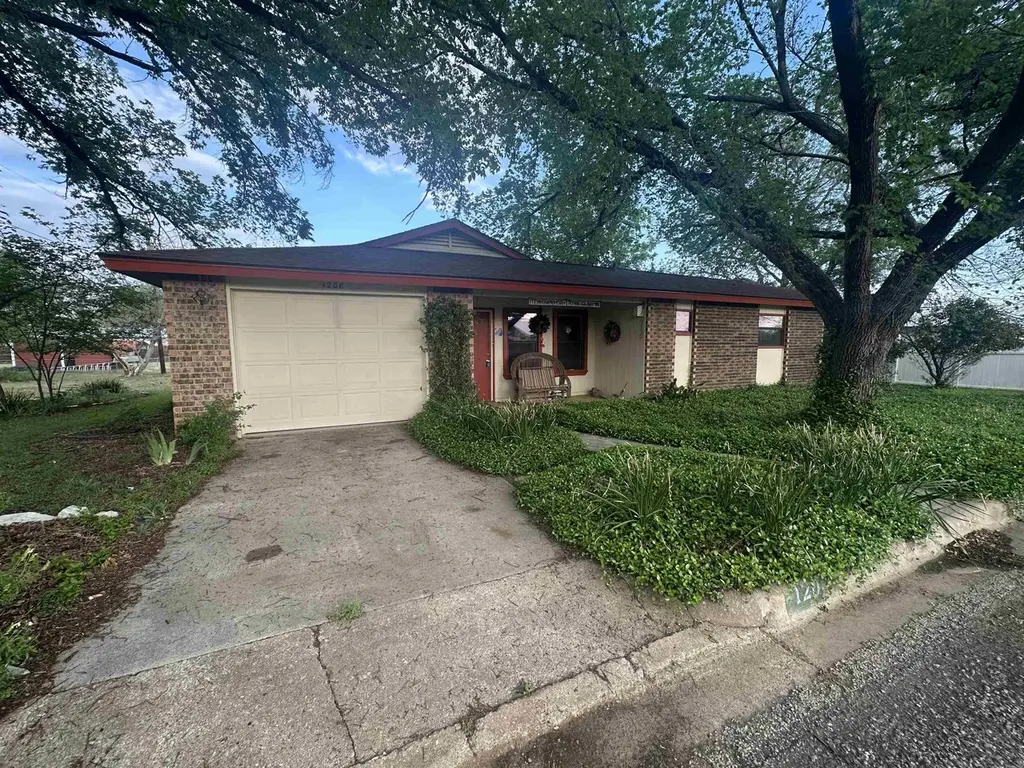
1208 Olive St · Llano, TX
Flood risk 1/10 · Minimal
- FEMA flood zone
- X (unshaded)
- Chance of flooding over 30 yrs
- 0.0%
- Est. flood insurance / yr
- $507 – $1,088
Fire risk 5/10 · Moderate
- Est. fire insurance / yr
- $1,222 – $2,270
Heat risk 8/10 · Major
- Hot days now (above 108°F)
- 7 days/yr
- Hot days in 30 yrs
- 23 days/yr
Wind risk 6/10 · Moderate
- Chance of severe wind over 30 yrs
- 56.0%
Air-quality risk 1/10 · Minimal
- Unhealthy air days now
- 0 days/yr
- Unhealthy air days in 30 yrs
- 0 days/yr
Risk factors via First Street. Map © Google.
Why this score? — see what drove the D grade
The composite is a weighted blend of 9 inputs, each scored 0–100. Each bar is that input's sub-score; the figure is the points it added to the 100-point composite (weight × sub-score).
- Cash flow +17.1/30.0
- DSCR +5.3/10.0
- 1% rule +4.1/10.0
- Schools +3.5/10.0
- Livability +3.5/5.0
- ARV discount +2.6/15.0
- Rent growth +2.5/5.0
- Condition / age +2.5/5.0
- Appreciation +0.0/10.0
$219,000
🖨 Deal sheet 📄 Offer letter ✓ Due diligence
Listing remarks MLS
Charming brick home nestled in a desirable Llano neighborhood! This inviting 3-bedroom, 1.5-bath residence offers 1,122 square feet of comfortable living space. The home features a functional layout with abundant natural light, creating a warm and welcoming atmosphere throughout. Enjoy a spacious living area, well-sized bedrooms, and a cozy feel that makes it perfect for families, first-time buyers, or those looking to downsize. The kitchen and dining areas provide great potential for everyday living. Step outside to appreciate the peaceful surroundings and established neighborhood, ideal for quiet living while still being conveniently close to local amenities. A one-car garage adds practicality and additional storage. Whether you’re looking for a full-time residence or an investment opportunity, this charming home offers both comfort and potential in the heart of Llano.
Key facts
- One-car garage
- Spacious living area
- Natural light
Tags
Neighborhood map
What this means for you Summary
Snapshot
- This is a 3-bed/2.0-bath single-family listed at $219k.
Deal economics
- At list price, monthly cash flow is $152 ($2k/yr) — positive.
- The deal already cash-flows at list — no discount required.
- To meet the 1% rule (rent ≥ 1% of price), the offer needs to be $200k (8.7% below list).
- Recommended offer: $200k (8.7% below list) — sets the bar for 1% rule.
Location & tenants
- Location reads 69/100 on livability (#407 in TX) — a middle-class / working-renter tenant base. Strengths: cost of living A+, housing A+, crime A-; Watch: schools D, amenities F, commute F.
- Llano ISD (town): math 40% / reading 43% proficiency, ranked #359 of 826 in TX (top 44%) — families likely to look elsewhere, expect single-tenant / working-renter base with shorter leases.
- Market conditions: 241 active listings in the ZIP; 1 comparable units currently listed for rent nearby; 121 units permitted in Llano County in 2024 (0 in 5+ unit buildings).
Forward outlook
- Local home prices are declining (-3.0%/yr); year-one equity from $2k of loan paydown is wiped out by about $7k of value loss. Plan a longer hold.
- Llano County population projected at +11% by 2050 — modest demand growth; plan on rents tracking national, not racing it.
Negotiation context
- It's been on market 76 days — a 6% lower offer ($206k) is reasonable based on typical stale-listing flexibility.
Risks & watch-outs
- Climate carrying-cost: major wind risk, 56% chance of damaging wind over 30y; moderate wildfire risk; extreme-heat days projected 7→23/yr by 2055 (HVAC capex compounding) — expect insurance premiums to compound above CPI over the hold.
Questions for the listing agent
- It's been on market 76 days. Have you received any prior offers? Is the seller open to a 9% concession, seller financing, or rate buy-down credit?
- Why hasn't it sold? Are there any deal-killer items the seller is aware of (foundation, flood, title, zoning, code violations)?
- Is there a deadline driving the sale (1031 exchange, divorce, estate, relocation)? That informs how much negotiation room exists.
- Schools are D-rated, which usually means shorter tenancies and higher turnover. Who's the typical renter profile here, and what's been the actual vacancy rate?
- The area grade is low — what's the realistic commute time and amenity access for the typical tenant pool here? Any planned neighborhood developments (good or bad) we should know about?
- What's the average days-on-market for RENTAL listings here right now (not sales)? A rising rental-DOM trend means longer vacancies and softer asking-rent achievability than the comps imply.
- What's the recent tenant-quality profile in this submarket — average credit score on applications, eviction rate, late-payment / NSF rate, and stable-employment percentage? A property-management company in the area should have these aggregated.
- How much new for-sale + rental construction is in the pipeline within 1–3 miles? Heavy new supply typically softens prices + rents 12–24 months out; constrained supply supports both.
Investment metrics
- 1% rule
- 0.91% ✗
- Cap rate
- 7.13%
- Cash-on-cash
- 2.97%
- DSCR
- 1.13
- GRM
- 9.1
CMA / ARV
- ARV (median comp)
- $197,316
- List price
- $219,000
- Delta
- 10.99%
- Verdict
- OVERPRICED
- Comps
- 12 within 1.0 mi
Show comp detail 3 sales within ~0.75 mi
| Address | Dist | Beds/Ba | Sqft | Sold | Price | $/sf | Match |
|---|---|---|---|---|---|---|---|
| 1304 E Luce St | 0.16mi | 2/1.5 (-1) | 1,244 (+11%) | 4mo | $225,000 | $181 | 64 |
| 601 E Green St | 0.47mi | 2/1.0 (-1) | 1,121 (-0%) | 6mo | $149,000 | $133 | 64 |
| 908 E Luce St | 0.28mi | 2/1.0 (-1) | 954 (-15%) | 13mo | $109,900 | $115 | 43 |
Match score weights: distance 35% · size 25% · config 20% · recency 20%. Top-matched comps best support the ARV.
Projected returns pro-forma
-3.0% appreciation · 3.0% rent growth · sell at horizon
- IRR
- -11.6%
- Equity multiple
- 0.58×
- Total profit
- $-25,829
- Equity at exit
- $32,654
- IRR
- -2.4%
- Equity multiple
- 0.84×
- Total profit
- $-10,117
- Equity at exit
- $18,935
Cash invested: $61,320 (down + closing). Projections, not guarantees.
Landlord ↔ Tenant lean methodology
- Overall (STATE)
- 87 Strongly Landlord-Friendly
- State Texas
- 87 Strongly Landlord-Friendly · R+5
- County
- — inherits STATE
- City
- — inherits STATE
ZIP-level market 78643
- Home prices YoY
- -3.0%
- Active inventory
- 241
- Price-to-rent
- 9.1×
Monthly cashflow live
- Estimated rent
- $2,000 medium interval (Pro) →
- Mortgage (P&I)
- −$1,148
- Tax from tax record
- −$188 /mo · $2,260/yr
- Insurance
- −$91
- HOA
- −$0
- Vacancy / Maint / Mgmt
- −$420
- Net cashflow
- $152
Break-even live
UW: 25.0% down · 7.5% · 30yr · 1.5% tax · 5.0% vac · 8.0% maint · 8.0% mgmt
Financing live
Cash to close
- Down payment
- $54,750
- Closing costs
- $6,570
- Reserves months
- —
- Total cash needed
- —
Loan-product check · same deal, 3 products live
Conventional
25% down · 7.5% · 30yr
- Down + closing
- —
- Monthly P&I
- —
- Monthly cashflow
- —
- DSCR
- —
- Eligible?
- —
Personal DTI + credit; lowest rate.
DSCR
20% down · 8.5% · 30yr
- Down + closing
- —
- Monthly P&I
- —
- Monthly cashflow
- —
- DSCR
- —
- Eligible?
- —
No personal income docs; deal must DSCR.
Hard money
10% down · 12.0% · 12mo
- Down + closing
- —
- Monthly P&I
- —
- Monthly cashflow
- —
- DSCR
- —
- Eligible?
- —
Short-term bridge; refi at stabilization.
Rent comps 1 comps
| Address | Beds | Baths | Sqft | Rent | $/sqft | DOM | Units | Dist |
|---|---|---|---|---|---|---|---|---|
| 1001 W Haynie St Llano, TX | 3.0 | 2.0 | 1422 | $2,000 | $1.41 | 43d | 1 | 1.50mi |
Listing history 18 events
-
2026-06-18days on market $219,000 Active 76 DOM
-
2026-06-17days on market $219,000 Active 75 DOM
-
2026-06-16days on market $219,000 Active 74 DOM
-
2026-06-15days on market $219,000 Active 73 DOM
-
2026-06-14days on market $219,000 Active 71 DOM
-
2026-06-13days on market $219,000 Active 70 DOM
-
2026-06-10days on market $219,000 Active 68 DOM
-
2026-06-09days on market $219,000 Active 67 DOM
-
2026-06-08days on market $219,000 Active 66 DOM
-
2026-06-07days on market $219,000 Active 65 DOM
-
2026-06-05days on market $219,000 Active 62 DOM
-
2026-06-03days on market $219,000 Active 61 DOM
-
2026-06-02days on market $219,000 Active 60 DOM
-
2026-06-01days on market $219,000 Active 59 DOM
-
2026-05-31days on market $219,000 Active 58 DOM
-
2026-05-31days on market $219,000 Active 57 DOM
-
2026-04-03$219,000 Active 889-char remark
Show marketing remark (889 chars)
Charming brick home nestled in a desirable Llano neighborhood! This inviting 3-bedroom, 1.5-bath residence offers 1,122 square feet of comfortable living space. The home features a functional layout with abundant natural light, creating a warm and welcoming atmosphere throughout. Enjoy a spacious living area, well-sized bedrooms, and a cozy feel that makes it perfect for families, first-time buyers, or those looking to downsize. The kitchen and dining areas provide great potential for everyday living. Step outside to appreciate the peaceful surroundings and established neighborhood, ideal for quiet living while still being conveniently close to local amenities. A one-car garage adds practicality and additional storage. Whether you’re looking for a full-time residence or an investment opportunity, this charming home offers both comfort and potential in the heart of Llano.
-
1995-04-19soldstatus
ⓘ Source: listings_history table (triggers on properties + properties_extension) + one-shot
backfill from property_details.listing_events for pre-trigger history.
Tax reassessment forecast TX · Resets to sale price
- Current annual tax
- $2,260 · $188/mo
- Projected year-2 tax
- $4,008 · $334/mo
- Expected delta
- +$1,748/yr (+$146/mo · 77.4%)
ⓘ Screening estimate from a state-policy table — verify with the county assessor before closing.
Climate risk First Street
- Flood 1/10 Low FEMA zone X (unshaded) · 0% chance over 30 yrs
- Wildfire 5/10 Major
- Heat 8/10 Severe 7 d/yr ≥108°F today · 23 d/yr by 30 yrs out
- Wind 6/10 Major 56% chance of damaging wind over 30 yrs
- Air quality 1/10 Low 0 unhealthy d/yr today · 0 by 30 yrs out
Nearby sold comps map
Loading sold comps map…
Walkable amenities ~0.75 mi
Loading nearby amenities…
Taxation est. · year 1
- Rental income
- $24,000
- − Mortgage interest
- −$12,267
- − Property taxes
- −$2,260
- − Insurance
- −$1,095
- − Repairs & maintenance
- −$1,920
- − Management
- −$1,920
- − Depreciation
- −$6,371
- Taxable loss
- −$1,833
- Est. tax savings @ 24.0%
- +$440
- After-tax cash flow
- $2,264/yr
For passive investors: Depreciation is non-cash, so a rental often shows a tax loss while cash-flowing — sheltering income. Rental losses are passive: they offset passive income freely, and up to $25,000/yr can offset ordinary (W-2) income if you actively participate and your MAGI is under $100k (phasing out to $0 by $150k); unused losses carry forward. On sale, claimed depreciation is recaptured at up to 25%, and gains may owe capital-gains tax (a 1031 exchange can defer both). Figures are a year-1 estimate at your 24.0% rate — not tax advice; consult a CPA.
Schools (NCES district)
- District
- Llano ISD
- NCES district ID
- 4827810
- Math proficiency
- 40% ▼ -5.00%
- Reading proficiency
- 43% ▼ -5.00%
- Median HH income
- $46,746
- Composite
- 35.42/100
- National rank
- #4940
- State rank
- #359 of 826 in TX
Livability — Llano
- Score
- 69/100
- State rank
- #407
- US rank
- #8433
Category grades
Schools grade is shown separately in the Schools card above.
Census & demographics
- Census place
- Llano, TX
- Population (ZIP)
- 6,837
Population outlook (Llano County) Hauer SSP2
- Today (2025)
- 20,847 people
- By 2030
- 21,350 · +2.4%
- By 2040
- 22,281 · +6.9%
- By 2050
- 23,173 · +11.2%
- By 2075
- 25,526 · +22.4%
- By 2100
- 25,866 · +24.1%
Race, ethnicity, and origin ACS 2023
- Neighborhood character
- Predominantly White (89%)
- Race & ethnicity
- White 89% Hispanic / Latino 7% Two or more races 4% Black 1%
- Hispanic origin (detail)
- Mexican 6%
- Common ancestry
- Slovak 3% Lithuanian 3% Serbian 2%
- Foreign-born
- 3% · Canada
- Languages at home
- 94% English-only · Spanish 5%
Political lean MEDSL · Llano
- 2024 margin
- Solid R (+60.9) · D 19.2% · R 80.0%
- 2008→2024 swing
- -8.6pp toward R · 2008: -52.2pp · 2024: -60.9pp
- All cycles
- 2024: R+60.9 2020: R+60.1 2016: R+62.2 2012: R+60.4 2008: R+52.2
Not yet ingested
- Civics
- —
Market trends
- HPI YoY
- ▼ -23.16%
- Current HPI
- 760.73
- Rent YoY
- —
- Metro
- —
- State GDP YoY
- ▲ 3.95%
- F500 in state
- 110
Industry mix (Fortune 500 HQ in TX)
| Industry | F500 HQs | Revenue |
|---|---|---|
| Energy | 16 | $1,198B |
|
||
| Technology | 5 | $198B |
|
||
| Engineering / Construction | 4 | $72B |
|
||
| Energy Services | 3 | $60B |
|
||
| Utilities | 3 | $41B |
|
||
| Healthcare | 2 | $330B |
|
||
Price history
2 events — show timeline
- 2026-04-03 Listed $219,000 HLMLS as distributed by MLS GRID
- 1995-04-19 Sold (Public Records) — Public Records
Property tax history
+5.8%/yrLatest (2025): $2,260 · +14.4% YoY. Source: county tax records.
Cash-flow waterfall
monthlySold comps — $/sqft
last 12 mo · ≤1 miLoading sold comps…