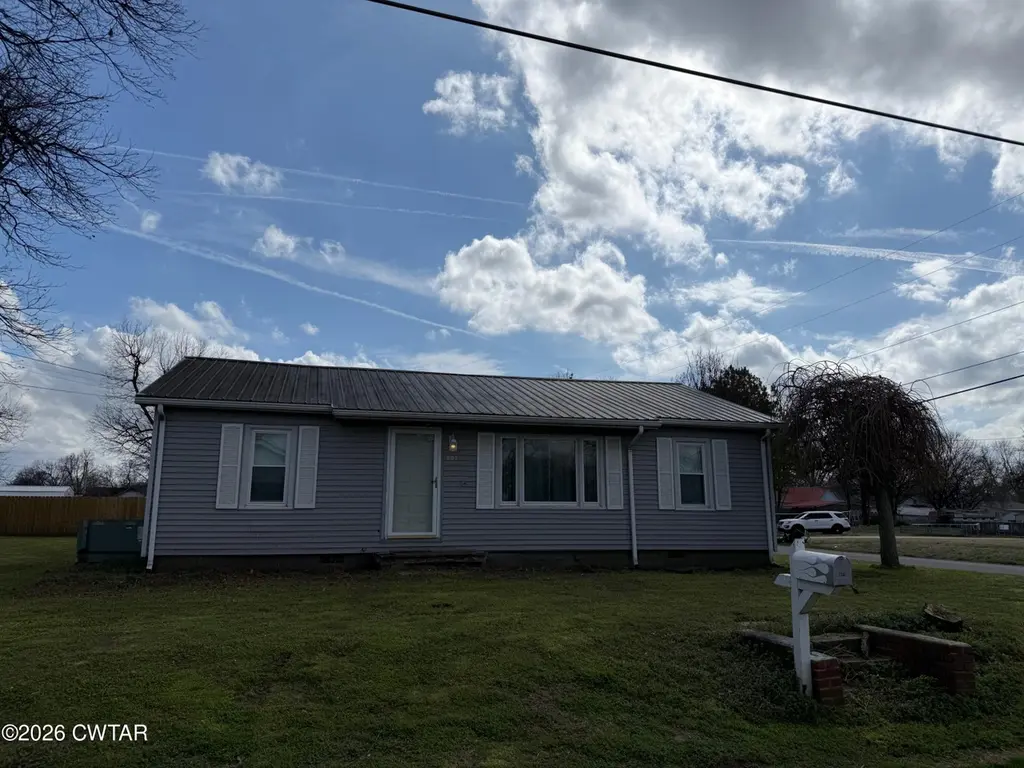
507 North St · Ridgely, TN
Flood risk 1/10 · Minimal
- FEMA flood zone
- X (unshaded)
- Chance of flooding over 30 yrs
- 0.0%
- Est. flood insurance / yr
- $473 – $860
Fire risk 1/10 · Minimal
- Est. fire insurance / yr
- $949 – $1,763
Heat risk 6/10 · Moderate
- Hot days now (above 107°F)
- 7 days/yr
- Hot days in 30 yrs
- 22 days/yr
Wind risk 4/10 · Minor
- Chance of severe wind over 30 yrs
- 8.0%
Air-quality risk 1/10 · Minimal
- Unhealthy air days now
- 0 days/yr
- Unhealthy air days in 30 yrs
- 0 days/yr
Risk factors via First Street. Map © Google.
Why this score? — see what drove the C- grade
The composite is a weighted blend of 9 inputs, each scored 0–100. Each bar is that input's sub-score; the figure is the points it added to the 100-point composite (weight × sub-score).
- Cash flow +17.9/30.0
- ARV discount +15.0/15.0
- DSCR +5.6/10.0
- 1% rule +3.8/10.0
- Appreciation +3.4/10.0
- Livability +3.0/5.0
- Rent growth +2.5/5.0
- Condition / age +2.5/5.0
- Schools +1.0/10.0
$129,900
🖨 Deal sheet 📄 Offer letter ✓ Due diligence
Listing remarks MLS
Very charming and cozy 2 bed, 2 bath home on a corner lot. The house is in a quiet neighborhood close to schools and only a 10 minute drive to Reelfoot Lake! It has a large foyer, office space and laundry room and the kitchen opens up to a beautiful formal dining room. There's lots to see so don't let this one get away. Call today to set up a tour.
Key facts
- 9,147 sq ft lot
- 2 garage spots
- Built 1940
Neighborhood map
What this means for you Summary
Snapshot
- This is a 3-bed/1.0-bath single-family listed at $130k.
Deal economics
- At list price, monthly cash flow is $110 ($1k/yr) — positive.
- The deal already cash-flows at list — no discount required.
- To meet the 1% rule (rent ≥ 1% of price), the offer needs to be $114k (12.0% below list).
- Recommended offer: $114k (12.0% below list) — sets the bar for 1% rule.
Location & tenants
- Location reads 60/100 on livability (#272 in TN) — a middle-class / working-renter tenant base. Strengths: cost of living A+, housing A+, crime B; Watch: health & safety C-, schools F, amenities F.
- Lake County (rural): math 11% / reading 14% proficiency, ranked #135 of 139 in TN (top 97%) — low school quality limits family demand, transient renter base, plan for 1-2y turnover; 71% free/reduced lunch — lower-income household profile, screen leases tightly.
- Market conditions: 21 active listings in the ZIP; 3 units permitted in Lake County in 2024 (0 in 5+ unit buildings).
Forward outlook
- Local home prices are declining (-3.0%/yr); year-one equity from $898 of loan paydown is wiped out by about $4k of value loss. Plan a longer hold.
- Lake County population projected to shrink 8% by 2050 — rents likely to lag national; underwrite the cash flow, not the appreciation.
Negotiation context
- It's been on market 93 days — a 9% lower offer ($118k) is reasonable based on typical stale-listing flexibility.
- 3 sale attempts since 6y ago with the ask held roughly flat each time — persistent listings suggest the price (not the market) is what's stuck; bring a comps-based counter.
Risks & watch-outs
- Watch-outs: built in 1940 — expect roof / HVAC / electrical / plumbing capex.
- Climate carrying-cost: extreme-heat days projected 7→22/yr by 2055 (HVAC capex compounding) — expect insurance premiums to compound above CPI over the hold.
Questions for the listing agent
- It's been on market 93 days. Have you received any prior offers? Is the seller open to a 12% concession, seller financing, or rate buy-down credit?
- Built in 1940 — when were the roof, HVAC, electrical panel, plumbing, and water heater last replaced?
- Why hasn't it sold? Are there any deal-killer items the seller is aware of (foundation, flood, title, zoning, code violations)?
- Is there a deadline driving the sale (1031 exchange, divorce, estate, relocation)? That informs how much negotiation room exists.
- Schools are F-rated, which usually means shorter tenancies and higher turnover. Who's the typical renter profile here, and what's been the actual vacancy rate?
- What's the average days-on-market for RENTAL listings here right now (not sales)? A rising rental-DOM trend means longer vacancies and softer asking-rent achievability than the comps imply.
- What's the recent tenant-quality profile in this submarket — average credit score on applications, eviction rate, late-payment / NSF rate, and stable-employment percentage? A property-management company in the area should have these aggregated.
- How much new for-sale + rental construction is in the pipeline within 1–3 miles? Heavy new supply typically softens prices + rents 12–24 months out; constrained supply supports both.
Investment metrics
- 1% rule
- 0.88% ✗
- Cap rate
- 7.31%
- Cash-on-cash
- 3.64%
- DSCR
- 1.16
- GRM
- 9.5
CMA / ARV
- ARV (median comp)
- $156,145
- List price
- $129,900
- Delta
- -16.81%
- Verdict
- UNDERPRICED
- Comps
- 15 within 1.0 mi
Show comp detail 6 sales within ~0.75 mi
| Address | Dist | Beds/Ba | Sqft | Sold | Price | $/sf | Match |
|---|---|---|---|---|---|---|---|
| 605 King St | 0.19mi | 3/1.0 | 1,702 (-11%) | 10mo | $160,000 | $94 | 64 |
| 662 Hardison St | 0.18mi | 3/2.0 | 2,064 (+8%) | 16mo | $200,000 | $97 | 62 |
| 617 King st St | 0.21mi | 4/2.0 (+1) | 2,173 (+13%) | 2mo | $129,900 | $60 | 58 |
| 533 King St | 0.17mi | 4/2.5 (+1) | 1,694 (-12%) | 17mo | $119,999 | $71 | 47 |
| 215 Jamie Ln | 0.37mi | 2/2.0 (-1) | 1,670 (-13%) | 6mo | $240,000 | $144 | 46 |
| 711 S Main St | 0.73mi | 3/2.0 | 1,663 (-13%) | 20mo | $185,000 | $111 | 23 |
Match score weights: distance 35% · size 25% · config 20% · recency 20%. Top-matched comps best support the ARV.
Projected returns pro-forma
-3.0% appreciation · 3.0% rent growth · sell at horizon
- IRR
- -10.6%
- Equity multiple
- 0.61×
- Total profit
- $-14,079
- Equity at exit
- $19,369
- IRR
- -1.4%
- Equity multiple
- 0.91×
- Total profit
- $-3,415
- Equity at exit
- $11,231
Cash invested: $36,372 (down + closing). Projections, not guarantees.
Landlord ↔ Tenant lean methodology
- Overall (STATE)
- 87 Strongly Landlord-Friendly
- State Tennessee
- 87 Strongly Landlord-Friendly · R+13
- County
- — inherits STATE
- City
- — inherits STATE
ZIP-level market 38080
- Home prices YoY
- -1.7%
- Active inventory
- 21
- Price-to-rent
- 9.5×
Monthly cashflow live
- Estimated rent
- $1,143 medium interval (Pro) →
- Mortgage (P&I)
- −$681
- Tax from tax record
- −$58 /mo · $690/yr
- Insurance
- −$54
- HOA
- −$0
- Vacancy / Maint / Mgmt
- −$240
- Net cashflow
- $110
Break-even live
UW: 25.0% down · 7.5% · 30yr · 1.5% tax · 5.0% vac · 8.0% maint · 8.0% mgmt
Financing live
Cash to close
- Down payment
- $32,475
- Closing costs
- $3,897
- Reserves months
- —
- Total cash needed
- —
Loan-product check · same deal, 3 products live
Conventional
25% down · 7.5% · 30yr
- Down + closing
- —
- Monthly P&I
- —
- Monthly cashflow
- —
- DSCR
- —
- Eligible?
- —
Personal DTI + credit; lowest rate.
DSCR
20% down · 8.5% · 30yr
- Down + closing
- —
- Monthly P&I
- —
- Monthly cashflow
- —
- DSCR
- —
- Eligible?
- —
No personal income docs; deal must DSCR.
Hard money
10% down · 12.0% · 12mo
- Down + closing
- —
- Monthly P&I
- —
- Monthly cashflow
- —
- DSCR
- —
- Eligible?
- —
Short-term bridge; refi at stabilization.
Listing history 24 events
-
2026-06-18days on market $129,900 Active 93 DOM
-
2026-06-17days on market $129,900 Active 92 DOM
-
2026-06-16days on market $129,900 Active 91 DOM
-
2026-06-15days on market $129,900 Active 90 DOM
-
2026-06-13days on market $129,900 Active 88 DOM
-
2026-06-12days on market $129,900 Active 87 DOM
-
2026-06-09days on market $129,900 Active 84 DOM
-
2026-06-08days on market $129,900 Active 83 DOM
-
2026-06-08days on market $129,900 Active 82 DOM
-
2026-06-05days on market $129,900 Active 80 DOM
-
2026-06-03days on market $129,900 Active 78 DOM
-
2026-06-02days on market $129,900 Active 77 DOM
-
2026-06-01days on market $129,900 Active 76 DOM
-
2026-05-31days on market $129,900 Active 75 DOM
-
2026-04-16price $129,900
-
2026-03-17$135,000 Active
-
2024-06-11soldstatus $132,000
-
2024-06-10soldstatus $132,000 Closed 350-char remark
Show marketing remark (350 chars)
Very charming and cozy 2 bed, 2 bath home on a corner lot. The house is in a quiet neighborhood close to schools and only a 10 minute drive to Reelfoot Lake! It has a large foyer, office space and laundry room and the kitchen opens up to a beautiful formal dining room. There's lots to see so don't let this one get away. Call today to set up a tour.
-
2024-05-05status Pending 350-char remark
Show marketing remark (350 chars)
Very charming and cozy 2 bed, 2 bath home on a corner lot. The house is in a quiet neighborhood close to schools and only a 10 minute drive to Reelfoot Lake! It has a large foyer, office space and laundry room and the kitchen opens up to a beautiful formal dining room. There's lots to see so don't let this one get away. Call today to set up a tour.
-
2024-04-30$130,000 Active 350-char remark
Show marketing remark (350 chars)
Very charming and cozy 2 bed, 2 bath home on a corner lot. The house is in a quiet neighborhood close to schools and only a 10 minute drive to Reelfoot Lake! It has a large foyer, office space and laundry room and the kitchen opens up to a beautiful formal dining room. There's lots to see so don't let this one get away. Call today to set up a tour.
-
2021-01-08soldstatus $60,000
-
2020-11-30soldstatus $60,000
-
2020-07-02$55,900
-
2012-12-27soldstatus $29,000
ⓘ Source: listings_history table (triggers on properties + properties_extension) + one-shot
backfill from property_details.listing_events for pre-trigger history.
Tax reassessment forecast TN · Resets to sale price
- Current annual tax
- $690 · $58/mo
- Projected year-2 tax
- $922 · $77/mo
- Expected delta
- +$232/yr (+$19/mo · 33.7%)
ⓘ Screening estimate from a state-policy table — verify with the county assessor before closing.
Climate risk First Street
- Flood 1/10 Low FEMA zone X (unshaded) · 0% chance over 30 yrs
- Wildfire 1/10 Low
- Heat 6/10 Major 7 d/yr ≥107°F today · 22 d/yr by 30 yrs out
- Wind 4/10 Moderate 8% chance of damaging wind over 30 yrs
- Air quality 1/10 Low 0 unhealthy d/yr today · 0 by 30 yrs out
Nearby sold comps map
Loading sold comps map…
Walkable amenities ~0.75 mi
Loading nearby amenities…
Taxation est. · year 1
- Rental income
- $13,717
- − Mortgage interest
- −$7,276
- − Property taxes
- −$690
- − Insurance
- −$650
- − Repairs & maintenance
- −$1,097
- − Management
- −$1,097
- − Depreciation
- −$3,779
- Taxable loss
- −$873
- Est. tax savings @ 24.0%
- +$209
- After-tax cash flow
- $1,532/yr
For passive investors: Depreciation is non-cash, so a rental often shows a tax loss while cash-flowing — sheltering income. Rental losses are passive: they offset passive income freely, and up to $25,000/yr can offset ordinary (W-2) income if you actively participate and your MAGI is under $100k (phasing out to $0 by $150k); unused losses carry forward. On sale, claimed depreciation is recaptured at up to 25%, and gains may owe capital-gains tax (a 1031 exchange can defer both). Figures are a year-1 estimate at your 24.0% rate — not tax advice; consult a CPA.
Schools (NCES district)
- District
- Lake County
- NCES district ID
- 4702280
- Math proficiency
- 11% ▼ -9.00%
- Reading proficiency
- 14% ▼ -9.00%
- Median HH income
- $29,058
- Composite
- 9.69/100
- National rank
- #9833
- State rank
- #135 of 139 in TN
Livability — Ridgely
- Score
- 60/100
- State rank
- #272
- US rank
- #19162
Category grades
Schools grade is shown separately in the Schools card above.
Census & demographics
- Census place
- Ridgely, TN
- Population (ZIP)
- 2,492
Population outlook (Lake County) Hauer SSP2
- Today (2025)
- 7,234 people
- By 2030
- 7,045 · -2.6%
- By 2040
- 6,848 · -5.3%
- By 2050
- 6,681 · -7.6%
- By 2075
- 5,629 · -22.2%
- By 2100
- 4,211 · -41.8%
Race, ethnicity, and origin ACS 2023
- Neighborhood character
- Predominantly White (71%)
- Race & ethnicity
- White 71% Black 17% Two or more races 11% Hispanic / Latino 5%
- Common ancestry
- Italian 1%
- Foreign-born
- 2% · Canada
- Languages at home
- 98% English-only · Spanish 2% French/Haitian/Cajun 1%
Political lean MEDSL · Lake
- 2024 margin
- Solid R (+54.9) · D 22.1% · R 77.0%
- 2008→2024 swing
- -48.1pp toward R · 2008: -6.7pp · 2024: -54.9pp
- All cycles
- 2024: R+54.9 2020: R+47.5 2016: R+39.6 2012: R+13.4 2008: R+6.7
Not yet ingested
- Civics
- —
Market trends
- HPI YoY
- ▼ -3.11%
- Current HPI
- 178.0147
- Rent YoY
- —
- Metro
- —
- State GDP YoY
- ▲ 2.78%
- F500 in state
- 22
Industry mix (Fortune 500 HQ in TN)
| Industry | F500 HQs | Revenue |
|---|---|---|
| Healthcare | 3 | $91B |
|
||
| Retail | 3 | $72B |
|
||
| Transportation / Logistics | 1 | $88B |
|
||
| Paper / Packaging | 1 | $19B |
|
||
| Insurance | 1 | $13B |
|
||
| Energy | 1 | $12B |
|
||
Price history
+347.9% since first listed10 events — show timeline
- 2026-04-16 Price Changed $129,900 CWTAR
- 2026-03-17 Listed $135,000 CWTAR
- 2024-06-11 Sold (Public Records) $132,000 Public Records
- 2024-06-10 Sold (MLS) $132,000 RRAR as distributed by MLS GRID
- 2024-05-05 Pending — RRAR as distributed by MLS GRID
- 2024-04-30 Listed $130,000 RRAR as distributed by MLS GRID
- 2021-01-08 Sold (Public Records) $60,000 Public Records
- 2020-11-30 Sold (MLS) $60,000 CWTAR
- 2020-07-02 Listed $55,900 CWTAR
- 2012-12-27 Sold (Public Records) $29,000 Public Records
Property tax history
+3.4%/yrLatest (2025): $690 · +0.0% YoY. Source: county tax records.
Cash-flow waterfall
monthlySold comps — $/sqft
last 12 mo · ≤1 miLoading sold comps…