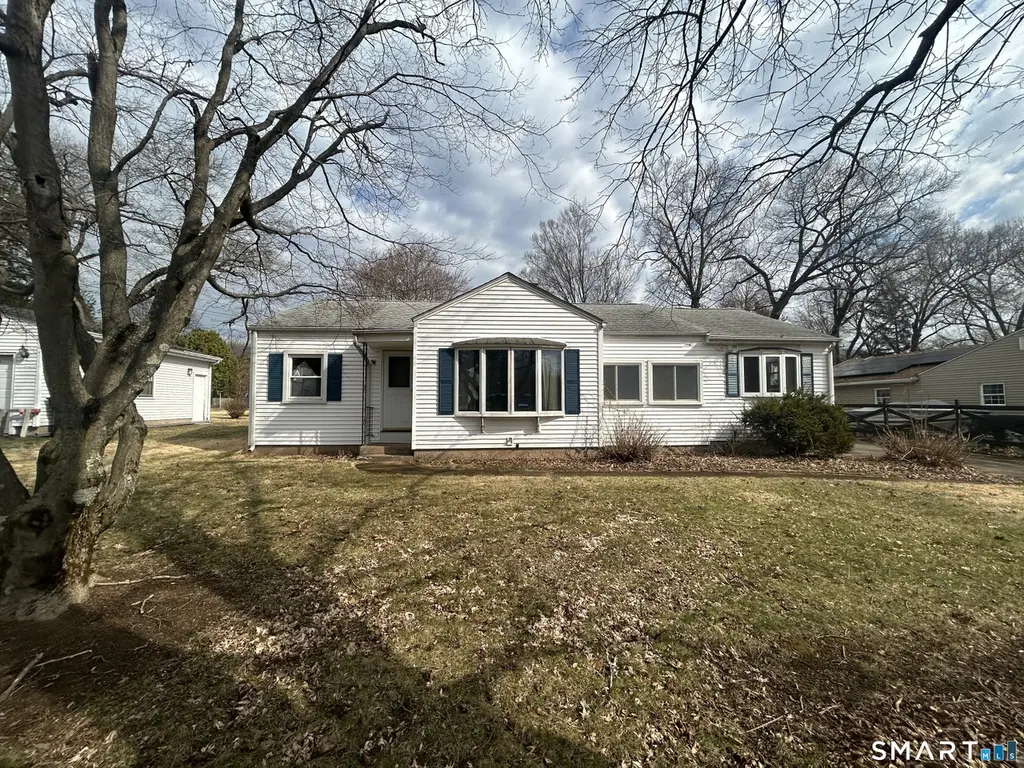
13 Jubrey Ln · Windsor Locks, CT
Flood risk 1/10 · Minimal
- FEMA flood zone
- X (unshaded)
- Chance of flooding over 30 yrs
- 0.0%
- Est. flood insurance / yr
- $473 – $860
Fire risk 1/10 · Minimal
- Est. fire insurance / yr
- $829 – $1,539
Heat risk 4/10 · Minor
- Hot days now (above 98°F)
- 7 days/yr
- Hot days in 30 yrs
- 16 days/yr
Wind risk 6/10 · Moderate
- Chance of severe wind over 30 yrs
- 27.0%
Air-quality risk 3/10 · Minor
- Unhealthy air days now
- 2 days/yr
- Unhealthy air days in 30 yrs
- 3 days/yr
Risk factors via First Street. Map © Google.
Why this score? — see what drove the D grade
The composite is a weighted blend of 9 inputs, each scored 0–100. Each bar is that input's sub-score; the figure is the points it added to the 100-point composite (weight × sub-score).
- ARV discount +15.0/15.0
- Cash flow +10.6/30.0
- Livability +3.7/5.0
- 1% rule +3.5/10.0
- Schools +3.5/10.0
- DSCR +3.1/10.0
- Rent growth +2.5/5.0
- Condition / age +2.5/5.0
- Appreciation +0.0/10.0
$265,000
🖨 Deal sheet (PDF) 📄 Offer letter ✓ Due diligence
Listing remarks MLS
Ready for it's next owner! A classic Ranch-style residence nestled in a quiet, established neighborhood of Windsor Locks. This home offers a spacious layout featuring 3 bedrooms and 2 full bathrooms, providing a solid foundation for those looking to create a personalized retreat. Situated on a generous 0.31-acre lot, the property includes a detached two-car garage and an enclosed back porch, ideal for enjoying the changing New England seasons. Its prime location offers the perfect balance of suburban peace and exceptional convenience, with proximity to local schools, parks, and major commuting routes. Whether you are a first-time homebuyer or looking for your next project, this property represents a fantastic opportunity to invest in a community known for its stability and small-town charm.
Key facts
- Enclosed back porch
- Generous lot
- Prime location
Tags
Neighborhood map
What this means for you Summary
Snapshot
- This is a 3-bed/2.5-bath single-family listed at $265k.
Deal economics
- At list price, monthly cash flow is $-130 ($-2k/yr) — negative.
- To cash-flow at today's rent, offer at most $242k (8.7% below list).
- To meet the 1% rule (rent ≥ 1% of price), the offer needs to be $226k (14.9% below list).
- Recommended offer: $226k (14.9% below list) — sets the bar for 1% rule.
- Cap rate 5.7% vs local median 3.9% in Windsor Locks — top-decile yield for the area; either an underpriced asset or a hidden risk that comps aren't pricing in. Stress-test before assuming the spread holds.
Location & tenants
- Location reads 74/100 on livability (#65 in CT, #4,599 nationally) — a middle-class / working-renter tenant base. Strengths: crime A+, housing A+, health & safety A+; Watch: amenities F, commute F.
- Windsor Locks School District (suburban): math 34% / reading 45% proficiency, ranked #102 of 153 in CT (top 67%) — families likely to look elsewhere, expect single-tenant / working-renter base with shorter leases.
- Zoned schools: North Street School (397 students, 42% FRL); Windsor Locks Middle School (math 35% / reading 46%, grade F, #104 of 175 statewide, top 60%, 318 students, 46% FRL); Windsor Locks High School (math 27% / reading 62%, grade F, #94 of 194 statewide, top 49%, 415 students, 39% FRL).
- Market conditions: 48 active listings in the ZIP; 16 comparable units currently listed for rent nearby; rentals leasing fast (median 4d on market — plan ~1-2 weeks tenant-placement turnaround); solid renter incomes; 1,867 units permitted in Capitol Planning Region in 2024 (1,399 in 5+ unit buildings).
- This rent runs 33% of the median local income ($81k/yr) — at the standard rent-burdened threshold; future hikes will face affordability resistance.
Forward outlook
- Local home prices are declining (-3.0%/yr); year-one equity from $2k of loan paydown is wiped out by about $8k of value loss. Plan a longer hold.
Negotiation context
- It's been on market 44 days — a 3% lower offer ($257k) is reasonable based on typical stale-listing flexibility.
- 2 sale attempts since 18y ago with the ask held roughly flat each time — persistent listings suggest the price (not the market) is what's stuck; bring a comps-based counter.
Risks & watch-outs
- Watch-outs: built in 1954 — expect roof / HVAC / electrical / plumbing capex.
- Climate carrying-cost: major wind risk, 27% chance of damaging wind over 30y — expect insurance premiums to compound above CPI over the hold.
Questions for the listing agent
- What do current leases actually rent for vs. the listed asking? Can we see a recent rent roll and the last 12 months of T-12 income?
- It's been on market 44 days. Have you received any prior offers? Is the seller open to a 15% concession, seller financing, or rate buy-down credit?
- Built in 1954 — when were the roof, HVAC, electrical panel, plumbing, and water heater last replaced?
- Is there a deadline driving the sale (1031 exchange, divorce, estate, relocation)? That informs how much negotiation room exists.
- The area grade is low — what's the realistic commute time and amenity access for the typical tenant pool here? Any planned neighborhood developments (good or bad) we should know about?
- What's the average days-on-market for RENTAL listings here right now (not sales)? A rising rental-DOM trend means longer vacancies and softer asking-rent achievability than the comps imply.
- What's the recent tenant-quality profile in this submarket — average credit score on applications, eviction rate, late-payment / NSF rate, and stable-employment percentage? A property-management company in the area should have these aggregated.
- How much new for-sale + rental construction is in the pipeline within 1–3 miles? Heavy new supply typically softens prices + rents 12–24 months out; constrained supply supports both.
Investment metrics
- 1% rule
- 0.85% ✗
- Cap rate
- 5.70%
- Cash-on-cash
- -2.11%
- DSCR
- 0.91
- GRM
- 9.8
CMA / ARV
- ARV (median comp)
- $350,351
- List price
- $265,000
- Delta
- -24.36%
- Verdict
- UNDERPRICED
- Comps
- 20 within 1.0 mi
Show comp detail 12 sales within ~0.75 mi
| Address | Dist | Beds/Ba | Sqft | Sold | Price | $/sf | Match |
|---|---|---|---|---|---|---|---|
| 13 Jubrey Ln | 0.00mi | 3/2.0 | 1,427 (0%) | 0mo | $280,000 | $196 | 98 |
| 7 Frances Ln | 0.50mi | 3/2.5 | 1,356 (-5%) | 6mo | $415,000 | $306 | 63 |
| 186 Grove St | 0.39mi | 3/1.5 | 1,540 (+8%) | 8mo | $310,500 | $202 | 58 |
| 267 Reed Ave | 0.31mi | 3/1.5 | 1,602 (+12%) | 5mo | $356,000 | $222 | 57 |
| 15 Dickerman Ave | 0.66mi | 3/1.0 | 1,479 (+4%) | 4mo | $210,000 | $142 | 54 |
| 255 Reed Ave | 0.33mi | 3/1.0 | 1,255 (-12%) | 6mo | $346,000 | $276 | 54 |
| 13 Whiton St | 0.68mi | 3/1.0 | 1,495 (+5%) | 2mo | $285,000 | $191 | 53 |
| 12 Arlington Rd | 0.55mi | 3/2.0 | 1,316 (-8%) | 8mo | $345,000 | $262 | 52 |
| 12 Chester Dr | 0.48mi | 3/2.0 | 1,217 (-15%) | 3mo | $350,000 | $288 | 48 |
| 10 Center St | 0.66mi | 3/1.0 | 1,248 (-12%) | 7mo | $165,000 | $132 | 36 |
| 127 Sunset St | 0.66mi | 4/1.5 (+1) | 1,277 (-10%) | 8mo | $351,000 | $275 | 36 |
| 35 Arlington Rd | 0.59mi | 2/1.0 (-1) | 1,250 (-12%) | 9mo | $275,000 | $220 | 33 |
Match score weights: distance 35% · size 25% · config 20% · recency 20%. Top-matched comps best support the ARV.
Projected returns pro-forma
-3.0% appreciation · 3.0% rent growth · sell at horizon
- IRR
- -19.7%
- Equity multiple
- 0.31×
- Total profit
- $-51,159
- Equity at exit
- $39,512
- IRR
- -12.5%
- Equity multiple
- 0.26×
- Total profit
- $-54,898
- Equity at exit
- $22,912
Cash invested: $74,200 (down + closing). Projections, not guarantees.
Landlord ↔ Tenant lean methodology
- Overall (STATE)
- 27 Tenant-Leaning
- State Connecticut
- 27 Tenant-Leaning · D+7
- County
- — inherits STATE
- City
- — inherits STATE
ZIP-level market 06096
- Home prices YoY
- -32.2%
- Active inventory
- 48
- Price-to-rent
- 9.8×
Monthly cashflow live
- Estimated rent
- $2,256 high interval (Pro) →
- Mortgage (P&I)
- −$1,390
- Tax from tax record
- −$412 /mo · $4,947/yr
- Insurance
- −$110
- HOA
- −$0
- Vacancy / Maint / Mgmt
- −$474
- Net cashflow
- $-130
Break-even live
Sensitivity live
| Price | -10% $20 | -5% $-55 | +0% $-130 | +5% $-205 | +10% $-280 |
|---|---|---|---|---|---|
| Rent | -10% $-309 | -5% $-219 | +0% $-130 | +5% $-41 | +10% $48 |
| Rate | -1.0pp $3 | -0.5pp $-63 | base $-130 | +0.5pp $-199 | +1.0pp $-269 |
UW: 25.0% down · 7.5% · 30yr · 1.5% tax · 5.0% vac · 8.0% maint · 8.0% mgmt
Financing live
Cash to close
- Down payment
- $66,250
- Closing costs
- $7,950
- Reserves months
- —
- Total cash needed
- —
Loan-product check · same deal, 3 products live
Conventional
25% down · 7.5% · 30yr
- Down + closing
- —
- Monthly P&I
- —
- Monthly cashflow
- —
- DSCR
- —
- Eligible?
- —
Personal DTI + credit; lowest rate.
DSCR
20% down · 8.5% · 30yr
- Down + closing
- —
- Monthly P&I
- —
- Monthly cashflow
- —
- DSCR
- —
- Eligible?
- —
No personal income docs; deal must DSCR.
Hard money
10% down · 12.0% · 12mo
- Down + closing
- —
- Monthly P&I
- —
- Monthly cashflow
- —
- DSCR
- —
- Eligible?
- —
Short-term bridge; refi at stabilization.
Rent comps 16 comps
| Address | Beds | Baths | Sqft | Rent | $/sqft | DOM | Units | Dist |
|---|---|---|---|---|---|---|---|---|
| 277 Elm St Windsor Locks, CT | 1.0–3.0 | 1.0–2.0 | 910 | $2,195 | $2.41 | 3d | 1 | 0.28mi |
| 140 Spring St Windsor Locks, CT | 3.0 | 1.0 | 1566 | $2,350 | $1.50 | 3d | 1 | 0.38mi |
| 456 Elm St Windsor Locks, CT | 2.0 | 1.0 | 985 | $2,300 | $2.34 | 25d | 1 | 0.73mi |
| 32 Dickerman Ave Windsor Locks, CT | 2.0 | 1.0 | 1128 | $2,000 | $1.77 | 3d | 1 | 0.77mi |
| 482 Ash Dr Windsor Locks, CT | 3.0 | 1.0 | 1249 | $2,200 | $1.76 | 13d | 1 | 0.86mi |
| 25 Harrison St Windsor Locks, CT | 2.0 | 2.0 | 1104 | $2,100 | $1.90 | 17d | 1 | 0.88mi |
| 60 Dickerman Ave Unit 60 Windsor Locks, CT | 2.0 | 1.5 | 1150 | $1,950 | $1.70 | 3d | 1 | 0.88mi |
| 31 Suffield St Windsor Locks, CT | 2.0 | 1.0 | 1074 | $2,100 | $1.96 | 3d | 1 | 0.91mi |
| 20 Pleasant St Unit 1 Windsor Locks, CT | 2.0 | 1.0 | 1000 | $2,000 | $2.00 | 45d | 1 | 0.95mi |
| 22 Pleasant St Unit 1 Windsor Locks, CT | 2.0 | 1.0 | 1000 | $1,950 | $1.95 | 45d | 1 | 0.95mi |
| 2 Pleasant St Unit 2 Windsor Locks, CT | 2.0 | 1.0 | 1393 | $2,250 | $1.62 | 16d | 1 | 0.99mi |
| 10 Poplar St Windsor Locks, CT | 2.0 | 1.0 | 1210 | $2,100 | $1.74 | 4d | 1 | 1.04mi |
| 10 Windwood Dr #10 Windsor Locks, CT | 2.0 | 1.5 | 1206 | $2,250 | $1.87 | 3d | 1 | 1.05mi |
| 22 Windwood Dr #22 Windsor Locks, CT | 2.0 | 1.5 | 1214 | $2,100 | $1.73 | 3d | 1 | 1.07mi |
| 8 Dibble Hollow Ln #8 Windsor Locks, CT | 2.0 | 2.5 | 1330 | $2,750 | $2.07 | 3d | 1 | 1.12mi |
| 86 Main St Unit A East Windsor, CT | 2.0 | 1.0 | 1100 | $1,450 | $1.32 | 3d | 1 | 1.44mi |
Listing history 5 events
-
2026-05-11status Under Contract 801-char remark
Show marketing remark (801 chars)
Ready for it's next owner! A classic Ranch-style residence nestled in a quiet, established neighborhood of Windsor Locks. This home offers a spacious layout featuring 3 bedrooms and 2 full bathrooms, providing a solid foundation for those looking to create a personalized retreat. Situated on a generous 0.31-acre lot, the property includes a detached two-car garage and an enclosed back porch, ideal for enjoying the changing New England seasons. Its prime location offers the perfect balance of suburban peace and exceptional convenience, with proximity to local schools, parks, and major commuting routes. Whether you are a first-time homebuyer or looking for your next project, this property represents a fantastic opportunity to invest in a community known for its stability and small-town charm.
-
2026-05-01price $265,000 801-char remark
Show marketing remark (801 chars)
Ready for it's next owner! A classic Ranch-style residence nestled in a quiet, established neighborhood of Windsor Locks. This home offers a spacious layout featuring 3 bedrooms and 2 full bathrooms, providing a solid foundation for those looking to create a personalized retreat. Situated on a generous 0.31-acre lot, the property includes a detached two-car garage and an enclosed back porch, ideal for enjoying the changing New England seasons. Its prime location offers the perfect balance of suburban peace and exceptional convenience, with proximity to local schools, parks, and major commuting routes. Whether you are a first-time homebuyer or looking for your next project, this property represents a fantastic opportunity to invest in a community known for its stability and small-town charm.
-
2026-03-26$275,000 Active 801-char remark
Show marketing remark (801 chars)
Ready for it's next owner! A classic Ranch-style residence nestled in a quiet, established neighborhood of Windsor Locks. This home offers a spacious layout featuring 3 bedrooms and 2 full bathrooms, providing a solid foundation for those looking to create a personalized retreat. Situated on a generous 0.31-acre lot, the property includes a detached two-car garage and an enclosed back porch, ideal for enjoying the changing New England seasons. Its prime location offers the perfect balance of suburban peace and exceptional convenience, with proximity to local schools, parks, and major commuting routes. Whether you are a first-time homebuyer or looking for your next project, this property represents a fantastic opportunity to invest in a community known for its stability and small-town charm.
-
2008-09-11historical
-
2008-06-30$212,000
ⓘ Source: listings_history table (triggers on properties + properties_extension) + one-shot
backfill from property_details.listing_events for pre-trigger history.
Tax reassessment forecast CT · Partial reset (capped growth)
- Current annual tax
- $4,947 · $412/mo
- Projected year-2 tax
- $5,309 · $442/mo
- Expected delta
- +$362/yr (+$30/mo · 7.3%)
ⓘ Screening estimate from a state-policy table — verify with the county assessor before closing.
Climate risk First Street
- Flood 1/10 Low FEMA zone X (unshaded) · 0% chance over 30 yrs
- Wildfire 1/10 Low
- Heat 4/10 Moderate 7 d/yr ≥98°F today · 16 d/yr by 30 yrs out
- Wind 6/10 Major 27% chance of damaging wind over 30 yrs
- Air quality 3/10 Moderate 2 unhealthy d/yr today · 3 by 30 yrs out
Nearby sold comps map
Loading sold comps map…
Walkable amenities ~0.75 mi
Loading nearby amenities…
Taxation est. · year 1
- Rental income
- $27,069
- − Mortgage interest
- −$14,844
- − Property taxes
- −$4,947
- − Insurance
- −$1,325
- − Repairs & maintenance
- −$2,165
- − Management
- −$2,165
- − Depreciation
- −$7,709
- Taxable loss
- −$6,088
- Est. tax savings @ 24.0%
- +$1,461
- After-tax cash flow
- $-103/yr
For passive investors: Depreciation is non-cash, so a rental often shows a tax loss while cash-flowing — sheltering income. Rental losses are passive: they offset passive income freely, and up to $25,000/yr can offset ordinary (W-2) income if you actively participate and your MAGI is under $100k (phasing out to $0 by $150k); unused losses carry forward. On sale, claimed depreciation is recaptured at up to 25%, and gains may owe capital-gains tax (a 1031 exchange can defer both). Figures are a year-1 estimate at your 24.0% rate — not tax advice; consult a CPA.
Schools (NCES district)
- District
- Windsor Locks School District
- NCES district ID
- 0905250
- Math proficiency
- 34% ▼ -5.00%
- Reading proficiency
- 45% ▼ -3.00%
- Median HH income
- $63,795
- Composite
- 35.36/100
- National rank
- #4954
- State rank
- #102 of 153 in CT
Livability — Windsor Locks
- Score
- 74/100
- State rank
- #65
- US rank
- #4599
Category grades
Schools grade is shown separately in the Schools card above.
Census & demographics
- Census place
- Windsor Locks, CT
- County
- Hartford County · 754,208 people
- City population
- 12,579
- Metro
- Hartford-East Hartford-Middletown, CT
- Population (ZIP)
- 12,579
- Household income
- $81,205
- Rent vs Own
- Severe rent burden
- 472.0
Population outlook (Capitol County) Hauer SSP2
- By 2040
- 1,063,519
Race, ethnicity, and origin ACS 2023
- Neighborhood character
- Predominantly White (72%)
- Race & ethnicity
- White 72% Hispanic / Latino 9% Two or more races 9% Black 7% Asian 6%
- Hispanic origin (detail)
- Puerto Rican 8%
- Common ancestry
- Romanian 9% Lithuanian 8% Russian 2%
- Foreign-born
- 11% · Canada, China, Vietnam
- Languages at home
- 87% English-only · Spanish 5% Other Indo-European 5% Vietnamese 1%
Political lean MEDSL · Capitol
- 2024 margin
- Strong D (+21.9) · D 60.1% · R 38.2% · Other 1.7%
- All cycles
- 2024: D+21.9
Not yet ingested
- Civics
- —
Market trends
- HPI YoY
- ▼ -93.85%
- Current HPI
- 197.1173
- Rent YoY
- —
- Metro
- Hartford-East Hartford-Middletown, CT
- State GDP YoY
- ▲ 1.06%
- F500 in state
- 38
Industry mix (Fortune 500 HQ in CT)
| Industry | F500 HQs | Revenue |
|---|---|---|
| Industrial Machinery | 4 | $38B |
|
||
| Insurance | 3 | $71B |
|
||
| Financial Services | 2 | $25B |
|
||
| Transportation / Logistics | 2 | $18B |
|
||
| Healthcare | 1 | $247B |
|
||
| Telecommunications | 1 | $55B |
|
||
Price history
+25.0% since first listed5 events — show timeline
- 2026-05-11 Pending — Smart MLS
- 2026-05-01 Price Changed $265,000 Smart MLS
- 2026-03-26 Listed $275,000 Smart MLS
- 2008-09-11 Listing Removed — Smart MLS
- 2008-06-30 Listed $212,000 Smart MLS
Property tax history
+3.5%/yrLatest (2025): $4,947 · +48.6% YoY. Source: county tax records.
Cash-flow waterfall
monthlySold comps — $/sqft
last 12 mo · ≤1 miLoading sold comps…