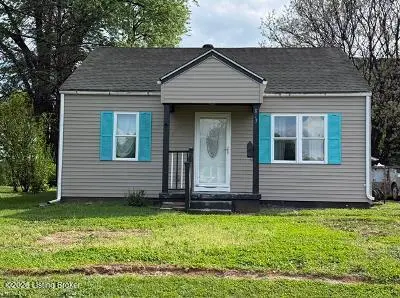
813 Bartley Ave · Bardstown, KY
Flood risk 1/10 · Minimal
- FEMA flood zone
- X (unshaded)
- Chance of flooding over 30 yrs
- 0.0%
- Est. flood insurance / yr
- $507 – $1,088
Fire risk 3/10 · Minor
- Est. fire insurance / yr
- $839 – $1,559
Heat risk 5/10 · Moderate
- Hot days now (above 105°F)
- 7 days/yr
- Hot days in 30 yrs
- 20 days/yr
Wind risk 2/10 · Minimal
- Chance of severe wind over 30 yrs
- 2.0%
Air-quality risk 2/10 · Minimal
- Unhealthy air days now
- 0 days/yr
- Unhealthy air days in 30 yrs
- 1 days/yr
Risk factors via First Street. Map © Google.
Why this score? — see what drove the C grade
The composite is a weighted blend of 9 inputs, each scored 0–100. Each bar is that input's sub-score; the figure is the points it added to the 100-point composite (weight × sub-score).
- Cash flow +21.2/30.0
- ARV discount +15.0/15.0
- DSCR +6.8/10.0
- 1% rule +4.2/10.0
- Livability +3.6/5.0
- Schools +3.3/10.0
- Rent growth +2.5/5.0
- Condition / age +2.5/5.0
- Appreciation +0.0/10.0
$164,900
🖨 Deal sheet 📄 Offer letter ✓ Due diligence
Listing remarks
Excellent opportunity awaits you with this three bedroom one bath vinyl sided Cape Cod home with detached two car garage located in historic Bardstown, Ky. Home offers 1371 sq. ft of comfortable living space with tile, carpet & laminate flooring. Carpeted Living Room, Eat in Kitchen with stainless appliances & granite countertops. Two bedrooms on the main level with tiled Bath & walk in shower. Venture upstairs for the third bedroom. Outdoor features include a chain link fenced yard & rear deck for all you enjoyment. Conveniently located in town near all the amenities of historic Bardstown. Don't Delay! Let's go take a look today!!
Key facts
- Cape cod home
- Stainless appliances
- Tiled bath
Tags
Neighborhood map
What this means for you Summary
Snapshot
- This is a 3-bed/1.0-bath single-family listed at $165k.
Deal economics
- At list price, monthly cash flow is $238 ($3k/yr) — positive.
- The deal already cash-flows at list — no discount required.
- To meet the 1% rule (rent ≥ 1% of price), the offer needs to be $152k (7.6% below list).
- Recommended offer: $152k (7.6% below list) — sets the bar for 1% rule.
- Cap rate 8.0% vs local median 3.1% in Bardstown — top-decile yield for the area; either an underpriced asset or a hidden risk that comps aren't pricing in. Stress-test before assuming the spread holds.
Location & tenants
- Location reads 71/100 on livability (#145 in KY) — a middle-class / working-renter tenant base. Strengths: cost of living A+, housing A+, health & safety A+; Watch: employment C-, schools D, amenities F.
- Bardstown Independent (town): math 32% / reading 46% proficiency, ranked #41 of 165 in KY (top 25%) — families likely to look elsewhere, expect single-tenant / working-renter base with shorter leases.
- Market conditions: 242 active listings in the ZIP; 2 comparable units currently listed for rent nearby; 210 units permitted in Nelson County in 2024 (15 in 5+ unit buildings).
Forward outlook
- Local home prices are declining (-3.0%/yr); year-one equity from $1k of loan paydown is wiped out by about $5k of value loss. Plan a longer hold.
- Nelson County population projected at +8% by 2050 — modest demand growth; plan on rents tracking national, not racing it.
Negotiation context
- Only 3 days on market — expect competitive offers; lowballing is unlikely to land.
- 4 sale attempts since 13y ago; this cycle's ask has dropped $100k (38%) from the opening price — seller is motivated, your offer sets the floor, not the list.
- Current owner paid $118k; 40% above their basis — modest negotiation headroom, anchor on the comps not their cost.
Risks & watch-outs
- Climate carrying-cost: extreme-heat days projected 7→20/yr by 2055 (HVAC capex compounding) — expect insurance premiums to compound above CPI over the hold.
Questions for the listing agent
- Built in 1960 — when were the roof, HVAC, electrical panel, plumbing, and water heater last replaced?
- Is there a deadline driving the sale (1031 exchange, divorce, estate, relocation)? That informs how much negotiation room exists.
- Schools are D-rated, which usually means shorter tenancies and higher turnover. Who's the typical renter profile here, and what's been the actual vacancy rate?
- What's the average days-on-market for RENTAL listings here right now (not sales)? A rising rental-DOM trend means longer vacancies and softer asking-rent achievability than the comps imply.
- What's the recent tenant-quality profile in this submarket — average credit score on applications, eviction rate, late-payment / NSF rate, and stable-employment percentage? A property-management company in the area should have these aggregated.
- How much new for-sale + rental construction is in the pipeline within 1–3 miles? Heavy new supply typically softens prices + rents 12–24 months out; constrained supply supports both.
Investment metrics
- 1% rule
- 0.92% ✗
- Cap rate
- 8.02%
- Cash-on-cash
- 6.18%
- DSCR
- 1.28
- GRM
- 9.0
CMA / ARV
- ARV (on-the-fly)
- $274,200
- Comps found
- 8
Show comp detail 8 sales within ~0.75 mi
| Address | Dist | Beds/Ba | Sqft | Sold | Price | $/sf | Match |
|---|---|---|---|---|---|---|---|
| 109 N Kennett Ave | 0.39mi | 3/2.0 | 1,272 (-7%) | 8mo | $270,000 | $212 | 59 |
| 122 Rosewood Dr | 0.48mi | 3/2.0 | 1,401 (+2%) | 15mo | $280,000 | $200 | 58 |
| 307 S Center St | 0.10mi | 3/2.0 | 1,537 (+12%) | 16mo | $274,900 | $179 | 58 |
| 103 Norris Ct | 0.31mi | 3/2.0 | 1,310 (-4%) | 21mo | $260,000 | $198 | 57 |
| 610 W Stephen Foster Ave | 0.32mi | 3/2.0 | 1,179 (-14%) | 10mo | $182,000 | $154 | 50 |
| 111 Payne Ave | 0.70mi | 3/2.0 | 1,272 (-7%) | 14mo | $289,900 | $228 | 40 |
| 224 Rosewood Dr | 0.67mi | 3/2.0 | 1,444 (+5%) | 24mo | $254,900 | $177 | 36 |
| 215 N 5th St | 0.73mi | 3/2.0 | 1,244 (-9%) | 15mo | $265,000 | $213 | 34 |
Match score weights: distance 35% · size 25% · config 20% · recency 20%. Top-matched comps best support the ARV.
Projected returns pro-forma
-3.0% appreciation · 3.0% rent growth · sell at horizon
- IRR
- -6.8%
- Equity multiple
- 0.75×
- Total profit
- $-11,649
- Equity at exit
- $24,587
- IRR
- 2.7%
- Equity multiple
- 1.20×
- Total profit
- $9,031
- Equity at exit
- $14,258
Cash invested: $46,172 (down + closing). Projections, not guarantees.
Landlord ↔ Tenant lean methodology
- Overall (STATE)
- 83 Strongly Landlord-Friendly
- State Kentucky
- 83 Strongly Landlord-Friendly · R+16
- County
- — inherits STATE
- City
- — inherits STATE
ZIP-level market 40004
- Home prices YoY
- -16.0%
- Active inventory
- 242
- Price-to-rent
- 9.0×
Monthly cashflow live
- Estimated rent
- $1,524 medium interval (Pro) →
- Mortgage (P&I)
- −$865
- Tax from tax record
- −$32 /mo · $386/yr
- Insurance
- −$69
- HOA
- −$0
- Vacancy / Maint / Mgmt
- −$320
- Net cashflow
- $238
Break-even live
UW: 25.0% down · 7.5% · 30yr · 1.5% tax · 5.0% vac · 8.0% maint · 8.0% mgmt
Financing live
Cash to close
- Down payment
- $41,225
- Closing costs
- $4,947
- Reserves months
- —
- Total cash needed
- —
Loan-product check · same deal, 3 products live
Conventional
25% down · 7.5% · 30yr
- Down + closing
- —
- Monthly P&I
- —
- Monthly cashflow
- —
- DSCR
- —
- Eligible?
- —
Personal DTI + credit; lowest rate.
DSCR
20% down · 8.5% · 30yr
- Down + closing
- —
- Monthly P&I
- —
- Monthly cashflow
- —
- DSCR
- —
- Eligible?
- —
No personal income docs; deal must DSCR.
Hard money
10% down · 12.0% · 12mo
- Down + closing
- —
- Monthly P&I
- —
- Monthly cashflow
- —
- DSCR
- —
- Eligible?
- —
Short-term bridge; refi at stabilization.
Rent comps 2 comps
| Address | Beds | Baths | Sqft | Rent | $/sqft | DOM | Units | Dist |
|---|---|---|---|---|---|---|---|---|
| 8 E Maidens Aly Bardstown, KY | 3.0 | 2.0 | 1450 | $1,600 | $1.10 | 44d | 1 | 0.89mi |
| 514 N 2nd St Unit 1 Bardstown, KY | 2.0 | 1.5 | 1080 | $1,795 | $1.66 | 43d | 1 | 1.10mi |
Listing history 11 events
-
2026-04-18status Pending
-
2026-04-16price $164,900
-
2026-04-15$264,900 Active
-
2019-09-16soldstatus $117,500
-
2019-06-05historical
-
2018-11-09$125,000
-
2013-12-27soldstatus $25,000
-
2013-12-27soldstatus $25,000
-
2013-09-30$27,900
-
2013-09-30$27,900
-
2003-10-01soldstatus $55,000
ⓘ Source: listings_history table (triggers on properties + properties_extension) + one-shot
backfill from property_details.listing_events for pre-trigger history.
Tax reassessment forecast KY · Resets to sale price
- Current annual tax
- $386 · $32/mo
- Projected year-2 tax
- $1,418 · $118/mo
- Expected delta
- +$1,032/yr (+$86/mo · 267.0%)
ⓘ Screening estimate from a state-policy table — verify with the county assessor before closing.
Climate risk First Street
- Flood 1/10 Low FEMA zone X (unshaded) · 0% chance over 30 yrs
- Wildfire 3/10 Moderate
- Heat 5/10 Major 7 d/yr ≥105°F today · 20 d/yr by 30 yrs out
- Wind 2/10 Low 2% chance of damaging wind over 30 yrs
- Air quality 2/10 Low 0 unhealthy d/yr today · 1 by 30 yrs out
Nearby sold comps map
Loading sold comps map…
Walkable amenities ~0.75 mi
Loading nearby amenities…
Taxation est. · year 1
- Rental income
- $18,283
- − Mortgage interest
- −$9,237
- − Property taxes
- −$386
- − Insurance
- −$824
- − Repairs & maintenance
- −$1,463
- − Management
- −$1,463
- − Depreciation
- −$4,797
- Taxable income
- $113
- Est. tax owed @ 24.0%
- −$27
- After-tax cash flow
- $2,828/yr
For passive investors: Depreciation is non-cash, so a rental often shows a tax loss while cash-flowing — sheltering income. Rental losses are passive: they offset passive income freely, and up to $25,000/yr can offset ordinary (W-2) income if you actively participate and your MAGI is under $100k (phasing out to $0 by $150k); unused losses carry forward. On sale, claimed depreciation is recaptured at up to 25%, and gains may owe capital-gains tax (a 1031 exchange can defer both). Figures are a year-1 estimate at your 24.0% rate — not tax advice; consult a CPA.
Schools (NCES district)
- District
- Bardstown Independent
- NCES district ID
- 2100270
- Math proficiency
- 32% ▼ -8.00%
- Reading proficiency
- 46% ▼ -10.00%
- Median HH income
- $38,799
- Composite
- 32.54/100
- National rank
- #5694
- State rank
- #41 of 165 in KY
Livability — Bardstown
- Score
- 71/100
- State rank
- #145
- US rank
- #6811
Category grades
Schools grade is shown separately in the Schools card above.
Census & demographics
- Census place
- Bardstown, KY
- County
- Nelson County · 30,601 people
- City population
- 30,601
- Metro
- Bardstown, KY
- Population (ZIP)
- 30,601
- Household income
- $66,578
- Rent vs Own
- Severe rent burden
- 795.0
Population outlook (Nelson County) Hauer SSP2
- Today (2025)
- 48,436 people
- By 2030
- 49,780 · +2.8%
- By 2040
- 51,737 · +6.8%
- By 2050
- 52,395 · +8.2%
- By 2075
- 52,271 · +7.9%
- By 2100
- 47,277 · -2.4%
Race, ethnicity, and origin ACS 2023
- Neighborhood character
- Predominantly White (87%)
- Race & ethnicity
- White 87% Black 7% Two or more races 3% Hispanic / Latino 3%
- Common ancestry
- Slovak 2% Italian 1% Lithuanian 1%
- Foreign-born
- 3% · Canada, United Kingdom
- Languages at home
- 96% English-only · Spanish 2% Russian/Polish/Slavic 0%
Political lean MEDSL · Nelson
- 2024 margin
- Solid R (+41.8) · D 28.5% · R 70.3% · Other 1.2%
- 2008→2024 swing
- -28.1pp toward R · 2008: -13.7pp · 2024: -41.8pp
- All cycles
- 2024: R+41.8 2020: R+36.6 2016: R+33.7 2012: R+16.5 2008: R+13.7
Not yet ingested
- Civics
- —
Market trends
- HPI YoY
- ▼ -52.14%
- Current HPI
- 272.9009
- Rent YoY
- —
- Metro
- Bardstown, KY
- State GDP YoY
- ▲ 1.81%
- F500 in state
- 4
Industry mix (Fortune 500 HQ in KY)
| Industry | F500 HQs | Revenue |
|---|---|---|
| Healthcare | 1 | $118B |
|
||
| Food / Beverage | 1 | $7B |
|
||
Price history
+199.8% since first listed11 events — show timeline
- 2026-04-18 Pending — Metro Search MLS
- 2026-04-16 Price Changed $164,900 Metro Search MLS
- 2026-04-15 Listed $264,900 Metro Search MLS
- 2019-09-16 Sold (Public Records) $117,500 Public Records
- 2019-06-05 Listing Removed — Metro Search MLS
- 2018-11-09 Listed $125,000 Metro Search MLS
- 2013-12-27 Sold (MLS) $25,000 HKARMLS
- 2013-12-27 Sold (MLS) $25,000 Metro Search MLS
- 2013-09-30 Listed $27,900 HKARMLS
- 2013-09-30 Listed $27,900 Metro Search MLS
- 2003-10-01 Sold (Public Records) $55,000 Public Records
Property tax history
+2.8%/yrLatest (2025): $386 · -3.4% YoY. Source: county tax records.
Cash-flow waterfall
monthlySold comps — $/sqft
last 12 mo · ≤1 miLoading sold comps…