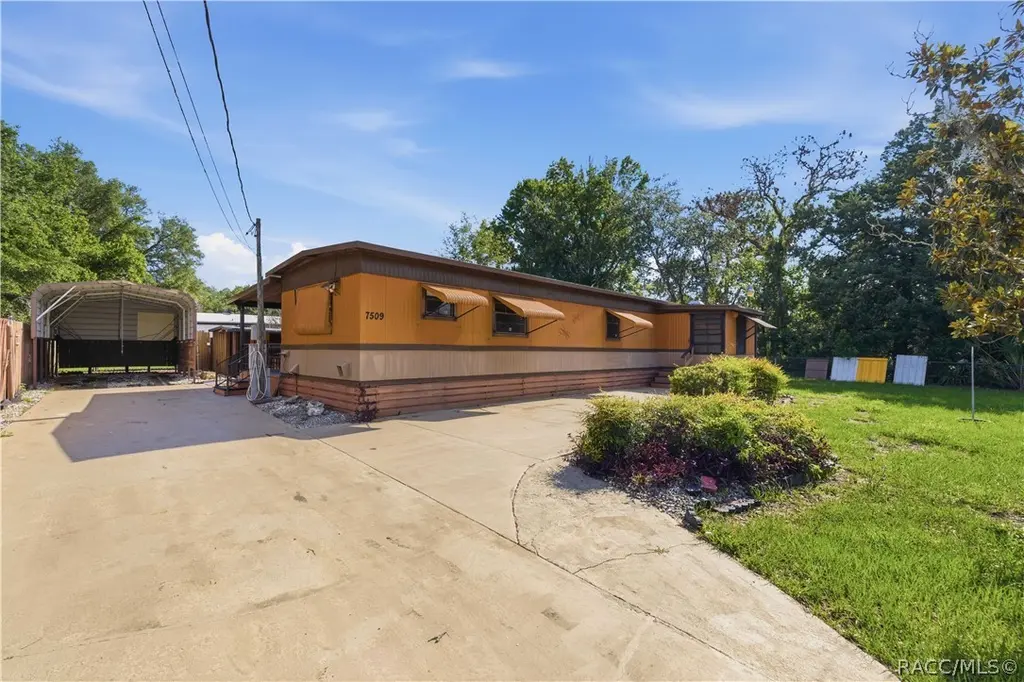
7509 W Merry Ln · Homosassa Springs, FL
Flood risk 8/10 · Major
- FEMA flood zone
- X (unshaded)
- Chance of flooding over 30 yrs
- 0.99%
- Est. flood insurance / yr
- $507 – $1,088
Fire risk 6/10 · Moderate
- Est. fire insurance / yr
- $947 – $1,759
Heat risk 10/10 · Severe
- Hot days now (above 109°F)
- 7 days/yr
- Hot days in 30 yrs
- 26 days/yr
Wind risk 9/10 · Severe
- Chance of severe wind over 30 yrs
- 99.0%
Air-quality risk 1/10 · Minimal
- Unhealthy air days now
- 0 days/yr
- Unhealthy air days in 30 yrs
- 0 days/yr
Risk factors via First Street. Map © Google.
Why this score? — see what drove the B- grade
The composite is a weighted blend of 9 inputs, each scored 0–100. Each bar is that input's sub-score; the figure is the points it added to the 100-point composite (weight × sub-score).
- Cash flow +29.7/30.0
- DSCR +10.0/10.0
- 1% rule +8.4/10.0
- ARV discount +4.9/15.0
- Schools +4.1/10.0
- Livability +3.6/5.0
- Rent growth +2.5/5.0
- Condition / age +2.5/5.0
- Appreciation +0.0/10.0
$125,000
🖨 Deal sheet (PDF) 📄 Offer letter ✓ Due diligence
Listing remarks
Opportunity awaits with this fully fenced Homosassa property offering plenty of potential for the right buyer. Recent updates include NEW FLOORING throughout much of the home. The property features covered RV PARKING, an AMPLE storage building, and a spacious yard with room for hobbies, equipment, or recreational vehicles. Home is being sold as-is and would benefit from additional repairs and updates, making it an excellent option for INVESTORS, HANDYMEN, or buyers looking to ADD THEIR OWN finishing touches. Conveniently located near shopping, dining, and the outdoor recreation that Homosassa is known for. Owner Financing is offered for the qualified buyer. Bring your vision and make this p
Key facts
- Spacious yard
- Fully fenced
- Covered rv parking
Tags
Property features AI
Exterior
- Parking: Detached carport; Driveway with paved parking; RV access/parking; 1 parking space (listed total)
- Utilities: Private well water; Septic tank sewer
- Home design: Manufactured residential home; Single wide
- Construction: Asphalt shingle roof; Additional structures include barn(s) and shed(s)
- Exterior features: Level lot; Paved road access; Concrete surfaces; Deck; Barbecue; Fenced
Interior
- Kitchen: Electric cooktop and electric oven/range; Microwave; Freezer
- Bedrooms: Manufactured home (single wide) — bedroom count not specified
- Flooring: Laminate
- Bathrooms: 2 full bathrooms
- Heating & cooling: Heat pump heating; Central air and wall/window cooling units
- Interior features: Barbecue; Deck; Fenced yard; Barns and shed(s) on the property
- Laundry & utility: Washer; Dryer
Neighborhood map
What this means for you Summary
Snapshot
- This is a 2-bed/2.0-bath manufactured listed at $125k.
Deal economics
- At list price, monthly cash flow is $389 ($5k/yr) — positive.
- The deal already cash-flows at list — no discount required.
- Meets the 1% rule at list price ($2k rent vs $125k).
- Recommended offer: $123k (1.5% below list) — sets the bar for market timing.
- Cap rate 10.7% vs local median 5.9% in Homosassa Springs — top-decile yield for the area; either an underpriced asset or a hidden risk that comps aren't pricing in. Stress-test before assuming the spread holds.
Location & tenants
- Location reads 71/100 on livability (#391 in FL) — a middle-class / working-renter tenant base. Strengths: cost of living A+, housing A+, health & safety A+; Watch: crime C-, amenities F, commute F.
- Citrus (rural): math 49% / reading 50% proficiency, ranked #44 of 73 in FL (top 60%) — families likely to look elsewhere, expect single-tenant / working-renter base with shorter leases.
- Zoned schools: Homosassa Elementary School (math 62% / reading 47%, grade C, #892 of 2,144 statewide, top 44%, 411 students, 78% FRL); Crystal River Middle School (math 49% / reading 47%, grade C-, #286 of 571 statewide, top 50%, 900 students, 64% FRL); Crystal River High School (math 31% / reading 44%, grade F, #336 of 667 statewide, top 51%, 1,249 students, 56% FRL).
- Market conditions: 586 active listings in the ZIP; 2 comparable units currently listed for rent nearby; 2,443 units permitted in Citrus County in 2024 (0 in 5+ unit buildings).
- This rent runs 34% of the median local income ($59k/yr) — at the standard rent-burdened threshold; future hikes will face affordability resistance.
Forward outlook
- Local home prices are declining (-3.0%/yr); year-one equity from $864 of loan paydown is wiped out by about $4k of value loss. Plan a longer hold.
- Citrus County population projected to shrink 10% by 2050 — rents likely to lag national; underwrite the cash flow, not the appreciation.
- At projected returns (-3.0% appreciation + 3.0% rent growth), your $35k cash investment doubles in ~9 years — after that, you're playing with house money.
Negotiation context
- It's been on market 18 days — a 2% lower offer ($123k) is reasonable based on typical stale-listing flexibility.
- Current owner paid $23k; list at $125k implies a 443% gain — meaningful room to come down on a strong offer.
Risks & watch-outs
- Watch-outs: flood insurance adds $66/mo.
- Climate carrying-cost: severe flood risk; severe wind risk, 99% chance of damaging wind over 30y; major wildfire risk; extreme-heat days projected 7→26/yr by 2055 (HVAC capex compounding) — expect insurance premiums to compound above CPI over the hold.
Questions for the listing agent
- What's the actual annual flood-insurance premium (NFIP or private), and is the property in a SFHA with mandatory coverage?
- Is there a deadline driving the sale (1031 exchange, divorce, estate, relocation)? That informs how much negotiation room exists.
- Schools are F-rated, which usually means shorter tenancies and higher turnover. Who's the typical renter profile here, and what's been the actual vacancy rate?
- What's the average days-on-market for RENTAL listings here right now (not sales)? A rising rental-DOM trend means longer vacancies and softer asking-rent achievability than the comps imply.
- What's the recent tenant-quality profile in this submarket — average credit score on applications, eviction rate, late-payment / NSF rate, and stable-employment percentage? A property-management company in the area should have these aggregated.
- How much new for-sale + rental construction is in the pipeline within 1–3 miles? Heavy new supply typically softens prices + rents 12–24 months out; constrained supply supports both.
Investment metrics
- 1% rule
- 1.34% ✓
- Cap rate
- 10.67%
- Cash-on-cash
- 15.63%
- DSCR
- 1.70
- GRM
- 6.2
CMA / ARV
- ARV (on-the-fly)
- $118,272
- Comps found
- 7
Show comp detail 7 sales within ~0.75 mi
| Address | Dist | Beds/Ba | Sqft | Sold | Price | $/sf | Match |
|---|---|---|---|---|---|---|---|
| 7742 W Green Acres St | 0.27mi | 2/2.0 | 924 (0%) | 13mo | $176,000 | $190 | 76 |
| 7278 W Hadenotter Ln | 0.24mi | 2/2.0 | 960 (+4%) | 8mo | $46,400 | $48 | 75 |
| 5222 S Manatee Ter | 0.13mi | 2/2.0 | 943 (+2%) | 22mo | $137,000 | $145 | 72 |
| 7299 W Brady Ln | 0.28mi | 2/1.0 | 864 (-6%) | 14mo | $92,500 | $107 | 60 |
| 5285 S Knobhill Ter | 0.17mi | 3/1.0 (+1) | 1,050 (+14%) | 20mo | $100,000 | $95 | 43 |
| 5602 S Woodside Ter | 0.66mi | 2/2.0 | 1,056 (+14%) | 8mo | $135,000 | $128 | 38 |
| 6853 W Sasser St | 0.68mi | 2/2.0 | 840 (-9%) | 19mo | $150,000 | $179 | 37 |
Match score weights: distance 35% · size 25% · config 20% · recency 20%. Top-matched comps best support the ARV.
Projected returns pro-forma
-3.0% appreciation · 3.0% rent growth · sell at horizon
- IRR
- 3.4%
- Equity multiple
- 1.13×
- Total profit
- $4,615
- Equity at exit
- $18,638
- IRR
- 13.0%
- Equity multiple
- 2.04×
- Total profit
- $36,226
- Equity at exit
- $10,808
Cash invested: $35,000 (down + closing). Projections, not guarantees.
Landlord ↔ Tenant lean methodology
- Overall (STATE)
- 87 Strongly Landlord-Friendly
- State Florida
- 87 Strongly Landlord-Friendly · R+3
- County
- — inherits STATE
- City
- — inherits STATE
ZIP-level market 34446
- Home prices YoY
- -10.4%
- Active inventory
- 586
- Price-to-rent
- 6.2×
Monthly cashflow live
- Estimated rent
- $1,671 medium interval (Pro) →
- Mortgage (P&I)
- −$656
- Tax est. 1.5%
- −$156 /mo · $1,875/yr
- Insurance
- −$52
- Flood insurance flood zone
- −$66 /mo · $798/yr
- HOA
- −$0
- Vacancy / Maint / Mgmt
- −$351
- Net cashflow
- $389
Break-even live
Sensitivity live
| Price | -10% $476 | -5% $433 | +0% $389 | +5% $346 | +10% $303 |
|---|---|---|---|---|---|
| Rent | -10% $257 | -5% $323 | +0% $389 | +5% $455 | +10% $521 |
| Rate | -1.0pp $452 | -0.5pp $421 | base $389 | +0.5pp $357 | +1.0pp $324 |
UW: 25.0% down · 7.5% · 30yr · 1.5% tax · 5.0% vac · 8.0% maint · 8.0% mgmt
Financing live
Cash to close
- Down payment
- $31,250
- Closing costs
- $3,750
- Reserves months
- —
- Total cash needed
- —
Loan-product check · same deal, 3 products live
Conventional
25% down · 7.5% · 30yr
- Down + closing
- —
- Monthly P&I
- —
- Monthly cashflow
- —
- DSCR
- —
- Eligible?
- —
Personal DTI + credit; lowest rate.
DSCR
20% down · 8.5% · 30yr
- Down + closing
- —
- Monthly P&I
- —
- Monthly cashflow
- —
- DSCR
- —
- Eligible?
- —
No personal income docs; deal must DSCR.
Hard money
10% down · 12.0% · 12mo
- Down + closing
- —
- Monthly P&I
- —
- Monthly cashflow
- —
- DSCR
- —
- Eligible?
- —
Short-term bridge; refi at stabilization.
Rent comps 2 comps
| Address | Beds | Baths | Sqft | Rent | $/sqft | DOM | Units | Dist |
|---|---|---|---|---|---|---|---|---|
| 5323 S Knobhill Ter Homosassa, FL | 3.0 | 2.0 | 925 | $1,400 | $1.51 | 22d | 1 | 0.24mi |
| 5900 S Oakridge Dr Homosassa, FL | 2.0 | 2.0 | 1050 | $1,575 | $1.50 | 22d | 1 | 0.97mi |
Listing history 13 events
-
2026-06-21days on market $125,000 Active 18 DOM
-
2026-06-19days on market $125,000 Active 16 DOM
-
2026-06-18days on market $125,000 Active 15 DOM
-
2026-06-17days on market $125,000 Active 14 DOM
-
2026-06-16days on market $125,000 Active 13 DOM
-
2026-06-15days on market $125,000 Active 12 DOM
-
2026-06-14days on market $125,000 Active 10 DOM
-
2026-06-13days on market $125,000 Active 9 DOM
-
2026-06-10days on market $125,000 Active 7 DOM
-
2026-06-09days on market $125,000 Active 6 DOM
-
2026-06-08days on market $125,000 Active 5 DOM
-
2026-06-07remarks 699-char remark
-
2026-06-07$125,000 Active 4 DOM
ⓘ Source: listings_history table (triggers on properties + properties_extension) + one-shot
backfill from property_details.listing_events for pre-trigger history.
Climate risk First Street
- Flood 8/10 Severe FEMA zone X (unshaded) · 99% chance over 30 yrs
- Wildfire 6/10 Major
- Heat 10/10 Extreme 7 d/yr ≥109°F today · 26 d/yr by 30 yrs out
- Wind 9/10 Extreme 99% chance of damaging wind over 30 yrs
- Air quality 1/10 Low 0 unhealthy d/yr today · 0 by 30 yrs out
Nearby sold comps map
Loading sold comps map…
Walkable amenities ~0.75 mi
Loading nearby amenities…
Taxation est. · year 1
- Rental income
- $20,047
- − Mortgage interest
- −$7,002
- − Property taxes
- −$1,875
- − Insurance
- −$1,422
- − Repairs & maintenance
- −$1,604
- − Management
- −$1,604
- − Depreciation
- −$3,636
- Taxable income
- $2,904
- Est. tax owed @ 24.0%
- −$697
- After-tax cash flow
- $3,976/yr
For passive investors: Depreciation is non-cash, so a rental often shows a tax loss while cash-flowing — sheltering income. Rental losses are passive: they offset passive income freely, and up to $25,000/yr can offset ordinary (W-2) income if you actively participate and your MAGI is under $100k (phasing out to $0 by $150k); unused losses carry forward. On sale, claimed depreciation is recaptured at up to 25%, and gains may owe capital-gains tax (a 1031 exchange can defer both). Figures are a year-1 estimate at your 24.0% rate — not tax advice; consult a CPA.
Schools (NCES district)
- District
- Citrus
- NCES district ID
- 1200270
- Math proficiency
- 49% ▼ -10.00%
- Reading proficiency
- 50% ▼ -6.00%
- Median HH income
- $38,618
- Composite
- 41.28/100
- National rank
- #3519
- State rank
- #44 of 73 in FL
Livability — Homosassa Springs
- Score
- 71/100
- State rank
- #391
- US rank
- #6877
Category grades
Schools grade is shown separately in the Schools card above.
Census & demographics
- Census place
- Homosassa Springs, FL
- County
- Citrus County · 111,314 people
- Metro
- Homosassa Springs, FL
- Population (ZIP)
- 19,102
- Household income
- $58,802
- Rent vs Own
- Severe rent burden
- 121.0
Population outlook (Citrus County) Hauer SSP2
- Today (2025)
- 138,622 people
- By 2030
- 136,886 · -1.3%
- By 2040
- 132,009 · -4.8%
- By 2050
- 125,196 · -9.7%
- By 2075
- 108,570 · -21.7%
- By 2100
- 84,454 · -39.1%
Race, ethnicity, and origin ACS 2023
- Neighborhood character
- Predominantly White (87%)
- Race & ethnicity
- White 87% Two or more races 8% Hispanic / Latino 6%
- Hispanic origin (detail)
- Mexican 2% Puerto Rican 3%
- Common ancestry
- Romanian 4% Lithuanian 4% Slovak 3%
- Foreign-born
- 5% · Canada
- Languages at home
- 95% English-only · Spanish 4%
Political lean MEDSL · Citrus
- 2024 margin
- Solid R (+45.9) · D 26.8% · R 72.6%
- 2008→2024 swing
- -29.8pp toward R · 2008: -16.1pp · 2024: -45.9pp
- All cycles
- 2024: R+45.9 2020: R+41.0 2016: R+39.7 2012: R+21.9 2008: R+16.1
Not yet ingested
- Civics
- —
Market trends
- HPI YoY
- ▼ -32.11%
- Current HPI
- 277.2576
- Rent YoY
- —
- Metro
- Homosassa Springs, FL
- State GDP YoY
- ▲ 3.28%
- F500 in state
- 36
Industry mix (Fortune 500 HQ in FL)
| Industry | F500 HQs | Revenue |
|---|---|---|
| Industrial Technology | 2 | $29B |
|
||
| Insurance | 2 | $17B |
|
||
| Retail | 1 | $60B |
|
||
| Technology Distribution | 1 | $58B |
|
||
| Homebuilding | 1 | $35B |
|
||
| Technology Manufacturing | 1 | $35B |
|
||
Price history
+1566.7% since first listed4 events — show timeline
- 2026-06-03 Listed $125,000 RACC
- 1986-06-01 Sold (Public Records) $23,000 Public Records
- 1983-05-01 Sold (Public Records) $22,000 Public Records
- 1983-05-01 Sold (Public Records) $7,500 Public Records
Property tax history
+10.8%/yrLatest (2025): $229 · +33.7% YoY. Source: county tax records.
Cash-flow waterfall
monthlySold comps — $/sqft
last 12 mo · ≤1 miLoading sold comps…