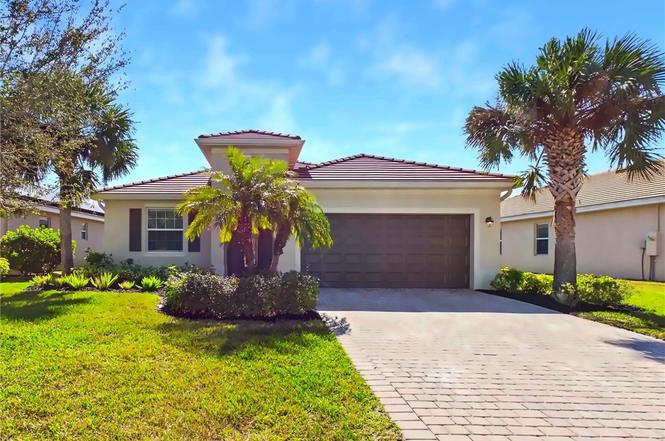
3514 E Hampton Cir · Lehigh Acres, FL
Flood risk 1/10 · Minimal
- FEMA flood zone
- X (unshaded)
- Chance of flooding over 30 yrs
- 0.0%
- Est. flood insurance / yr
- $507 – $1,088
Fire risk 3/10 · Minor
- Est. fire insurance / yr
- $947 – $1,759
Heat risk 10/10 · Severe
- Hot days now (above 107°F)
- 8 days/yr
- Hot days in 30 yrs
- 33 days/yr
Wind risk 10/10 · Severe
- Chance of severe wind over 30 yrs
- 99.0%
Air-quality risk 2/10 · Minimal
- Unhealthy air days now
- 1 days/yr
- Unhealthy air days in 30 yrs
- 1 days/yr
Risk factors via First Street. Map © Google.
Why this score? — see what drove the D- grade
The composite is a weighted blend of 9 inputs, each scored 0–100. Each bar is that input's sub-score; the figure is the points it added to the 100-point composite (weight × sub-score).
- Cash flow +12.9/30.0
- ARV discount +5.4/15.0
- Schools +4.1/10.0
- 1% rule +4.0/10.0
- DSCR +3.8/10.0
- Livability +3.0/5.0
- Rent growth +2.5/5.0
- Condition / age +2.5/5.0
- Appreciation +0.0/10.0
$319,900
🖨 Deal sheet (PDF) 📄 Offer letter ✓ Due diligence
Listing remarks
Assumable loan with 3.25% interest rate! Tucked along a peaceful street in the highly desirable Hampton Lakes at River Hall, this beautifully maintained, waterfront home offers the kind of quiet living that makes everyday life feel like a retreat. Freshly painted on the exterior and thoughtfully designed inside, the home immediately feels bright, open, and inviting. Tile flooring runs throughout, creating a seamless, low-maintenance flow from room to room, while crown molding in the living room, dining room, kitchen, and primary bedroom adds a polished architectural touch. The heart of the home is the open kitchen, complete with granite countertops, a walk-in pantry, and generous workspace
Key facts
- Waterfront home
- Tile flooring
- Granite countertops
Tags
Neighborhood map
What this means for you Summary
Snapshot
- This is a 3-bed/3.0-bath single-family listed at $320k.
Deal economics
- At list price, monthly cash flow is $-26 ($-316/yr) — negative.
- To cash-flow at today's rent, offer at most $315k (1.5% below list).
- To meet the 1% rule (rent ≥ 1% of price), the offer needs to be $289k (9.6% below list).
- Recommended offer: $289k (9.6% below list) — sets the bar for 1% rule.
- Cap rate 6.2% vs local median 4.7% in Lehigh Acres — top-decile yield for the area; either an underpriced asset or a hidden risk that comps aren't pricing in. Stress-test before assuming the spread holds.
Location & tenants
- Location reads 59/100 on livability (#826 in FL) — a working-class tenant base; expect higher turnover. Strengths: cost of living A+, housing A+; Watch: crime C-, employment D+, amenities F.
- Lee (suburban): math 47% / reading 50% proficiency, ranked #42 of 73 in FL (top 58%) — families likely to look elsewhere, expect single-tenant / working-renter base with shorter leases.
- Zoned schools: Veterans Park Academy For The Arts (math 41% / reading 45%, grade F, #1,366 of 2,144 statewide, top 64%, 2,133 students, 36% FRL); Oak Hammock Middle School (math 43% / reading 41%, grade D-, #340 of 571 statewide, top 61%, 1,563 students, 56% FRL); Lehigh Senior High School (math 23% / reading 45%, grade F, #394 of 667 statewide, top 60%, 2,476 students, 57% FRL).
- Market conditions: 460 active listings in the ZIP; 36 comparable units currently listed for rent nearby; rentals at typical pace (median 18d on market — plan ~3-4 weeks tenant-placement turnaround); 15,411 units permitted in Lee County in 2024 (4,686 in 5+ unit buildings).
Forward outlook
- Local home prices are declining (-3.0%/yr); year-one equity from $2k of loan paydown is wiped out by about $10k of value loss. Plan a longer hold.
- Lee County population projected at +44% by 2050 — long-run rental-demand tailwind backs the buy-and-hold thesis.
Negotiation context
- It's been on market 64 days — a 6% lower offer ($301k) is reasonable based on typical stale-listing flexibility.
Risks & watch-outs
- Climate carrying-cost: severe wind risk, 99% chance of damaging wind over 30y; extreme-heat days projected 8→33/yr by 2055 (HVAC capex compounding) — expect insurance premiums to compound above CPI over the hold.
Questions for the listing agent
- What do current leases actually rent for vs. the listed asking? Can we see a recent rent roll and the last 12 months of T-12 income?
- It's been on market 64 days. Have you received any prior offers? Is the seller open to a 10% concession, seller financing, or rate buy-down credit?
- What does the HOA fee cover, when was the last increase, and are there any pending special assessments or reserve-fund shortfalls?
- Why hasn't it sold? Are there any deal-killer items the seller is aware of (foundation, flood, title, zoning, code violations)?
- Is there a deadline driving the sale (1031 exchange, divorce, estate, relocation)? That informs how much negotiation room exists.
- Schools are D-rated, which usually means shorter tenancies and higher turnover. Who's the typical renter profile here, and what's been the actual vacancy rate?
- The area grade is low — what's the realistic commute time and amenity access for the typical tenant pool here? Any planned neighborhood developments (good or bad) we should know about?
- What's the average days-on-market for RENTAL listings here right now (not sales)? A rising rental-DOM trend means longer vacancies and softer asking-rent achievability than the comps imply.
- What's the recent tenant-quality profile in this submarket — average credit score on applications, eviction rate, late-payment / NSF rate, and stable-employment percentage? A property-management company in the area should have these aggregated.
- How much new for-sale + rental construction is in the pipeline within 1–3 miles? Heavy new supply typically softens prices + rents 12–24 months out; constrained supply supports both.
Investment metrics
- 1% rule
- 0.90% ✗
- Cap rate
- 6.19%
- Cash-on-cash
- -0.35%
- DSCR
- 0.98
- GRM
- 9.2
CMA / ARV
- ARV (on-the-fly)
- $305,580
- Comps found
- 12
Show comp detail 12 sales within ~0.75 mi
| Address | Dist | Beds/Ba | Sqft | Sold | Price | $/sf | Match |
|---|---|---|---|---|---|---|---|
| 16123 Palmetto Prairie Dr | 0.21mi | 3/2.0 | 1,677 (-9%) | 4mo | $315,000 | $188 | 67 |
| 3321 Hampton Blvd | 0.34mi | 3/2.0 | 1,971 (+6%) | 3mo | $259,900 | $132 | 67 |
| 3411 75th St W | 0.59mi | 4/2.0 (+1) | 1,829 (-1%) | 0mo | $318,000 | $174 | 61 |
| 15076 Palamos Cir | 0.52mi | 4/3.0 (+1) | 1,933 (+4%) | 4mo | $312,000 | $161 | 60 |
| 16126 Rosemallow Ln | 0.36mi | 4/3.0 (+1) | 2,032 (+10%) | 10mo | $360,000 | $177 | 54 |
| 3440 Menores Way | 0.55mi | 4/3.0 (+1) | 2,032 (+10%) | 3mo | $315,000 | $155 | 51 |
| 15724 Angelica Dr | 0.49mi | 4/2.0 (+1) | 1,971 (+6%) | 9mo | $325,000 | $165 | 50 |
| 16480 Windsor Way | 0.65mi | 3/3.0 | 2,080 (+12%) | 2mo | $520,000 | $250 | 47 |
| 3866 Passion Vine Dr | 0.63mi | 4/3.0 (+1) | 2,032 (+10%) | 4mo | $305,000 | $150 | 46 |
| 3928 Sweet Alyssum Ter | 0.64mi | 4/3.0 (+1) | 2,032 (+10%) | 9mo | $300,000 | $148 | 41 |
| 16562 Windsor Way | 0.73mi | 2/2.0 (-1) | 2,027 (+9%) | 9mo | $450,000 | $222 | 34 |
| 6133 Hutton Ct | 0.70mi | 4/2.0 (+1) | 2,105 (+14%) | 13mo | $345,500 | $164 | 25 |
Match score weights: distance 35% · size 25% · config 20% · recency 20%. Top-matched comps best support the ARV.
Projected returns pro-forma
-3.0% appreciation · 3.0% rent growth · sell at horizon
- IRR
- -16.8%
- Equity multiple
- 0.40×
- Total profit
- $-53,406
- Equity at exit
- $47,698
- IRR
- -8.6%
- Equity multiple
- 0.46×
- Total profit
- $-48,232
- Equity at exit
- $27,659
Cash invested: $89,572 (down + closing). Projections, not guarantees.
Landlord ↔ Tenant lean methodology
- Overall (STATE)
- 87 Strongly Landlord-Friendly
- State Florida
- 87 Strongly Landlord-Friendly · R+3
- County
- — inherits STATE
- City
- — inherits STATE
ZIP-level market 33920
- Home prices YoY
- -11.8%
- Active inventory
- 460
- Price-to-rent
- 9.2×
Monthly cashflow live
- Estimated rent
- $2,893 high interval (Pro) →
- Mortgage (P&I)
- −$1,678
- Tax from tax record
- −$334 /mo · $4,007/yr
- Insurance
- −$133
- HOA
- −$167
- Vacancy / Maint / Mgmt
- −$608
- Net cashflow
- $-26
Break-even live
Sensitivity live
| Price | -10% $155 | -5% $64 | +0% $-26 | +5% $-117 | +10% $-207 |
|---|---|---|---|---|---|
| Rent | -10% $-255 | -5% $-141 | +0% $-26 | +5% $88 | +10% $202 |
| Rate | -1.0pp $135 | -0.5pp $55 | base $-26 | +0.5pp $-109 | +1.0pp $-194 |
UW: 25.0% down · 7.5% · 30yr · 1.5% tax · 5.0% vac · 8.0% maint · 8.0% mgmt
Financing live
Cash to close
- Down payment
- $79,975
- Closing costs
- $9,597
- Reserves months
- —
- Total cash needed
- —
Loan-product check · same deal, 3 products live
Conventional
25% down · 7.5% · 30yr
- Down + closing
- —
- Monthly P&I
- —
- Monthly cashflow
- —
- DSCR
- —
- Eligible?
- —
Personal DTI + credit; lowest rate.
DSCR
20% down · 8.5% · 30yr
- Down + closing
- —
- Monthly P&I
- —
- Monthly cashflow
- —
- DSCR
- —
- Eligible?
- —
No personal income docs; deal must DSCR.
Hard money
10% down · 12.0% · 12mo
- Down + closing
- —
- Monthly P&I
- —
- Monthly cashflow
- —
- DSCR
- —
- Eligible?
- —
Short-term bridge; refi at stabilization.
Rent comps 36 comps
| Address | Beds | Baths | Sqft | Rent | $/sqft | DOM | Units | Dist |
|---|---|---|---|---|---|---|---|---|
| 3425 Hampton Blvd Alva, FL | 3.0 | 2.0 | 2140 | $4,900 | $2.29 | 5d | 1 | 0.07mi |
| 16550 Goldenrod Ln #103 Alva, FL | 2.0 | 2.0 | 1916 | $3,500 | $1.83 | 25d | 1 | 0.27mi |
| 16195 Bacopa Dr Alva, FL | 3.0 | 3.0 | 2032 | $3,000 | $1.48 | 25d | 1 | 0.36mi |
| 15012 Palamos Cir Fort Myers, FL | 4.0 | 3.0 | 2092 | $3,400 | $1.63 | 25d | 1 | 0.38mi |
| 3606 Wild Sage Way Alva, FL | 3.0 | 3.0 | 2202 | $2,600 | $1.18 | 23d | 1 | 0.39mi |
| 3685 E Hampton Cir Alva, FL | 3.0 | 2.0 | 1675 | $2,200 | $1.31 | 13d | 1 | 0.39mi |
| 3655 Rain Lily Ln Alva, FL | 4.0 | 2.0 | 1851 | $2,250 | $1.22 | 25d | 1 | 0.44mi |
| 14632 Palamos Cir Fort Myers, FL | 4.0 | 3.0 | 2032 | $2,400 | $1.18 | 25d | 1 | 0.61mi |
| 3917 Passion Vine Dr Alva, FL | 4.0 | 3.0 | 1933 | $2,500 | $1.29 | 18d | 1 | 0.62mi |
| 14680 Portico Blvd Fort Myers, FL | 3.0 | 3.0 | 1850 | $6,000 | $3.24 | 25d | 1 | 0.62mi |
| 3776 Passion Vine Dr Unit 1 Alva, FL | 3.0 | 2.0 | 1885 | $2,200 | $1.17 | 25d | 1 | 0.65mi |
| 6136 Hellman Ave Fort Myers, FL | 3.0 | 2.0 | 1297 | $1,876 | $1.45 | 5d | 1 | 0.68mi |
| 3984 Sweet Alyssum Ter Alva, FL | 4.0 | 3.0 | 2032 | $2,500 | $1.23 | 5d | 1 | 0.70mi |
| 3502 72nd St W Lehigh Acres, FL | 4.0 | 2.0 | 1920 | $1,750 | $0.91 | 4d | 1 | 0.71mi |
| 3502 72nd St W Lehigh Acres, FL | 4.0 | 2.0 | 1389 | $1,750 | $1.26 | 18d | 1 | 0.71mi |
| 14570 Palamos Cir Fort Myers, FL | 3.0 | 3.0 | 1852 | $2,100 | $1.13 | 16d | 1 | 0.71mi |
| 14570 Palamos Cir Fort Myers, FL | 3.0 | 3.0 | 1852 | $2,100 | $1.13 | 15d | 1 | 0.71mi |
| 3958 Button Sage Rd Alva, FL | 4.0 | 3.0 | 2032 | $3,950 | $1.94 | 16d | 1 | 0.80mi |
| 6151 Hershey Ave Fort Myers, FL | 3.0 | 2.0 | 1616 | $2,100 | $1.30 | 25d | 1 | 0.81mi |
| 14662 Cantabria Dr Fort Myers, FL | 3.0 | 3.0 | 2202 | $2,400 | $1.09 | 25d | 1 | 0.89mi |
| 3370 Chestnut Grove Dr Alva, FL | 4.0 | 3.0 | 2362 | $3,500 | $1.48 | 25d | 1 | 0.89mi |
| 6108 Stratton Rd Fort Myers, FL | 3.0 | 2.0 | 1635 | $2,200 | $1.35 | 5d | 1 | 0.89mi |
| 14561 Monrovia Ln Fort Myers, FL | 4.0 | 3.0 | 2032 | $2,300 | $1.13 | 25d | 1 | 0.89mi |
| 14638 Cantabria Dr Fort Myers, FL | 3.0 | 3.0 | 1849 | $2,200 | $1.19 | 25d | 1 | 0.94mi |
| 6125 Hershey Ave Fort Myers, FL | 4.0 | 2.0 | 1879 | $2,700 | $1.44 | 16d | 1 | 0.96mi |
| 3406 68th St W Lehigh Acres, FL | 3.0 | 2.0 | 1472 | $1,875 | $1.27 | 5d | 1 | 0.98mi |
| 3404 68th St W Lehigh Acres, FL | 3.0 | 2.0 | 1458 | $1,855 | $1.27 | 5d | 1 | 0.98mi |
| 6050 Stratton Rd Fort Myers, FL | 3.0 | 2.0 | 1635 | $2,200 | $1.35 | 5d | 1 | 1.04mi |
| 3505 67th St W Lehigh Acres, FL | 4.0 | 2.0 | 1389 | $1,799 | $1.30 | 18d | 1 | 1.06mi |
| 6048 Stratton Rd Fort Myers, FL | 3.0 | 2.0 | 1635 | $2,200 | $1.35 | 5d | 1 | 1.06mi |
| 14562 Cantabria Dr Fort Myers, FL | 3.0 | 3.0 | 2202 | $2,495 | $1.13 | 25d | 1 | 1.10mi |
| 3208 66th St W Lehigh Acres, FL | 4.0 | 2.0 | 1800 | $2,100 | $1.17 | 13d | 1 | 1.24mi |
| 6016 Lindbrook Ave Fort Myers, FL | 3.0 | 2.0 | 1422 | $1,800 | $1.27 | 23d | 1 | 1.32mi |
| 3217 64th St W Lehigh Acres, FL | 4.0 | 2.0 | 1897 | $2,400 | $1.27 | 5d | 1 | 1.35mi |
| 3105 66th St W Lehigh Acres, FL | 3.0 | 2.0 | 1615 | $2,000 | $1.24 | 25d | 1 | 1.37mi |
| 2906 68th St W Lehigh Acres, FL | 3.0 | 2.0 | 1239 | $1,875 | $1.51 | 25d | 1 | 1.44mi |
HOA detail
- Monthly dues
- $167 · $2,004/yr
- Likely covers
- water
Listing history 9 events
-
2026-04-24status Pending
-
2026-03-16price $319,900
-
2026-02-19$335,000 Active
-
2012-08-31soldstatus $1,528,000
-
2008-12-24soldstatus $1,040,000
-
2005-12-15soldstatus $6,250,000
-
2004-06-01soldstatus $19,100,000
-
2003-09-30soldstatus $29,974,100
-
2000-11-08soldstatus $5,800,000
ⓘ Source: listings_history table (triggers on properties + properties_extension) + one-shot
backfill from property_details.listing_events for pre-trigger history.
Tax reassessment forecast FL · Resets to sale price
- Current annual tax
- $4,007 · $334/mo
- Projected year-2 tax
- $4,007 · $334/mo
- Expected delta
- $0/yr ($0/mo · -0.0%)
ⓘ Screening estimate from a state-policy table — verify with the county assessor before closing.
Climate risk First Street
- Flood 1/10 Low FEMA zone X (unshaded) · 0% chance over 30 yrs
- Wildfire 3/10 Moderate
- Heat 10/10 Extreme 8 d/yr ≥107°F today · 33 d/yr by 30 yrs out
- Wind 10/10 Extreme 99% chance of damaging wind over 30 yrs
- Air quality 2/10 Low 1 unhealthy d/yr today · 1 by 30 yrs out
Nearby sold comps map
Loading sold comps map…
Walkable amenities ~0.75 mi
Loading nearby amenities…
Taxation est. · year 1
- Rental income
- $34,717
- − Mortgage interest
- −$17,919
- − Property taxes
- −$4,007
- − Insurance
- −$1,600
- − Repairs & maintenance
- −$2,777
- − Management
- −$2,777
- − HOA
- −$2,004
- − Depreciation
- −$9,306
- Taxable loss
- −$5,674
- Est. tax savings @ 24.0%
- +$1,362
- After-tax cash flow
- $1,046/yr
For passive investors: Depreciation is non-cash, so a rental often shows a tax loss while cash-flowing — sheltering income. Rental losses are passive: they offset passive income freely, and up to $25,000/yr can offset ordinary (W-2) income if you actively participate and your MAGI is under $100k (phasing out to $0 by $150k); unused losses carry forward. On sale, claimed depreciation is recaptured at up to 25%, and gains may owe capital-gains tax (a 1031 exchange can defer both). Figures are a year-1 estimate at your 24.0% rate — not tax advice; consult a CPA.
Schools (NCES district)
- District
- Lee
- NCES district ID
- 1201080
- Math proficiency
- 47% ▼ -11.00%
- Reading proficiency
- 50% ▼ -4.00%
- Median HH income
- $49,518
- Composite
- 41.49/100
- National rank
- #3458
- State rank
- #42 of 73 in FL
Livability — Lehigh Acres
- Score
- 59/100
- State rank
- #826
- US rank
- #20055
Category grades
Schools grade is shown separately in the Schools card above.
Census & demographics
- City population
- 130,638
- Population (ZIP)
- 7,689
Population outlook (Lee County) Hauer SSP2
- Today (2025)
- 871,946 people
- By 2030
- 955,468 · +9.6%
- By 2040
- 1,113,587 · +27.7%
- By 2050
- 1,256,891 · +44.1%
- By 2075
- 1,560,270 · +78.9%
- By 2100
- 1,726,848 · +98.0%
Race, ethnicity, and origin ACS 2023
- Neighborhood character
- Predominantly White (82%)
- Race & ethnicity
- White 82% Hispanic / Latino 8% Two or more races 7% Asian 5% Black 1%
- Hispanic origin (detail)
- Mexican 3% Puerto Rican 2% Cuban 1%
- Common ancestry
- Romanian 6% Portuguese 5% German 3%
- Foreign-born
- 11% · Canada, Vietnam
- Languages at home
- 90% English-only · Spanish 5% Other Asian/Pacific 2% Vietnamese 2%
Political lean MEDSL · Lee
- 2024 margin
- Strong R (+28.4) · D 35.5% · R 63.9%
- 2008→2024 swing
- -18.0pp toward R · 2008: -10.4pp · 2024: -28.4pp
- All cycles
- 2024: R+28.4 2020: R+19.2 2016: R+20.4 2012: R+16.6 2008: R+10.4
Not yet ingested
- Civics
- —
Market trends
- HPI YoY
- ▼ -47.83%
- Current HPI
- 355.9229
- Rent YoY
- —
- Metro
- —
- State GDP YoY
- ▲ 3.28%
- F500 in state
- 36
Industry mix (Fortune 500 HQ in FL)
| Industry | F500 HQs | Revenue |
|---|---|---|
| Industrial Technology | 2 | $29B |
|
||
| Insurance | 2 | $17B |
|
||
| Retail | 1 | $60B |
|
||
| Technology Distribution | 1 | $58B |
|
||
| Homebuilding | 1 | $35B |
|
||
| Technology Manufacturing | 1 | $35B |
|
||
Price history
-94.5% since first listed9 events — show timeline
- 2026-04-24 Pending — FORTMLS
- 2026-03-16 Price Changed $319,900 FORTMLS
- 2026-02-19 Listed $335,000 FORTMLS
- 2012-08-31 Sold (Public Records) $1,528,000 Public Records
- 2008-12-24 Sold (Public Records) $1,040,000 Public Records
- 2005-12-15 Sold (Public Records) $6,250,000 Public Records
- 2004-06-01 Sold (Public Records) $19,100,000 Public Records
- 2003-09-30 Sold (Public Records) $29,974,100 Public Records
- 2000-11-08 Sold (Public Records) $5,800,000 Public Records
Property tax history
+10.9%/yrLatest (2025): $4,007 · +3.2% YoY. Source: county tax records.
Cash-flow waterfall
monthlySold comps — $/sqft
last 12 mo · ≤1 miLoading sold comps…