 Duplex
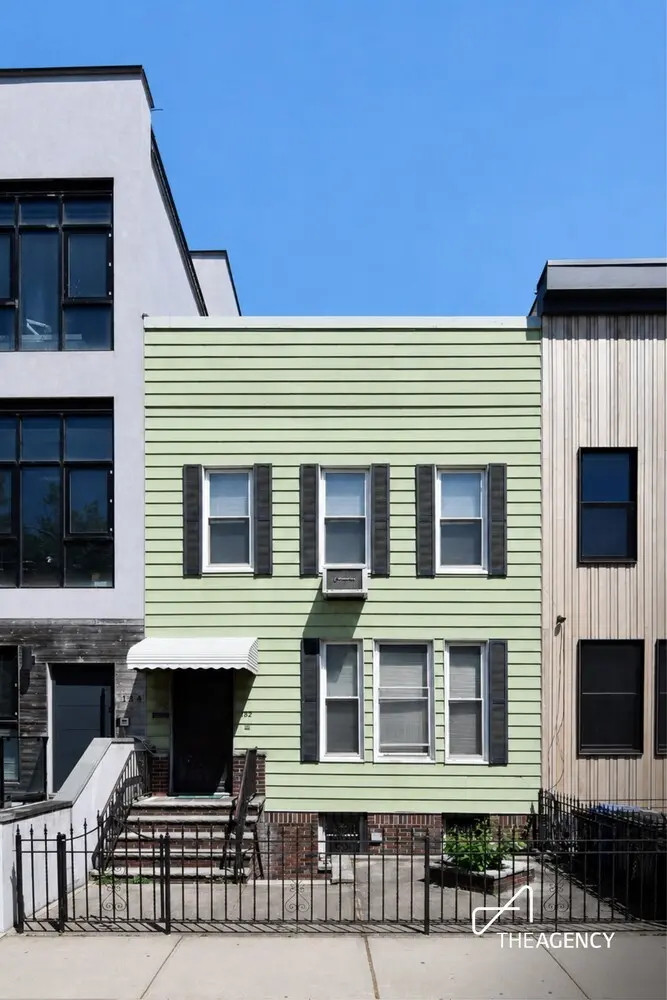
182 Russell St · New York, NY
Flood risk 7/10 · Major
- FEMA flood zone
- X (unshaded)
- Chance of flooding over 30 yrs
- 0.76%
- Est. flood insurance / yr
- $507 – $1,088
Fire risk 1/10 · Minimal
- Est. fire insurance / yr
- $691 – $1,283
Heat risk 6/10 · Moderate
- Hot days now (above 99°F)
- 7 days/yr
- Hot days in 30 yrs
- 15 days/yr
Wind risk 6/10 · Moderate
- Chance of severe wind over 30 yrs
- 27.0%
Air-quality risk 5/10 · Moderate
- Unhealthy air days now
- 6 days/yr
- Unhealthy air days in 30 yrs
- 8 days/yr
Risk factors via First Street. Map © Google.
Why this score? — see what drove the D- grade
The composite is a weighted blend of 9 inputs, each scored 0–100. Each bar is that input's sub-score; the figure is the points it added to the 100-point composite (weight × sub-score).
- Appreciation +10.0/10.0
- ARV discount +7.5/15.0
- Cash flow +6.7/30.0
- Schools +5.0/10.0
- Livability +3.8/5.0
- Rent growth +2.8/5.0
- Condition / age +2.5/5.0
- DSCR +0.9/10.0
- 1% rule +0.4/10.0
$2,200,000
🖨 Deal sheet (PDF) 📄 Offer letter ✓ Due diligence
Multi-family units
County records classify this as Multi-Family (2-4 Unit). Listing-text estimate: 2 units. confirmed
Listing remarks
We are proud to present this Greenpoint Gem to the market. This well maintained two unit home sits on a Huge 20 by 100 foot lot and is on one of the friendliest blocks in all of Brooklyn. One Block to McGorlick park! This lovingly taken care of property offers may options for the new owners to renovate for top rental income, remodel for live with rental, redevelop into one unit mansion or a building with multiple units ( lot allows for up to 4000 bsf. ) the possibilities are endless. Will be delivered vacant. Contact us today for your exclusive showing of this lovely home.
Key facts
- Huge lot
- 2,000 sq ft lot
- Built 1901
Tags
Property features AI
Finance
- Other: Multi-unit property with 2 total units
- HOA & community: Pets allowed in building (restrictions apply)
Exterior
- Utilities: Has cooling
- Home design: 2-story building; Entry level: 1
- Construction: Green building
- Exterior features: Has a view; Lot approximately 2,000 (dimensions 100.00 x 20.00)
Interior
- Bedrooms: Total rooms: 12 (includes bedrooms and living spaces); Entry level is 1
- Bathrooms: 2 full bathrooms; 1 half bathroom
- Interior features: Smoke-free; Decorative fireplace (1)
- Laundry & utility: In-unit laundry
Neighborhood map
What this means for you Summary
Snapshot
- This is a 2 × 2-bed/1-bath units multifamily listed at $2.20M.
Deal economics
- At list price, monthly cash flow is $-4k ($-43k/yr) — negative. Per door: $-2k/mo.
- To cash-flow at today's rent, offer at most $1.57M (28.8% below list).
- To meet the 1% rule (rent ≥ 1% of price), the offer needs to be $1.19M (45.8% below list).
- Recommended offer: $1.19M (45.8% below list) — sets the bar for 1% rule.
- Cap rate 4.4% vs local median 2.6% in New York — top-decile yield for the area; either an underpriced asset or a hidden risk that comps aren't pricing in. Stress-test before assuming the spread holds.
Location & tenants
- Location reads 75/100 on livability (#268 in NY, #4,188 nationally) — a middle-class / working-renter tenant base. Strengths: amenities A+, commute A+, health & safety A; Watch: crime F, cost of living F.
- Zoned schools: Elm Tree Elementary School (math 27% / reading 52%, grade F, #1,444 of 2,108 statewide, top 71%, 806 students, 94% FRL); Is 318 Eugenio Maria De Hostos (math 54% / reading 74%, grade A-, #121 of 729 statewide, top 17%, 1,069 students, 64% FRL); Midwood High School (math 94% / reading 96%, grade A+, #83 of 1,100 statewide, top 8%, 4,062 students, 73% FRL).
- Market conditions: Rents rising (+1.0%/yr); 105 active listings in the ZIP; 1 comparable units currently listed for rent nearby; high-income renter base; 10,063 units permitted in Kings County in 2024 (9,789 in 5+ unit buildings).
- At $11,932/mo this rent would consume 114% of the median local household income ($126k/yr) (locally 3139% of renters already pay >50% of income on rent) — very limited rent-growth headroom before tenants either downsize or default.
Forward outlook
- In year one you build about $235k of equity ($15k loan paydown + $220k appreciation (10.0% local appreciation)).
- Kings County population projected at +13% by 2050 — modest demand growth; plan on rents tracking national, not racing it.
- By year 2, paydown + projected appreciation supports a ~$378k cash-out refi (75% LTV) — recoverable capital for the next deal without selling this one.
Negotiation context
- It's been on market 34 days — a 3% lower offer ($2.13M) is reasonable based on typical stale-listing flexibility.
- Current owner paid $65k; list at $2.20M implies a 3285% gain — meaningful room to come down on a strong offer.
Risks & watch-outs
- Watch-outs: flood insurance adds $66/mo; built in 1901 — expect roof / HVAC / electrical / plumbing capex.
- Climate carrying-cost: major flood risk; major wind risk, 27% chance of damaging wind over 30y; extreme-heat days projected 7→15/yr by 2055 (HVAC capex compounding) — expect insurance premiums to compound above CPI over the hold.
Questions for the listing agent
- What do current leases actually rent for vs. the listed asking? Can we see a recent rent roll and the last 12 months of T-12 income?
- It's been on market 34 days. Have you received any prior offers? Is the seller open to a 46% concession, seller financing, or rate buy-down credit?
- Can we see the unit-by-unit rent roll, current vacancy, and any below-market leases? What's the average tenancy length?
- What capital expenditures (roof, boiler, parking lot, exteriors) have been made in the last 5 years, and what's planned in the next 2?
- Built in 1901 — when were the roof, HVAC, electrical panel, plumbing, and water heater last replaced?
- What's the actual annual flood-insurance premium (NFIP or private), and is the property in a SFHA with mandatory coverage?
- Is there a deadline driving the sale (1031 exchange, divorce, estate, relocation)? That informs how much negotiation room exists.
- Schools are B-rated — typically a magnet for longer-tenancy family renters. What's the average tenant stay here, and is there a school-zone premium baked into asking?
- Crime grade is F in this area — have there been break-ins, vandalism, or insurance claims at this property in the last 3 years? What carrier currently insures it and at what premium?
- The area grade is low — what's the realistic commute time and amenity access for the typical tenant pool here? Any planned neighborhood developments (good or bad) we should know about?
- What's the average days-on-market for RENTAL listings here right now (not sales)? A rising rental-DOM trend means longer vacancies and softer asking-rent achievability than the comps imply.
- What's the recent tenant-quality profile in this submarket — average credit score on applications, eviction rate, late-payment / NSF rate, and stable-employment percentage? A property-management company in the area should have these aggregated.
- How much new apartment / multifamily construction is in the pipeline within 1–3 miles? Heavy new supply (>2% of stock underway) typically softens rents 12–24 months out; light construction supports rent growth.
Investment metrics
- 1% rule
- 0.54% ✗
- Cap rate
- 4.37%
- Cash-on-cash
- -6.86%
- DSCR
- 0.69
- GRM
- 15.4
CMA / ARV
No comps found within radius.
Projected returns pro-forma
10.0% appreciation · 1.02% rent growth · sell at horizon
- IRR
- 18.9%
- Equity multiple
- 2.53×
- Total profit
- $945,027
- Equity at exit
- $1,981,934
- IRR
- 17.2%
- Equity multiple
- 5.74×
- Total profit
- $2,916,884
- Equity at exit
- $4,274,116
Cash invested: $616,000 (down + closing). Projections, not guarantees.
Landlord ↔ Tenant lean methodology
- Overall (CITY)
- 0 Strongly Tenant-Friendly
- State New York
- 15 Strongly Tenant-Friendly · D+10
- County
- — inherits STATE
- City New York
- 0 Strongly Tenant-Friendly · D+34
ZIP-level market 11222
- Home prices YoY
- 2.9%
- Rents YoY
- 1.0%
- Active inventory
- 105
- Price-to-rent
- 30.7×
Monthly cashflow live
- Estimated rent
- $11,932 high interval (Pro) →
- Mortgage (P&I)
- −$11,537
- Tax from tax record
- −$497 /mo · $5,958/yr
- Insurance
- −$917
- Flood insurance flood zone
- −$66 /mo · $798/yr
- HOA
- −$0
- Lot rent
- −$0
- Vacancy / Maint / Mgmt
- −$2,506
- Net cashflow
- $-3,590
Break-even live
Sensitivity live
| Price | -10% $-2,345 | -5% $-2,968 | +0% $-3,590 | +5% $-4,213 | +10% $-4,836 |
|---|---|---|---|---|---|
| Rent | -10% $-4,533 | -5% $-4,062 | +0% $-3,590 | +5% $-3,119 | +10% $-2,648 |
| Rate | -1.0pp $-2,482 | -0.5pp $-3,031 | base $-3,590 | +0.5pp $-4,160 | +1.0pp $-4,740 |
2-unit breakdown (identical units grouped — click to expand)
| Units | Beds | Baths | Est. rent |
|---|---|---|---|
| 2× units | 2 | 1 | $11,932 |
| #1 | 2 | 1 | $5,966 |
| #2 | 2 | 1 | $5,966 |
| Total (2 units) | $11,932 | ||
UW: 25.0% down · 7.5% · 30yr · 1.5% tax · 5.0% vac · 8.0% maint · 8.0% mgmt
Financing live
Cash to close
- Down payment
- $550,000
- Closing costs
- $66,000
- Reserves months
- —
- Total cash needed
- —
Loan-product check · same deal, 3 products live
Conventional
25% down · 7.5% · 30yr
- Down + closing
- —
- Monthly P&I
- —
- Monthly cashflow
- —
- DSCR
- —
- Eligible?
- —
Personal DTI + credit; lowest rate.
DSCR
20% down · 8.5% · 30yr
- Down + closing
- —
- Monthly P&I
- —
- Monthly cashflow
- —
- DSCR
- —
- Eligible?
- —
No personal income docs; deal must DSCR.
Hard money
10% down · 12.0% · 12mo
- Down + closing
- —
- Monthly P&I
- —
- Monthly cashflow
- —
- DSCR
- —
- Eligible?
- —
Short-term bridge; refi at stabilization.
Rent comps 1 comps
| Address | Beds | Baths | Sqft | Rent | $/sqft | DOM | Units | Dist |
|---|---|---|---|---|---|---|---|---|
| 475 48th Ave Long Island City, NY | 3.0 | 1.0–3.0 | 1293 | $8,851 | $6.84 | 0d | 1 | 1.39mi |
Listing history 17 events
-
2026-06-22days on market $2,200,000 Active 34 DOM
-
2026-06-21days on market $2,200,000 Active 33 DOM
-
2026-06-18days on market $2,200,000 Active 30 DOM
-
2026-06-17days on market $2,200,000 Active 29 DOM
-
2026-06-16days on market $2,200,000 Active 28 DOM
-
2026-06-15days on market $2,200,000 Active 27 DOM
-
2026-06-13days on market $2,200,000 Active 25 DOM
-
2026-06-10days on market $2,200,000 Active 21 DOM
-
2026-06-08days on market $2,200,000 Active 20 DOM
-
2026-06-08days on market $2,200,000 Active 19 DOM
-
2026-06-04days on market $2,200,000 Active 16 DOM
-
2026-06-03days on market $2,200,000 Active 15 DOM
-
2026-06-02days on market $2,200,000 Active 14 DOM
-
2026-06-01days on market $2,200,000 Active 13 DOM
-
2026-05-31days on market $2,200,000 Active 12 DOM
-
2026-05-19$2,200,000 Active
-
1984-11-20soldstatus $65,000
ⓘ Source: listings_history table (triggers on properties + properties_extension) + one-shot
backfill from property_details.listing_events for pre-trigger history.
Tax reassessment forecast NY · Partial reset (capped growth)
- Current annual tax
- $5,958 · $497/mo
- Projected year-2 tax
- $21,569 · $1,797/mo
- Expected delta
- +$15,611/yr (+$1,301/mo · 262.0%)
ⓘ Screening estimate from a state-policy table — verify with the county assessor before closing.
Climate risk First Street
- Flood 7/10 Severe FEMA zone X (unshaded) · 76% chance over 30 yrs
- Wildfire 1/10 Low
- Heat 6/10 Major 7 d/yr ≥99°F today · 15 d/yr by 30 yrs out
- Wind 6/10 Major 27% chance of damaging wind over 30 yrs
- Air quality 5/10 Major 6 unhealthy d/yr today · 8 by 30 yrs out
Nearby sold comps map
Loading sold comps map…
Walkable amenities ~0.75 mi
Loading nearby amenities…
Taxation est. · year 1
- Rental income
- $143,184
- − Mortgage interest
- −$123,234
- − Property taxes
- −$5,958
- − Insurance
- −$11,798
- − Repairs & maintenance
- −$11,455
- − Management
- −$11,455
- − Depreciation
- −$64,000
- Taxable loss
- −$84,715
- Est. tax savings @ 24.0%
- +$20,332
- After-tax cash flow
- $-22,753/yr
For passive investors: Depreciation is non-cash, so a rental often shows a tax loss while cash-flowing — sheltering income. Rental losses are passive: they offset passive income freely, and up to $25,000/yr can offset ordinary (W-2) income if you actively participate and your MAGI is under $100k (phasing out to $0 by $150k); unused losses carry forward. On sale, claimed depreciation is recaptured at up to 25%, and gains may owe capital-gains tax (a 1031 exchange can defer both). Figures are a year-1 estimate at your 24.0% rate — not tax advice; consult a CPA.
Schools (NCES district)
No district data.
Livability — New York
- Score
- 75/100
- State rank
- #268
- US rank
- #4188
Category grades
Schools grade is shown separately in the Schools card above.
Census & demographics
- Census place
- New York, NY
- County
- Kings County · 2,614,986 people
- City population
- 7,731,280
- Metro
- New York-Newark-Jersey City, NY-NJ-PA
- Population (ZIP)
- 42,853
- Household income
- $125,734
- Rent vs Own
- Severe rent burden
- 3139.0
Population outlook (Kings County) Hauer SSP2
- Today (2025)
- 2,847,441 people
- By 2030
- 2,937,006 · +3.1%
- By 2040
- 3,095,491 · +8.7%
- By 2050
- 3,228,968 · +13.4%
- By 2075
- 3,321,723 · +16.7%
- By 2100
- 3,111,387 · +9.3%
Race, ethnicity, and origin ACS 2023
- Neighborhood character
- Predominantly White (68%)
- Race & ethnicity
- White 68% Hispanic / Latino 15% Two or more races 13% Asian 6% Black 4%
- Hispanic origin (detail)
- Mexican 2% Puerto Rican 4% Dominican 2%
- Common ancestry
- Romanian 15% Slovak 3% Lithuanian 3%
- Foreign-born
- 26% · Canada, China, South Korea
- Languages at home
- 68% English-only · Russian/Polish/Slavic 12% Spanish 10% Other Indo-European 3%
Political lean MEDSL · Kings
- 2024 margin
- Solid D (+44.0) · D 72.0% · R 28.0%
- 2008→2024 swing
- -15.5pp toward R · 2008: 59.4pp · 2024: 44.0pp
- All cycles
- 2024: D+44.0 2020: D+54.8 2016: D+61.8 2012: D+63.9 2008: D+59.4
Not yet ingested
- Civics
- —
Market trends
- HPI YoY
- ▲ 22.48%
- Current HPI
- 787.4068
- Rent YoY
- ▲ 1.02%
- Metro
- New York-Newark-Jersey City, NY-NJ-PA
- State GDP YoY
- ▲ 2.60%
- F500 in state
- 92
Industry mix (Fortune 500 HQ in NY)
| Industry | F500 HQs | Revenue |
|---|---|---|
| Financial Services | 10 | $950B |
|
||
| Consumer Goods | 9 | $162B |
|
||
| Insurance | 4 | $225B |
|
||
| Telecommunications | 2 | $144B |
|
||
| Pharmaceuticals | 2 | $112B |
|
||
| Media / Entertainment | 2 | $69B |
|
||
Price history
+3284.6% since first listed2 events — show timeline
- 2026-05-19 Listed $2,200,000 RLS at REBNY
- 1984-11-20 Sold (Public Records) $65,000 Public Records
Property tax history
+5.8%/yrLatest (2024): $5,958 · +3.4% YoY. Source: county tax records.
Cash-flow waterfall
monthlySold comps — $/sqft
last 12 mo · ≤1 miLoading sold comps…