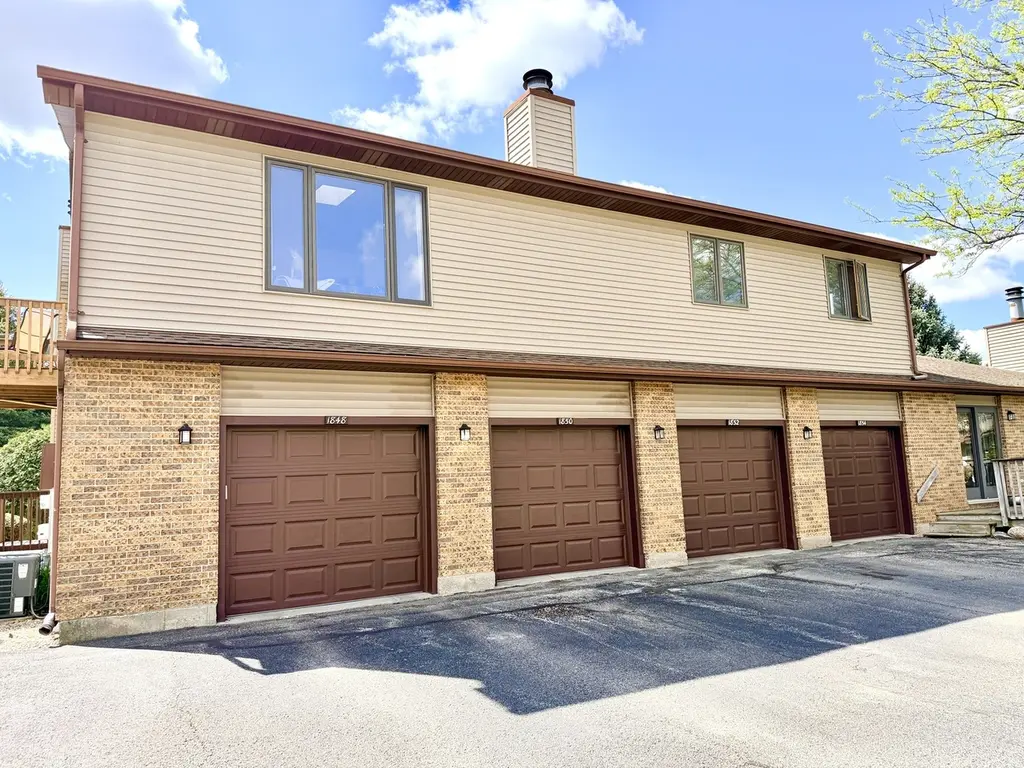
1848 Kerrybrook Ct #1848 · Sycamore, IL
Flood risk 1/10 · Minimal
- FEMA flood zone
- X (unshaded)
- Chance of flooding over 30 yrs
- 0.0%
- Est. flood insurance / yr
- $473 – $860
Fire risk 1/10 · Minimal
- Est. fire insurance / yr
- $804 – $1,492
Heat risk 3/10 · Minor
- Hot days now (above 101°F)
- 7 days/yr
- Hot days in 30 yrs
- 15 days/yr
Wind risk 2/10 · Minimal
- Chance of severe wind over 30 yrs
- —
Air-quality risk 3/10 · Minor
- Unhealthy air days now
- 2 days/yr
- Unhealthy air days in 30 yrs
- 3 days/yr
Risk factors via First Street. Map © Google.
Why this score? — see what drove the F grade
The composite is a weighted blend of 9 inputs, each scored 0–100. Each bar is that input's sub-score; the figure is the points it added to the 100-point composite (weight × sub-score).
- Cash flow +8.7/30.0
- ARV discount +7.5/15.0
- 1% rule +4.3/10.0
- Livability +3.8/5.0
- Schools +2.7/10.0
- Rent growth +2.5/5.0
- Condition / age +2.5/5.0
- DSCR +2.4/10.0
- Appreciation +0.0/10.0
$175,000
🖨 Deal sheet 📄 Offer letter ✓ Due diligence
Listing remarks MLS
Investor or 1st time buyer...Location, Location, Location...Quiet community...close to everything. Not a SS or foreclosure. Move-In Ready! Master BR has sink/vanity off full bath. Penthouse...Green space view off your private balcony. Not a drive by...come in and check it out! Community Pool & Clubhouse. Siding Replacement Sch Summer 2012 on this bldg and will be the same as unit across the street.
Key facts
- Private balcony
- Walk-in closet
- Community clubhouse
Tags
Property features AI
Finance
- Other: Subdivision: Woodgate; School bus service available; Not currently leased
- HOA & community: Monthly association fee of $219; HOA fee covers parking, insurance, clubhouse, pool, exterior maintenance, lawn care, and snow removal; Pets allowed (cats and dogs), pet policy permissive
Exterior
- Parking: Attached garage (garage owned) with garage door opener; Asphalt parking; Total of 1 parking space
- Security: Smoke/CO detectors present
- Utilities: Public water; Public sewer; Electric with circuit breakers; Gas for heating and water heater
- Home design: Attached single condo (PENTHOUSE model); Entry level 2; Fee simple ownership with homeowners association; Building contains 4 units; Asphalt roof
- Construction: Built 31–40 years ago; Vinyl siding; Concrete perimeter foundation
- Exterior features: Deck
Interior
- Kitchen: Galley kitchen (9 x 8), laminate flooring; Range, microwave, dishwasher, refrigerator, electric oven, disposal
- Bedrooms: Master bedroom on main level (13 x 14), carpeted; Second bedroom on main level (11 x 10), carpeted
- Flooring: Carpet in main living areas and bedrooms; Laminate in kitchen; Vinyl in laundry
- Bathrooms: One full bathroom
- Fireplace: One gas-log fireplace in the living room
- Heating & cooling: Natural gas forced air heating; Central air conditioning; CO detectors and ceiling fans installed; Circuit breaker electrical
- Interior features: Walk-in closet(s); Skylight(s) and window treatments (drapes); Five total rooms
- Laundry & utility: Upper-level laundry with washer hookup — in-unit laundry closet (5 x 6), vinyl flooring; Washer and dryer included; Gas water heater
Neighborhood map
What this means for you Summary
Snapshot
- This is a 2-bed/1.0-bath condo listed at $175k.
Deal economics
- At list price, monthly cash flow is $-147 ($-2k/yr) — negative.
- To cash-flow at today's rent, offer at most $154k (12.2% below list).
- To meet the 1% rule (rent ≥ 1% of price), the offer needs to be $162k (7.3% below list).
- Recommended offer: $154k (12.2% below list) — sets the bar for cash-flow.
- Cap rate 5.3% vs local median 2.5% in Sycamore — top-decile yield for the area; either an underpriced asset or a hidden risk that comps aren't pricing in. Stress-test before assuming the spread holds.
Location & tenants
- Location reads 76/100 on livability (#203 in IL, #3,734 nationally) — a middle-class / working-renter tenant base. Strengths: crime A+, commute A+, housing A+; Watch: amenities F.
- Sycamore CUSD 427 (suburban): math 26% / reading 32% proficiency, ranked #234 of 620 in IL (top 38%) — low school quality limits family demand, transient renter base, plan for 1-2y turnover.
- Zoned schools: Sycamore Middle School (math 20% / reading 26%, grade F, #377 of 665 statewide, top 58%, 822 students, 0% FRL); Sycamore High School (math 28% / reading 38%, grade F, #151 of 693 statewide, top 22%, 1,191 students, 0% FRL) — zoned schools average 0% FRL vs 23% district-wide (23 pts lower); this property's tenant base skews higher-income than the district average.
- Market conditions: 121 active listings in the ZIP; 4 comparable units currently listed for rent nearby; rentals leasing fast (median 1d on market — plan ~1-2 weeks tenant-placement turnaround); solid renter incomes; 260 units permitted in DeKalb County in 2024 (73 in 5+ unit buildings).
Forward outlook
- Local home prices are declining (-3.0%/yr); year-one equity from $1k of loan paydown is wiped out by about $5k of value loss. Plan a longer hold.
- DeKalb County population projected to shrink 5% by 2050 — rents likely to lag national; underwrite the cash flow, not the appreciation.
Negotiation context
- Only 3 days on market — expect competitive offers; lowballing is unlikely to land.
- 3 sale attempts since 17y ago with the ask held roughly flat each time — persistent listings suggest the price (not the market) is what's stuck; bring a comps-based counter.
- Current owner paid $59k; list at $175k implies a 197% gain — meaningful room to come down on a strong offer.
Questions for the listing agent
- What do current leases actually rent for vs. the listed asking? Can we see a recent rent roll and the last 12 months of T-12 income?
- What does the HOA fee cover, when was the last increase, and are there any pending special assessments or reserve-fund shortfalls?
- Any open or pending special assessments — roof, HVAC, plumbing, elevator, façade? What's the per-unit balance and payoff schedule, and is the seller paying it off at close or rolling it to the buyer?
- Is there a deadline driving the sale (1031 exchange, divorce, estate, relocation)? That informs how much negotiation room exists.
- The area grade is low — what's the realistic commute time and amenity access for the typical tenant pool here? Any planned neighborhood developments (good or bad) we should know about?
- What's the average days-on-market for RENTAL listings here right now (not sales)? A rising rental-DOM trend means longer vacancies and softer asking-rent achievability than the comps imply.
- What's the recent tenant-quality profile in this submarket — average credit score on applications, eviction rate, late-payment / NSF rate, and stable-employment percentage? A property-management company in the area should have these aggregated.
- How much new apartment / multifamily construction is in the pipeline within 1–3 miles? Heavy new supply (>2% of stock underway) typically softens rents 12–24 months out; light construction supports rent growth.
Investment metrics
- 1% rule
- 0.93% ✗
- Cap rate
- 5.28%
- Cash-on-cash
- -3.60%
- DSCR
- 0.84
- GRM
- 9.0
CMA / ARV
No comps found within radius.
Projected returns pro-forma
-3.0% appreciation · 3.0% rent growth · sell at horizon
- IRR
- -22.2%
- Equity multiple
- 0.23×
- Total profit
- $-37,563
- Equity at exit
- $26,093
- IRR
- -16.0%
- Equity multiple
- 0.10×
- Total profit
- $-44,121
- Equity at exit
- $15,131
Cash invested: $49,000 (down + closing). Projections, not guarantees.
Landlord ↔ Tenant lean methodology
- Overall (STATE)
- 43 Moderately Tenant-Leaning
- State Illinois
- 43 Moderately Tenant-Leaning · D+7
- County
- — inherits STATE
- City
- — inherits STATE
ZIP-level market 60178
- Active inventory
- 121
- Price-to-rent
- 9.0×
Monthly cashflow live
- Estimated rent
- $1,622 medium interval (Pro) →
- Mortgage (P&I)
- −$918
- Tax est. 1.5%
- −$219 /mo · $2,625/yr
- Insurance
- −$73
- HOA
- −$219
- Vacancy / Maint / Mgmt
- −$341
- Net cashflow
- $-147
Break-even live
UW: 25.0% down · 7.5% · 30yr · 1.5% tax · 5.0% vac · 8.0% maint · 8.0% mgmt
Financing live
Cash to close
- Down payment
- $43,750
- Closing costs
- $5,250
- Reserves months
- —
- Total cash needed
- —
Loan-product check · same deal, 3 products live
Conventional
25% down · 7.5% · 30yr
- Down + closing
- —
- Monthly P&I
- —
- Monthly cashflow
- —
- DSCR
- —
- Eligible?
- —
Personal DTI + credit; lowest rate.
DSCR
20% down · 8.5% · 30yr
- Down + closing
- —
- Monthly P&I
- —
- Monthly cashflow
- —
- DSCR
- —
- Eligible?
- —
No personal income docs; deal must DSCR.
Hard money
10% down · 12.0% · 12mo
- Down + closing
- —
- Monthly P&I
- —
- Monthly cashflow
- —
- DSCR
- —
- Eligible?
- —
Short-term bridge; refi at stabilization.
Rent comps 4 comps
| Address | Beds | Baths | Sqft | Rent | $/sqft | DOM | Units | Dist |
|---|---|---|---|---|---|---|---|---|
| 1846 Kerrybrook Ct #1846 Sycamore, IL | 2.0 | 1.0 | 1050 | $1,750 | $1.67 | 1d | 1 | 0.04mi |
| 2050 Coltonville Rd Unit 2050 Sycamore, IL | 2.0 | 1.0 | 725 | $975 | $1.34 | 1d | 1 | 0.29mi |
| 400 S Peace Rd Sycamore, IL | 2.0 | 1.5 | 1155 | $1,800 | $1.56 | 1d | 1 | 1.01mi |
| 927 Townsend St Sycamore, IL | 3.0 | 2.0 | 988 | $1,925 | $1.95 | 43d | 1 | 1.48mi |
HOA detail condo
- Monthly dues
- $219 · $2,628/yr
- Likely covers
- pool
- Assessments
- None detected in remarks — confirm with the listing agent.
Listing history 4 events
-
2026-06-18days on market $175,000 Active 3 DOM
-
2026-06-17days on market $175,000 Active 2 DOM
-
2026-06-15remarks 699-char remark
-
2026-06-15$175,000 Active 1 DOM
ⓘ Source: listings_history table (triggers on properties + properties_extension) + one-shot
backfill from property_details.listing_events for pre-trigger history.
Climate risk First Street
- Flood 1/10 Low FEMA zone X (unshaded) · 0% chance over 30 yrs
- Wildfire 1/10 Low
- Heat 3/10 Moderate 7 d/yr ≥101°F today · 15 d/yr by 30 yrs out
- Wind 2/10 Low
- Air quality 3/10 Moderate 2 unhealthy d/yr today · 3 by 30 yrs out
Nearby sold comps map
Loading sold comps map…
Walkable amenities ~0.75 mi
Loading nearby amenities…
Taxation est. · year 1
- Rental income
- $19,464
- − Mortgage interest
- −$9,803
- − Property taxes
- −$2,625
- − Insurance
- −$875
- − Repairs & maintenance
- −$1,557
- − Management
- −$1,557
- − HOA
- −$2,628
- − Depreciation
- −$5,091
- Taxable loss
- −$4,672
- Est. tax savings @ 24.0%
- +$1,121
- After-tax cash flow
- $-643/yr
For passive investors: Depreciation is non-cash, so a rental often shows a tax loss while cash-flowing — sheltering income. Rental losses are passive: they offset passive income freely, and up to $25,000/yr can offset ordinary (W-2) income if you actively participate and your MAGI is under $100k (phasing out to $0 by $150k); unused losses carry forward. On sale, claimed depreciation is recaptured at up to 25%, and gains may owe capital-gains tax (a 1031 exchange can defer both). Figures are a year-1 estimate at your 24.0% rate — not tax advice; consult a CPA.
Schools (NCES district)
- District
- Sycamore CUSD 427
- NCES district ID
- 1738460
- Math proficiency
- 26% ▼ -12.00%
- Reading proficiency
- 32% ▼ -13.00%
- Median HH income
- $68,274
- Composite
- 27.1/100
- National rank
- #7041
- State rank
- #234 of 620 in IL
Livability — Sycamore
- Score
- 76/100
- State rank
- #203
- US rank
- #3734
Category grades
Schools grade is shown separately in the Schools card above.
Census & demographics
- Census place
- Sycamore, IL
- County
- DeKalb County · 64,760 people
- City population
- 22,224
- Metro
- Chicago-Naperville-Elgin, IL-IN-WI
- Population (ZIP)
- 22,224
- Household income
- $92,913
- Rent vs Own
- Severe rent burden
- 403.0
Population outlook (DeKalb County) Hauer SSP2
- Today (2025)
- 104,983 people
- By 2030
- 104,428 · -0.5%
- By 2040
- 102,199 · -2.7%
- By 2050
- 99,303 · -5.4%
- By 2075
- 93,978 · -10.5%
- By 2100
- 88,527 · -15.7%
Race, ethnicity, and origin ACS 2023
- Neighborhood character
- Predominantly White (86%)
- Race & ethnicity
- White 86% Hispanic / Latino 9% Two or more races 4% Black 3%
- Hispanic origin (detail)
- Mexican 5% Puerto Rican 2%
- Common ancestry
- Romanian 8% Lithuanian 4% Portuguese 4%
- Foreign-born
- 5% · Canada, Jamaica
- Languages at home
- 93% English-only · Spanish 5% Russian/Polish/Slavic 1%
Political lean MEDSL · DeKalb
- 2024 margin
- Toss-up / Even · D 50.1% · R 48.1% · Other 1.7%
- 2008→2024 swing
- -14.8pp toward R · 2008: 16.8pp · 2024: 2.0pp
- All cycles
- 2024: D+2.0 2020: D+5.7 2016: D+3.0 2012: D+5.5 2008: D+16.8
Not yet ingested
- Civics
- —
Market trends
- HPI YoY
- ▼ -253.78%
- Current HPI
- 187.7932
- Rent YoY
- —
- Metro
- Chicago-Naperville-Elgin, IL-IN-WI
- State GDP YoY
- ▲ 1.59%
- F500 in state
- 60
Industry mix (Fortune 500 HQ in IL)
| Industry | F500 HQs | Revenue |
|---|---|---|
| Insurance | 4 | $201B |
|
||
| Consumer Goods | 4 | $87B |
|
||
| Industrial Machinery | 3 | $64B |
|
||
| Healthcare | 2 | $55B |
|
||
| Retail / Pharmacy | 1 | $148B |
|
||
| Agriculture / Food | 1 | $86B |
|
||
Price history
+94.7% since first listed26 events — show timeline
- 2026-06-15 Listed $175,000 MRED as Distributed by MLS Grid
- 2012-04-23 Sold (MLS) $59,000 MRED as Distributed by MLS Grid
- 2012-04-11 Pending — MRED as Distributed by MLS Grid
- 2012-02-29 Price Changed $68,900 MRED as Distributed by MLS Grid
- 2012-01-10 Price Changed $71,900 MRED as Distributed by MLS Grid
- 2011-12-09 Price Changed $79,900 MRED as Distributed by MLS Grid
- 2011-11-17 Listed $89,900 MRED as Distributed by MLS Grid
- 2011-08-14 Listing Removed — MRED as Distributed by MLS Grid
- 2011-02-18 Price Changed — MRED as Distributed by MLS Grid
- 2010-06-07 Price Changed — MRED as Distributed by MLS Grid
- 2010-05-21 Price Changed — MRED as Distributed by MLS Grid
- 2010-04-19 Price Changed — MRED as Distributed by MLS Grid
- 2010-04-06 Price Changed — MRED as Distributed by MLS Grid
- 2010-03-23 Price Changed — MRED as Distributed by MLS Grid
- 2010-02-22 Price Changed — MRED as Distributed by MLS Grid
- 2010-02-15 Price Changed — MRED as Distributed by MLS Grid
- 2010-02-08 Price Changed — MRED as Distributed by MLS Grid
- 2010-02-01 Price Changed — MRED as Distributed by MLS Grid
- 2009-12-18 Price Changed — MRED as Distributed by MLS Grid
- 2009-10-29 Price Changed — MRED as Distributed by MLS Grid
- 2009-10-01 Price Changed — MRED as Distributed by MLS Grid
- 2009-08-03 Price Changed — MRED as Distributed by MLS Grid
- 2009-06-02 Price Changed — MRED as Distributed by MLS Grid
- 2009-05-08 Price Changed — MRED as Distributed by MLS Grid
- 2009-04-01 Price Changed — MRED as Distributed by MLS Grid
- 2009-02-16 Listed — MRED as Distributed by MLS Grid
Cash-flow waterfall
monthlySold comps — $/sqft
last 12 mo · ≤1 miLoading sold comps…