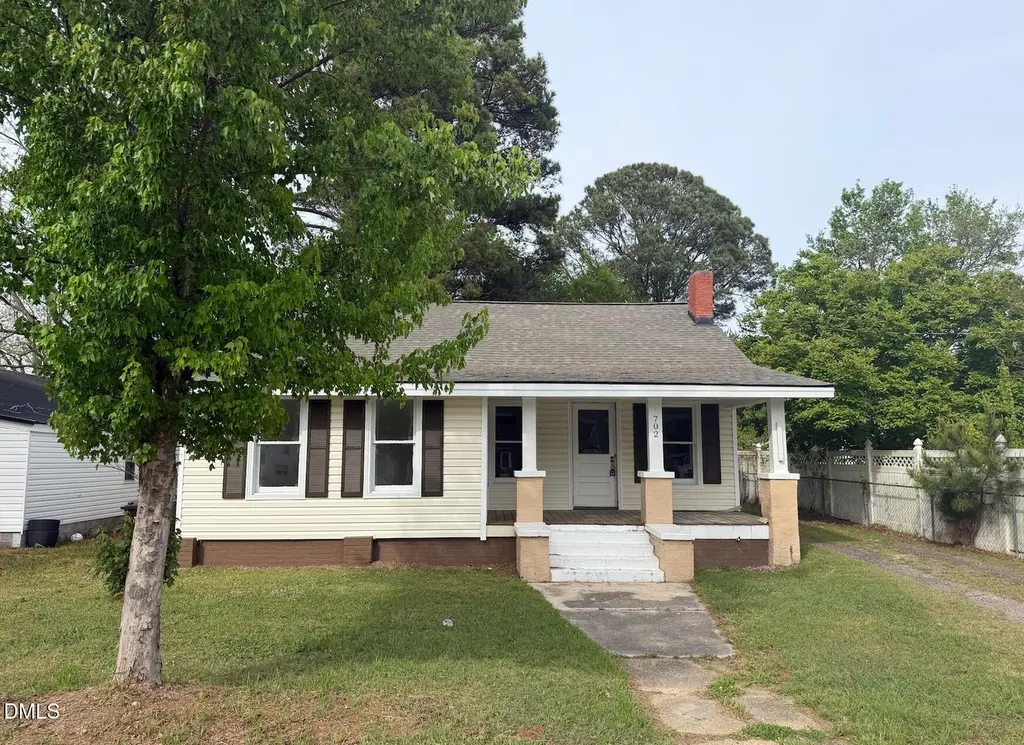
702 W Main St · Benson, NC
Flood risk 1/10 · Minimal
- FEMA flood zone
- X (unshaded)
- Chance of flooding over 30 yrs
- 0.0%
- Est. flood insurance / yr
- $507 – $1,088
Fire risk 3/10 · Minor
- Est. fire insurance / yr
- $906 – $1,684
Heat risk 7/10 · Major
- Hot days now (above 106°F)
- 7 days/yr
- Hot days in 30 yrs
- 17 days/yr
Wind risk 6/10 · Moderate
- Chance of severe wind over 30 yrs
- 73.0%
Air-quality risk 2/10 · Minimal
- Unhealthy air days now
- 1 days/yr
- Unhealthy air days in 30 yrs
- 1 days/yr
Risk factors via First Street. Map © Google.
Why this score? — see what drove the C- grade
The composite is a weighted blend of 9 inputs, each scored 0–100. Each bar is that input's sub-score; the figure is the points it added to the 100-point composite (weight × sub-score).
- Cash flow +16.7/30.0
- ARV discount +15.0/15.0
- DSCR +5.2/10.0
- 1% rule +3.8/10.0
- Schools +3.5/10.0
- Livability +3.4/5.0
- Rent growth +2.5/5.0
- Condition / age +2.5/5.0
- Appreciation +0.0/10.0
$209,900
🖨 Deal sheet (PDF) 📄 Offer letter ✓ Due diligence
Listing remarks
Timeless 1927 Charm Meets Modern Comfort in Historic Benson. Step back in time without sacrificing modern luxury. This stunningly remodeled 1927 bungalow captures the soulful character of the roaring twenties while offering the crisp, clean finishes today's buyers crave. Nestled on a picturesque street in the heart of Historic Benson, this home is a masterclass in ''old world charm meets new world convenience. '' From the moment you step onto the expansive front porch--perfect for morning coffee or evening sunsets--you'll feel the history. Inside, you are greeted by gleaming original hardwood floors that flow seamlessly throughout the entire home. The living room serves as a cozy sanctua
Key facts
- Separate entrance
- 1927 bungalow
- Private home office
Tags
Property features AI
Finance
- Other: Lot size about 0.16 acres
- Financial info: Annual tax listed (for reference)
- HOA & community: No association; Not a senior community
Exterior
- Utilities: Public water; Public sewer
- Home design: Single-story house
- Construction: Vinyl siding; Block and brick/mortar foundation; Shingle roof; Built as a house
- Exterior features: Public maintained road access; Residential zoning
Interior
- Bedrooms: 3 bedrooms (all on the main level)
- Flooring: Wood
- Bathrooms: 2 full bathrooms
- Heating & cooling: Electric heating; Central electric air conditioning
- Interior features: Wood flooring
Neighborhood map
What this means for you Summary
Snapshot
- This is a 3-bed/1.0-bath single-family listed at $210k.
Deal economics
- At list price, monthly cash flow is $131 ($2k/yr) — positive.
- The deal already cash-flows at list — no discount required.
- To meet the 1% rule (rent ≥ 1% of price), the offer needs to be $185k (11.8% below list).
- Recommended offer: $185k (11.8% below list) — sets the bar for 1% rule.
- Cap rate 7.0% vs local median 3.2% in Benson — top-decile yield for the area; either an underpriced asset or a hidden risk that comps aren't pricing in. Stress-test before assuming the spread holds.
Location & tenants
- Location reads 68/100 on livability (#205 in NC) — a middle-class / working-renter tenant base. Strengths: cost of living A+, housing A+, health & safety A+; Watch: crime F, amenities D-, commute F.
- Johnston County Public Schools (rural): math 39% / reading 42% proficiency, ranked #105 of 178 in NC (top 59%) — families likely to look elsewhere, expect single-tenant / working-renter base with shorter leases.
- Zoned schools: Benson Elementary (math 27% / reading 32%, grade F, #975 of 1,410 statewide, top 71%, 608 students, 74% FRL); Benson Middle (math 27% / reading 32%, grade F, #343 of 475 statewide, top 73%, 511 students, 69% FRL); South Johnston High (math 27% / reading 27%, grade F, #468 of 535 statewide, top 88%, 1,331 students, 56% FRL) — zoned schools average 66% FRL vs 41% district-wide (26 pts higher); higher-poverty schools than district average — tighter screening recommended.
- Market conditions: 342 active listings in the ZIP; 2,783 units permitted in Johnston County in 2024 (6 in 5+ unit buildings).
- This rent runs 33% of the median local income ($67k/yr) — at the standard rent-burdened threshold; future hikes will face affordability resistance.
Forward outlook
- Local home prices are declining (-3.0%/yr); year-one equity from $1k of loan paydown is wiped out by about $6k of value loss. Plan a longer hold.
- Johnston County population projected at +37% by 2050 — long-run rental-demand tailwind backs the buy-and-hold thesis.
Negotiation context
- It's been on market 71 days — a 6% lower offer ($197k) is reasonable based on typical stale-listing flexibility.
- 2 sale attempts with the ask held roughly flat each time — persistent listings suggest the price (not the market) is what's stuck; bring a comps-based counter.
- Current owner paid $55k; list at $210k implies a 282% gain — meaningful room to come down on a strong offer.
Risks & watch-outs
- Watch-outs: built in 1927 — expect roof / HVAC / electrical / plumbing capex.
- Climate carrying-cost: major wind risk, 73% chance of damaging wind over 30y; extreme-heat days projected 7→17/yr by 2055 (HVAC capex compounding) — expect insurance premiums to compound above CPI over the hold.
Questions for the listing agent
- It's been on market 71 days. Have you received any prior offers? Is the seller open to a 12% concession, seller financing, or rate buy-down credit?
- Built in 1927 — when were the roof, HVAC, electrical panel, plumbing, and water heater last replaced?
- Why hasn't it sold? Are there any deal-killer items the seller is aware of (foundation, flood, title, zoning, code violations)?
- Is there a deadline driving the sale (1031 exchange, divorce, estate, relocation)? That informs how much negotiation room exists.
- Schools are F-rated, which usually means shorter tenancies and higher turnover. Who's the typical renter profile here, and what's been the actual vacancy rate?
- Crime grade is F in this area — have there been break-ins, vandalism, or insurance claims at this property in the last 3 years? What carrier currently insures it and at what premium?
- What's the average days-on-market for RENTAL listings here right now (not sales)? A rising rental-DOM trend means longer vacancies and softer asking-rent achievability than the comps imply.
- What's the recent tenant-quality profile in this submarket — average credit score on applications, eviction rate, late-payment / NSF rate, and stable-employment percentage? A property-management company in the area should have these aggregated.
- How much new for-sale + rental construction is in the pipeline within 1–3 miles? Heavy new supply typically softens prices + rents 12–24 months out; constrained supply supports both.
Investment metrics
- 1% rule
- 0.88% ✗
- Cap rate
- 7.04%
- Cash-on-cash
- 2.68%
- DSCR
- 1.12
- GRM
- 9.5
CMA / ARV
- ARV (on-the-fly)
- $260,400
- Comps found
- 12
Show comp detail 12 sales within ~0.75 mi
| Address | Dist | Beds/Ba | Sqft | Sold | Price | $/sf | Match |
|---|---|---|---|---|---|---|---|
| 316 W Parrish Dr | 0.32mi | 2/1.0 (-1) | 1,308 (+6%) | 1mo | $299,000 | $229 | 70 |
| 416 W Martin St | 0.24mi | 3/2.0 | 1,360 (+10%) | 4mo | $285,000 | $210 | 65 |
| 303 W Parrish Dr | 0.42mi | 2/1.5 (-1) | 1,281 (+3%) | 5mo | $232,000 | $181 | 64 |
| 451 N Lincoln St | 0.23mi | 3/2.0 | 1,341 (+8%) | 11mo | $295,000 | $220 | 63 |
| 325 W Woodall St | 0.37mi | 3/2.0 | 1,288 (+4%) | 18mo | $279,900 | $217 | 57 |
| 14 Atlantic Ave | 0.68mi | 3/2.0 | 1,300 (+5%) | 6mo | $265,000 | $204 | 52 |
| 202 W Hill St | 0.53mi | 3/2.0 | 1,314 (+6%) | 13mo | $280,000 | $213 | 50 |
| 323 W Harnett St | 0.31mi | 3/2.0 | 1,378 (+11%) | 21mo | $295,000 | $214 | 45 |
| 207 W Brocklyn St | 0.58mi | 3/1.0 | 1,068 (-14%) | 8mo | $105,000 | $98 | 43 |
| 403 S Market St | 0.75mi | 3/1.5 | 1,100 (-11%) | 6mo | $190,000 | $173 | 40 |
| 104 Jj Dr | 0.63mi | 3/2.0 | 1,399 (+13%) | 12mo | $285,000 | $204 | 35 |
| 115 Jj Dr | 0.51mi | 3/2.0 | 1,402 (+13%) | 20mo | $280,000 | $200 | 33 |
Match score weights: distance 35% · size 25% · config 20% · recency 20%. Top-matched comps best support the ARV.
Projected returns pro-forma
-3.0% appreciation · 3.0% rent growth · sell at horizon
- IRR
- -12.1%
- Equity multiple
- 0.56×
- Total profit
- $-25,712
- Equity at exit
- $31,297
- IRR
- -3.0%
- Equity multiple
- 0.80×
- Total profit
- $-11,828
- Equity at exit
- $18,148
Cash invested: $58,772 (down + closing). Projections, not guarantees.
Landlord ↔ Tenant lean methodology
- Overall (STATE)
- 85 Strongly Landlord-Friendly
- State North Carolina
- 85 Strongly Landlord-Friendly · R+3
- County
- — inherits STATE
- City
- — inherits STATE
ZIP-level market 27504
- Home prices YoY
- -14.5%
- Active inventory
- 342
- Price-to-rent
- 9.5×
Monthly cashflow live
- Estimated rent
- $1,850 medium interval (Pro) →
- Mortgage (P&I)
- −$1,101
- Tax from tax record
- −$143 /mo · $1,711/yr
- Insurance
- −$87
- HOA
- −$0
- Vacancy / Maint / Mgmt
- −$389
- Net cashflow
- $131
Break-even live
Sensitivity live
| Price | -10% $250 | -5% $190 | +0% $131 | +5% $72 | +10% $12 |
|---|---|---|---|---|---|
| Rent | -10% $-15 | -5% $58 | +0% $131 | +5% $204 | +10% $277 |
| Rate | -1.0pp $237 | -0.5pp $184 | base $131 | +0.5pp $77 | +1.0pp $21 |
UW: 25.0% down · 7.5% · 30yr · 1.5% tax · 5.0% vac · 8.0% maint · 8.0% mgmt
Financing live
Cash to close
- Down payment
- $52,475
- Closing costs
- $6,297
- Reserves months
- —
- Total cash needed
- —
Loan-product check · same deal, 3 products live
Conventional
25% down · 7.5% · 30yr
- Down + closing
- —
- Monthly P&I
- —
- Monthly cashflow
- —
- DSCR
- —
- Eligible?
- —
Personal DTI + credit; lowest rate.
DSCR
20% down · 8.5% · 30yr
- Down + closing
- —
- Monthly P&I
- —
- Monthly cashflow
- —
- DSCR
- —
- Eligible?
- —
No personal income docs; deal must DSCR.
Hard money
10% down · 12.0% · 12mo
- Down + closing
- —
- Monthly P&I
- —
- Monthly cashflow
- —
- DSCR
- —
- Eligible?
- —
Short-term bridge; refi at stabilization.
Listing history 21 events
-
2026-06-18status $209,900 Pending 71 DOM
-
2026-06-18days on market $209,900 Active 71 DOM
-
2026-06-17days on market $209,900 Active 70 DOM
-
2026-06-16days on market $209,900 Active 69 DOM
-
2026-06-15days on market $209,900 Active 68 DOM
-
2026-06-13days on market $209,900 Active 66 DOM
-
2026-06-13days on market $209,900 Active 65 DOM
-
2026-06-09days on market $209,900 Active 62 DOM
-
2026-06-08days on market $209,900 Active 61 DOM
-
2026-06-07days on market $209,900 Active 60 DOM
-
2026-06-05days on market $209,900 Active 57 DOM
-
2026-06-03days on market $209,900 Active 56 DOM
-
2026-06-02days on market $209,900 Active 55 DOM
-
2026-06-01days on market $209,900 Active 54 DOM
-
2026-05-31days on market $209,900 Active 53 DOM
-
2026-04-29price $209,900
-
2026-04-08$214,900 Active
-
2026-04-04historical
-
2026-02-24price $239,900
-
2025-07-29$249,900 Active
-
1996-07-01soldstatus $55,000
ⓘ Source: listings_history table (triggers on properties + properties_extension) + one-shot
backfill from property_details.listing_events for pre-trigger history.
Tax reassessment forecast NC · Resets to sale price
- Current annual tax
- $1,711 · $143/mo
- Projected year-2 tax
- $1,721 · $143/mo
- Expected delta
- +$11/yr (+$1/mo · 0.6%)
ⓘ Screening estimate from a state-policy table — verify with the county assessor before closing.
Climate risk First Street
- Flood 1/10 Low FEMA zone X (unshaded) · 0% chance over 30 yrs
- Wildfire 3/10 Moderate
- Heat 7/10 Severe 7 d/yr ≥106°F today · 17 d/yr by 30 yrs out
- Wind 6/10 Major 73% chance of damaging wind over 30 yrs
- Air quality 2/10 Low 1 unhealthy d/yr today · 1 by 30 yrs out
Nearby sold comps map
Loading sold comps map…
Walkable amenities ~0.75 mi
Loading nearby amenities…
Taxation est. · year 1
- Rental income
- $22,204
- − Mortgage interest
- −$11,758
- − Property taxes
- −$1,711
- − Insurance
- −$1,050
- − Repairs & maintenance
- −$1,776
- − Management
- −$1,776
- − Depreciation
- −$6,106
- Taxable loss
- −$1,972
- Est. tax savings @ 24.0%
- +$473
- After-tax cash flow
- $2,046/yr
For passive investors: Depreciation is non-cash, so a rental often shows a tax loss while cash-flowing — sheltering income. Rental losses are passive: they offset passive income freely, and up to $25,000/yr can offset ordinary (W-2) income if you actively participate and your MAGI is under $100k (phasing out to $0 by $150k); unused losses carry forward. On sale, claimed depreciation is recaptured at up to 25%, and gains may owe capital-gains tax (a 1031 exchange can defer both). Figures are a year-1 estimate at your 24.0% rate — not tax advice; consult a CPA.
Schools (NCES district)
- District
- Johnston County Public Schools
- NCES district ID
- 3702370
- Math proficiency
- 39% ▲ 4.00%
- Reading proficiency
- 42% ▲ 2.00%
- Median HH income
- $50,912
- Composite
- 34.99/100
- National rank
- #5052
- State rank
- #105 of 178 in NC
Livability — Benson
- Score
- 68/100
- State rank
- #205
- US rank
- #9985
Category grades
Schools grade is shown separately in the Schools card above.
Census & demographics
- Census place
- Benson, NC
- County
- Johnston County · 175,441 people
- City population
- 17,079
- Metro
- Raleigh-Cary, NC
- Population (ZIP)
- 17,079
- Household income
- $66,724
- Rent vs Own
- Severe rent burden
- 554.0
Population outlook (Johnston County) Hauer SSP2
- Today (2025)
- 222,440 people
- By 2030
- 240,227 · +8.0%
- By 2040
- 274,616 · +23.5%
- By 2050
- 304,915 · +37.1%
- By 2075
- 369,507 · +66.1%
- By 2100
- 406,280 · +82.6%
Race, ethnicity, and origin ACS 2023
- Neighborhood character
- Predominantly White (65%)
- Race & ethnicity
- White 65% Hispanic / Latino 16% Black 15% Two or more races 10%
- Hispanic origin (detail)
- Mexican 13% Puerto Rican 2%
- Common ancestry
- Serbian 2% Slovak 2% Lithuanian 2%
- Foreign-born
- 6% · Canada
- Languages at home
- 85% English-only · Spanish 15%
Political lean MEDSL · Johnston
- 2024 margin
- Strong R (+21.5) · D 38.7% · R 60.2% · Other 1.1%
- 2008→2024 swing
- +2.2pp toward D · 2008: -23.7pp · 2024: -21.5pp
- All cycles
- 2024: R+21.5 2020: R+24.3 2016: R+30.7 2012: R+27.8 2008: R+23.7
Not yet ingested
- Civics
- —
Market trends
- HPI YoY
- ▼ -42.79%
- Current HPI
- 252.3984
- Rent YoY
- —
- Metro
- Raleigh-Cary, NC
- State GDP YoY
- ▲ 3.28%
- F500 in state
- 26
Industry mix (Fortune 500 HQ in NC)
| Industry | F500 HQs | Revenue |
|---|---|---|
| Financial Services | 2 | $213B |
|
||
| Retail | 2 | $95B |
|
||
| Industrial Conglomerate | 1 | $38B |
|
||
| Metals / Steel | 1 | $35B |
|
||
| Utilities | 1 | $30B |
|
||
| Industrial Machinery | 1 | $19B |
|
||
Price history
+281.6% since first listed6 events — show timeline
- 2026-04-29 Price Changed $209,900 TMLS
- 2026-04-08 Listed $214,900 TMLS
- 2026-04-04 Listing Removed — TMLS
- 2026-02-24 Price Changed $239,900 TMLS
- 2025-07-29 Listed $249,900 TMLS
- 1996-07-01 Sold (Public Records) $55,000 Public Records
Property tax history
+4.8%/yrLatest (2025): $1,711 · +55.4% YoY. Source: county tax records.
Cash-flow waterfall
monthlySold comps — $/sqft
last 12 mo · ≤1 miLoading sold comps…