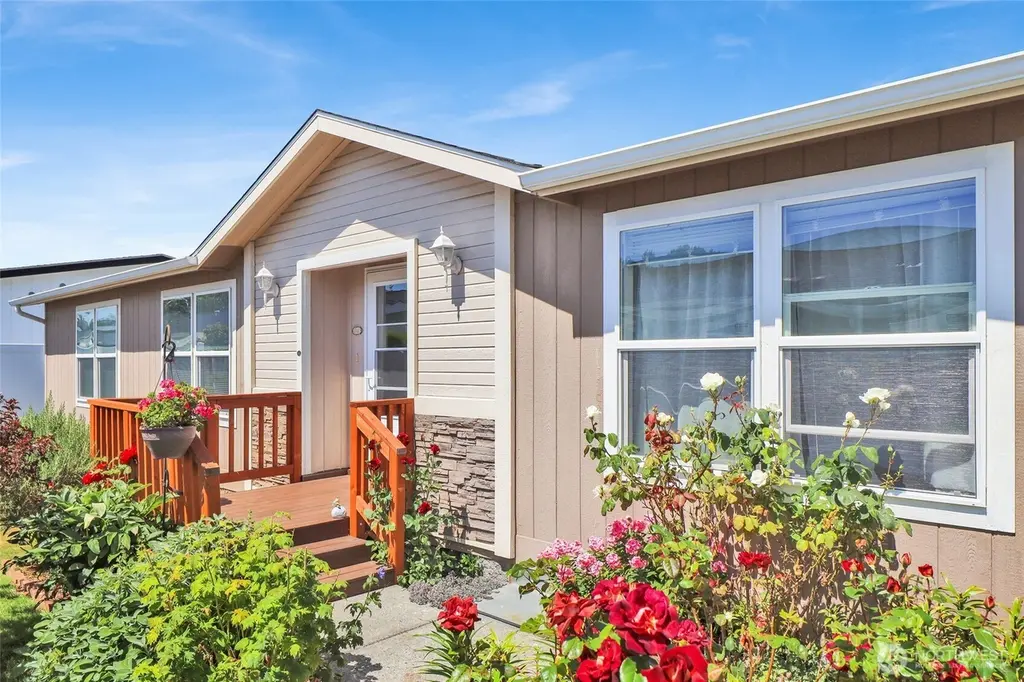
6350 Portal Way #64 · Ferndale, WA
Flood risk 1/10 · Minimal
- FEMA flood zone
- X (unshaded)
- Chance of flooding over 30 yrs
- 0.0%
- Est. flood insurance / yr
- $507 – $1,088
Fire risk 2/10 · Minimal
- Est. fire insurance / yr
- $604 – $1,122
Heat risk 3/10 · Minor
- Hot days now (above 82°F)
- 7 days/yr
- Hot days in 30 yrs
- 18 days/yr
Wind risk 1/10 · Minimal
- Chance of severe wind over 30 yrs
- —
Air-quality risk 6/10 · Moderate
- Unhealthy air days now
- 10 days/yr
- Unhealthy air days in 30 yrs
- 11 days/yr
Risk factors via First Street. Map © Google.
Why this score? — see what drove the D- grade
The composite is a weighted blend of 9 inputs, each scored 0–100. Each bar is that input's sub-score; the figure is the points it added to the 100-point composite (weight × sub-score).
- Cash flow +14.5/30.0
- Schools +4.6/10.0
- DSCR +4.4/10.0
- 1% rule +4.0/10.0
- Livability +4.0/5.0
- Rent growth +3.7/5.0
- Condition / age +2.5/5.0
- ARV discount +0.0/15.0
- Appreciation +0.0/10.0
$294,000
🖨 Deal sheet (PDF) 📄 Offer letter ✓ Due diligence
Listing remarks
Welcome to this meticulously maintained home in the desirable Portal Creek 55+ Community. Offering 3 bedrooms and 2 full baths, the open layout boasts vaulted ceilings and abundant natural light. A cozy wood-burning fireplace warms the spacious living room, while the kitchen features stainless appliances. Step outside to a fully fenced backyard with patio, perfect for pets, entertaining, or morning coffee, surrounded by low-maintenance landscaping, mature trees, and gardens. Additional highlights include a 2-car garage, brand-new water heater, and new roof installed Sept. 2025. Residents enjoy a quiet, well-kept neighborhood with a clubhouse, just 10 minutes to Bellingham and close to shopp
Key facts
- Clubhouse
- Stainless appliances
- Mature trees
Tags
Neighborhood map
What this means for you Summary
Snapshot
- This is a 3-bed/2.0-bath manufactured listed at $294k.
Deal economics
- At list price, monthly cash flow is $66 ($792/yr) — positive.
- The deal already cash-flows at list — no discount required.
- To meet the 1% rule (rent ≥ 1% of price), the offer needs to be $266k (9.7% below list).
- Recommended offer: $266k (9.7% below list) — sets the bar for 1% rule.
- Cap rate 6.6% vs local median 2.5% in Ferndale — top-decile yield for the area; either an underpriced asset or a hidden risk that comps aren't pricing in. Stress-test before assuming the spread holds.
Location & tenants
- Location reads 81/100 on livability (#79 in WA, #1,471 nationally) — a professional / high-income tenant draw. Strengths: commute A+, health & safety A+, housing A; Watch: amenities F, cost of living D-.
- Ferndale School District (suburban): math 43% / reading 58% proficiency, ranked #138 of 291 in WA (top 47%) — acceptable for families but not a draw, mixed tenant base, ~2y average lease.
- Market conditions: Rents rising fast (+4.8%/yr); 230 active listings in the ZIP; 2 comparable units currently listed for rent nearby; solid renter incomes; 1,190 units permitted in Whatcom County in 2024 (327 in 5+ unit buildings).
- This rent runs 35% of the median local income ($91k/yr) — at the standard rent-burdened threshold; future hikes will face affordability resistance.
Forward outlook
- Local home prices are declining (-3.0%/yr); year-one equity from $2k of loan paydown is wiped out by about $9k of value loss. Plan a longer hold.
- Whatcom County population projected at +28% by 2050 — long-run rental-demand tailwind backs the buy-and-hold thesis.
Negotiation context
- It's been on market 108 days — a 9% lower offer ($268k) is reasonable based on typical stale-listing flexibility.
- 2 sale attempts since 15y ago with the ask held roughly flat each time — persistent listings suggest the price (not the market) is what's stuck; bring a comps-based counter.
- Current owner paid $85k; list at $294k implies a 246% gain — meaningful room to come down on a strong offer.
Questions for the listing agent
- It's been on market 108 days. Have you received any prior offers? Is the seller open to a 10% concession, seller financing, or rate buy-down credit?
- Why hasn't it sold? Are there any deal-killer items the seller is aware of (foundation, flood, title, zoning, code violations)?
- Is there a deadline driving the sale (1031 exchange, divorce, estate, relocation)? That informs how much negotiation room exists.
- Schools are B-rated — typically a magnet for longer-tenancy family renters. What's the average tenant stay here, and is there a school-zone premium baked into asking?
- The area grade is low — what's the realistic commute time and amenity access for the typical tenant pool here? Any planned neighborhood developments (good or bad) we should know about?
- What's the average days-on-market for RENTAL listings here right now (not sales)? A rising rental-DOM trend means longer vacancies and softer asking-rent achievability than the comps imply.
- What's the recent tenant-quality profile in this submarket — average credit score on applications, eviction rate, late-payment / NSF rate, and stable-employment percentage? A property-management company in the area should have these aggregated.
- How much new for-sale + rental construction is in the pipeline within 1–3 miles? Heavy new supply typically softens prices + rents 12–24 months out; constrained supply supports both.
Investment metrics
- 1% rule
- 0.90% ✗
- Cap rate
- 6.56%
- Cash-on-cash
- 0.96%
- DSCR
- 1.04
- GRM
- 9.2
CMA / ARV
- ARV (median comp)
- $236,320
- List price
- $294,000
- Delta
- 24.41%
- Verdict
- OVERPRICED
- Comps
- 4 within 1.0 mi
Show comp detail 4 sales within ~0.75 mi
| Address | Dist | Beds/Ba | Sqft | Sold | Price | $/sf | Match |
|---|---|---|---|---|---|---|---|
| 6350 Portal Way #13 | 0.09mi | 3/2.0 | 1,404 (+1%) | 0mo | $315,000 | $224 | 95 |
| 6350 Portal Way #83 | 0.04mi | 3/2.0 | 1,596 (+14%) | 7mo | $365,000 | $229 | 68 |
| 6350 Portal Way #6 | 0.13mi | 2/2.0 (-1) | 1,319 (-5%) | 22mo | $315,000 | $239 | 62 |
| 6350 Portal Way #26 | 0.14mi | 3/2.0 | 1,188 (-15%) | 21mo | $280,000 | $236 | 51 |
Match score weights: distance 35% · size 25% · config 20% · recency 20%. Top-matched comps best support the ARV.
Projected returns pro-forma
-3.0% appreciation · 4.79% rent growth · sell at horizon
- IRR
- -12.8%
- Equity multiple
- 0.53×
- Total profit
- $-38,530
- Equity at exit
- $43,836
- IRR
- -1.2%
- Equity multiple
- 0.91×
- Total profit
- $-7,258
- Equity at exit
- $25,420
Cash invested: $82,320 (down + closing). Projections, not guarantees.
Landlord ↔ Tenant lean methodology
- Overall (STATE)
- 28 Tenant-Leaning
- State Washington
- 28 Tenant-Leaning · D+8
- County
- — inherits STATE
- City
- — inherits STATE
ZIP-level market 98248
- Rents YoY
- 4.8%
- Active inventory
- 230
- Price-to-rent
- 9.2×
Monthly cashflow live
- Estimated rent
- $2,655 medium interval (Pro) →
- Mortgage (P&I)
- −$1,542
- Tax est. 1.5%
- −$368 /mo · $4,410/yr
- Insurance
- −$122
- HOA
- −$0
- Vacancy / Maint / Mgmt
- −$558
- Net cashflow
- $66
Break-even live
Sensitivity live
| Price | -10% $269 | -5% $168 | +0% $66 | +5% $-36 | +10% $-137 |
|---|---|---|---|---|---|
| Rent | -10% $-144 | -5% $-39 | +0% $66 | +5% $171 | +10% $276 |
| Rate | -1.0pp $214 | -0.5pp $141 | base $66 | +0.5pp $-10 | +1.0pp $-88 |
UW: 25.0% down · 7.5% · 30yr · 1.5% tax · 5.0% vac · 8.0% maint · 8.0% mgmt
Financing live
Cash to close
- Down payment
- $73,500
- Closing costs
- $8,820
- Reserves months
- —
- Total cash needed
- —
Loan-product check · same deal, 3 products live
Conventional
25% down · 7.5% · 30yr
- Down + closing
- —
- Monthly P&I
- —
- Monthly cashflow
- —
- DSCR
- —
- Eligible?
- —
Personal DTI + credit; lowest rate.
DSCR
20% down · 8.5% · 30yr
- Down + closing
- —
- Monthly P&I
- —
- Monthly cashflow
- —
- DSCR
- —
- Eligible?
- —
No personal income docs; deal must DSCR.
Hard money
10% down · 12.0% · 12mo
- Down + closing
- —
- Monthly P&I
- —
- Monthly cashflow
- —
- DSCR
- —
- Eligible?
- —
Short-term bridge; refi at stabilization.
Rent comps 2 comps
| Address | Beds | Baths | Sqft | Rent | $/sqft | DOM | Units | Dist |
|---|---|---|---|---|---|---|---|---|
| 2274 Thornton St Ferndale, WA | 3.0 | 1.0 | 1100 | $2,500 | $2.27 | 14d | 1 | 1.31mi |
| 6160 Jupiter Pl Ferndale, WA | 4.0 | 1.0 | 1275 | $2,675 | $2.10 | 44d | 1 | 1.49mi |
Listing history 21 events
-
2026-06-18days on market $294,000 Active 108 DOM
-
2026-06-17days on market $294,000 Active 107 DOM
-
2026-06-16days on market $294,000 Active 106 DOM
-
2026-06-15days on market $294,000 Active 105 DOM
-
2026-06-14days on market $294,000 Active 103 DOM
-
2026-06-13days on market $294,000 Active 102 DOM
-
2026-06-10days on market $294,000 Active 100 DOM
-
2026-06-09days on market $294,000 Active 99 DOM
-
2026-06-08days on market $294,000 Active 98 DOM
-
2026-06-07days on market $294,000 Active 97 DOM
-
2026-06-03days on market $294,000 Active 93 DOM
-
2026-06-03price $294,000 Active 92 DOM
-
2026-06-02days on market $299,000 Active 92 DOM
-
2026-06-01days on market $299,000 Active 91 DOM
-
2026-05-31days on market $299,000 Active 90 DOM
-
2026-05-30days on market $299,000 Active 89 DOM
-
2026-03-02$299,000 Active
-
2011-10-27soldstatus $84,900 Sold
-
2011-10-14status Pending
-
2011-10-10price $84,900
-
2011-09-20$98,500 Active
ⓘ Source: listings_history table (triggers on properties + properties_extension) + one-shot
backfill from property_details.listing_events for pre-trigger history.
Climate risk First Street
- Flood 1/10 Low FEMA zone X (unshaded) · 0% chance over 30 yrs
- Wildfire 2/10 Low
- Heat 3/10 Moderate 7 d/yr ≥82°F today · 18 d/yr by 30 yrs out
- Wind 1/10 Low
- Air quality 6/10 Major 10 unhealthy d/yr today · 11 by 30 yrs out
Nearby sold comps map
Loading sold comps map…
Walkable amenities ~0.75 mi
Loading nearby amenities…
Taxation est. · year 1
- Rental income
- $31,865
- − Mortgage interest
- −$16,469
- − Property taxes
- −$4,410
- − Insurance
- −$1,470
- − Repairs & maintenance
- −$2,549
- − Management
- −$2,549
- − Depreciation
- −$8,553
- Taxable loss
- −$4,135
- Est. tax savings @ 24.0%
- +$992
- After-tax cash flow
- $1,784/yr
For passive investors: Depreciation is non-cash, so a rental often shows a tax loss while cash-flowing — sheltering income. Rental losses are passive: they offset passive income freely, and up to $25,000/yr can offset ordinary (W-2) income if you actively participate and your MAGI is under $100k (phasing out to $0 by $150k); unused losses carry forward. On sale, claimed depreciation is recaptured at up to 25%, and gains may owe capital-gains tax (a 1031 exchange can defer both). Figures are a year-1 estimate at your 24.0% rate — not tax advice; consult a CPA.
Schools (NCES district)
- District
- Ferndale School District
- NCES district ID
- 5302850
- Math proficiency
- 43% ▲ 1.00%
- Reading proficiency
- 58% ▲ 4.00%
- Median HH income
- $59,413
- Composite
- 46.06/100
- National rank
- #5494
- State rank
- #138 of 291 in WA
Livability — Ferndale
- Score
- 81/100
- State rank
- #79
- US rank
- #1471
Category grades
Schools grade is shown separately in the Schools card above.
Census & demographics
- Census place
- Ferndale, WA
- County
- Whatcom County · 209,776 people
- City population
- 28,498
- Metro
- Bellingham, WA
- Population (ZIP)
- 28,498
- Household income
- $91,060
- Rent vs Own
- Severe rent burden
- 582.0
Population outlook (Whatcom County) Hauer SSP2
- Today (2025)
- 240,408 people
- By 2030
- 254,667 · +5.9%
- By 2040
- 281,365 · +17.0%
- By 2050
- 307,592 · +27.9%
- By 2075
- 375,576 · +56.2%
- By 2100
- 421,637 · +75.4%
Race, ethnicity, and origin ACS 2023
- Neighborhood character
- Predominantly White (75%)
- Race & ethnicity
- White 75% Hispanic / Latino 11% Two or more races 8% Asian 6% Native American 2%
- Hispanic origin (detail)
- Mexican 7%
- Common ancestry
- Iranian 5% Portuguese 4% Italian 4%
- Foreign-born
- 12% · Canada, China
- Languages at home
- 83% English-only · Spanish 6% Other Indo-European 5% Russian/Polish/Slavic 3%
Political lean MEDSL · Whatcom
- 2024 margin
- Strong D (+24.9) · D 60.8% · R 35.9% · Other 3.3%
- 2008→2024 swing
- +6.9pp toward D · 2008: 18.0pp · 2024: 24.9pp
- All cycles
- 2024: D+24.9 2020: D+23.9 2016: D+17.7 2012: D+12.1 2008: D+18.0
Not yet ingested
- Civics
- —
Market trends
- HPI YoY
- ▼ -427.43%
- Current HPI
- 407.6077
- Rent YoY
- ▲ 4.79%
- Metro
- Bellingham, WA
- State GDP YoY
- ▲ 4.65%
- F500 in state
- 22
Industry mix (Fortune 500 HQ in WA)
| Industry | F500 HQs | Revenue |
|---|---|---|
| Retail | 2 | $269B |
|
||
| Technology / Retail | 1 | $638B |
|
||
| Technology | 1 | $245B |
|
||
| Telecommunications | 1 | $38B |
|
||
| Food / Beverage | 1 | $36B |
|
||
| Automotive / Trucks | 1 | $34B |
|
||
Price history
+203.6% since first listed5 events — show timeline
- 2026-03-02 Listed $299,000 NWMLS as Distributed by MLS Grid
- 2011-10-27 Sold (MLS) $84,900 NWMLS as Distributed by MLS Grid
- 2011-10-14 Pending — NWMLS as Distributed by MLS Grid
- 2011-10-10 Price Changed $84,900 NWMLS as Distributed by MLS Grid
- 2011-09-20 Listed $98,500 NWMLS as Distributed by MLS Grid
Property tax history
-7.8%/yrLatest (2026): $253 · +13.2% YoY. Source: county tax records.
Cash-flow waterfall
monthlySold comps — $/sqft
last 12 mo · ≤1 miLoading sold comps…