1132 Grant 53 · East End, AR
Flood risk 1/10 · Minimal
- FEMA flood zone
- X (unshaded)
- Chance of flooding over 30 yrs
- 0.0%
- Est. flood insurance / yr
- $507 – $1,088
Fire risk 6/10 · Moderate
- Est. fire insurance / yr
- $1,499 – $2,785
Heat risk 6/10 · Moderate
- Hot days now (above 110°F)
- 7 days/yr
- Hot days in 30 yrs
- 20 days/yr
Wind risk 4/10 · Minor
- Chance of severe wind over 30 yrs
- 17.0%
Air-quality risk 1/10 · Minimal
- Unhealthy air days now
- 0 days/yr
- Unhealthy air days in 30 yrs
- 0 days/yr
Risk factors via First Street. Map © Google.
Why this score? — see what drove the D- grade
The composite is a weighted blend of 9 inputs, each scored 0–100. Each bar is that input's sub-score; the figure is the points it added to the 100-point composite (weight × sub-score).
- ARV discount +15.0/15.0
- Cash flow +8.1/30.0
- Schools +3.2/10.0
- Livability +3.1/5.0
- 1% rule +2.5/10.0
- Rent growth +2.5/5.0
- Condition / age +2.5/5.0
- DSCR +2.2/10.0
- Appreciation +0.0/10.0
$159,900
🖨 Deal sheet (PDF) 📄 Offer letter ✓ Due diligence
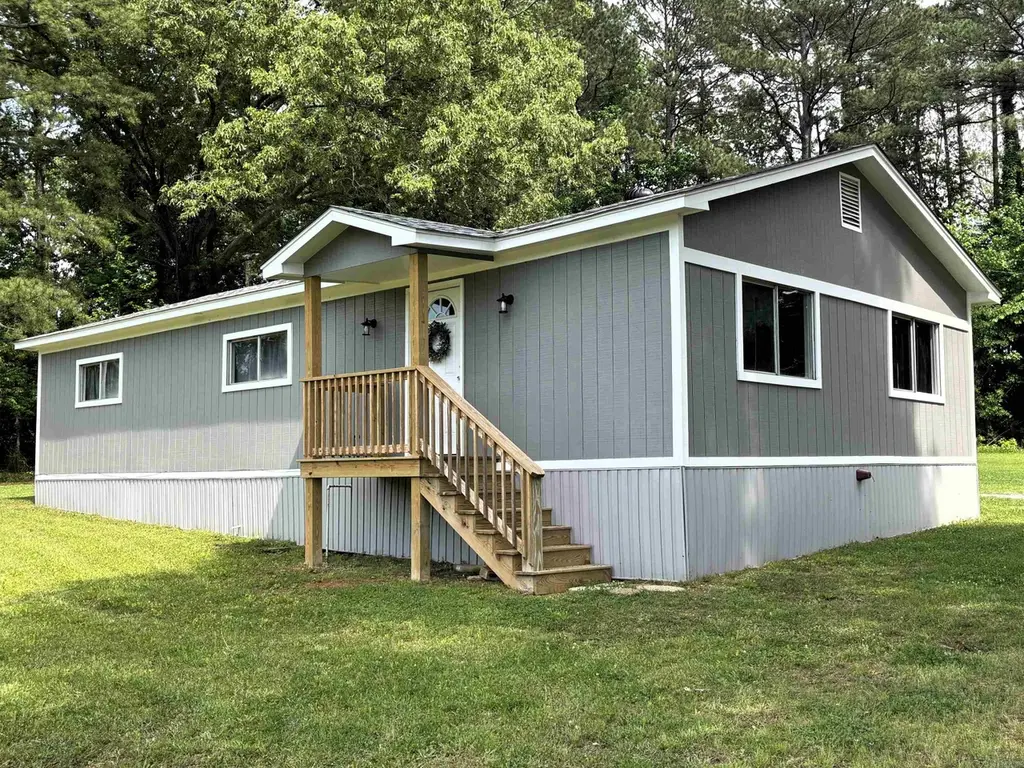
Listing remarks
Beautifully renovated home in a great location—perfect for a family! The owner has taken this property down to the studs and completely transformed it with quality upgrades throughout. Age of trailer is unknown, but it was entirely redone in 2025. Features include new plumbing, roof, HVAC system, electrical, LVP flooring, cabinets, and more. This home is truly move-in ready and offers a spacious yard with room for a garden. No restrictions provide added flexibility. The home is all-electric, with natural gas available if desired. Important: This property does not qualify for traditional 30-year financing options such as VA, FHA, or RD loans. Buyer will need 15%-20% amortized for 15
Key facts
- Renovated home
- New plumbing
- Quality upgrades
Tags
Property features AI
Finance
- Other: Approximately 1.44 acres (surveyed)
- Financial info: Financing options: Conventional loan or cash
- HOA & community: Termite contract
Exterior
- Utilities: Public water; Septic
- Home design: Modular double-wide home; Paved road access
- Construction: Wood exterior; Architectural shingle roof; Crawl space foundation; Built using measured square footage
- Exterior features: Deck; Level, cleared lot
Interior
- Kitchen: Electric range; Refrigerator stays
- Flooring: Luxury vinyl
- Bathrooms: 2 full bathrooms
- Heating & cooling: Central electric heating; Central electric cooling
- Interior features: Luxury vinyl floors; Sheetrock walls and ceilings
- Laundry & utility: Laundry room
Neighborhood map
What this means for you Summary
Snapshot
- This is a 3-bed/2.0-bath single-family listed at $160k.
Deal economics
- At list price, monthly cash flow is $-153 ($-2k/yr) — negative.
- To cash-flow at today's rent, offer at most $138k (13.9% below list).
- To meet the 1% rule (rent ≥ 1% of price), the offer needs to be $120k (24.7% below list).
- Recommended offer: $120k (24.7% below list) — sets the bar for 1% rule.
- Cap rate 5.1% vs local median 3.3% in East End — top-decile yield for the area; either an underpriced asset or a hidden risk that comps aren't pricing in. Stress-test before assuming the spread holds.
Location & tenants
- Location reads 62/100 on livability (#210 in AR) — a middle-class / working-renter tenant base. Strengths: cost of living A+, housing A+, employment B+; Watch: schools F, amenities F, commute F.
- Sheridan School District (town): math 36% / reading 38% proficiency, ranked #89 of 238 in AR (top 37%) — families likely to look elsewhere, expect single-tenant / working-renter base with shorter leases.
- Market conditions: 137 active listings in the ZIP; 28 units permitted in Grant County in 2024 (0 in 5+ unit buildings).
Forward outlook
- Local home prices are declining (-3.0%/yr); year-one equity from $1k of loan paydown is wiped out by about $5k of value loss. Plan a longer hold.
- Grant County population projected to shrink 3% by 2050 — rents likely to lag national; underwrite the cash flow, not the appreciation.
Negotiation context
- It's been on market 42 days — a 3% lower offer ($155k) is reasonable based on typical stale-listing flexibility.
- 3 sale attempts; this cycle's ask is 12200% above the opening price — seller raised mid-cycle; expect resistance to lowballs.
Risks & watch-outs
- Climate carrying-cost: major wildfire risk; extreme-heat days projected 7→20/yr by 2055 (HVAC capex compounding) — expect insurance premiums to compound above CPI over the hold.
Questions for the listing agent
- What do current leases actually rent for vs. the listed asking? Can we see a recent rent roll and the last 12 months of T-12 income?
- It's been on market 42 days. Have you received any prior offers? Is the seller open to a 25% concession, seller financing, or rate buy-down credit?
- Is there a deadline driving the sale (1031 exchange, divorce, estate, relocation)? That informs how much negotiation room exists.
- Schools are F-rated, which usually means shorter tenancies and higher turnover. Who's the typical renter profile here, and what's been the actual vacancy rate?
- The area grade is low — what's the realistic commute time and amenity access for the typical tenant pool here? Any planned neighborhood developments (good or bad) we should know about?
- What's the average days-on-market for RENTAL listings here right now (not sales)? A rising rental-DOM trend means longer vacancies and softer asking-rent achievability than the comps imply.
- What's the recent tenant-quality profile in this submarket — average credit score on applications, eviction rate, late-payment / NSF rate, and stable-employment percentage? A property-management company in the area should have these aggregated.
- How much new for-sale + rental construction is in the pipeline within 1–3 miles? Heavy new supply typically softens prices + rents 12–24 months out; constrained supply supports both.
Investment metrics
- 1% rule
- 0.75% ✗
- Cap rate
- 5.14%
- Cash-on-cash
- -4.11%
- DSCR
- 0.82
- GRM
- 11.1
CMA / ARV
- ARV (median comp)
- $261,552
- List price
- $159,900
- Delta
- -38.86%
- Verdict
- UNDERPRICED
- Comps
- 6 within 1.0 mi
Projected returns pro-forma
-3.0% appreciation · 3.0% rent growth · sell at horizon
- IRR
- -23.2%
- Equity multiple
- 0.20×
- Total profit
- $-35,666
- Equity at exit
- $23,842
- IRR
- -17.8%
- Equity multiple
- 0.03×
- Total profit
- $-43,568
- Equity at exit
- $13,825
Cash invested: $44,772 (down + closing). Projections, not guarantees.
Landlord ↔ Tenant lean methodology
- Overall (STATE)
- 92 Strongly Landlord-Friendly
- State Arkansas
- 92 Strongly Landlord-Friendly · R+14
- County
- — inherits STATE
- City
- — inherits STATE
ZIP-level market 72150
- Home prices YoY
- -18.1%
- Active inventory
- 137
- Price-to-rent
- 11.1×
Monthly cashflow live
- Estimated rent
- $1,205 medium interval (Pro) →
- Mortgage (P&I)
- −$839
- Tax est. 1.5%
- −$200 /mo · $2,398/yr
- Insurance
- −$67
- HOA
- −$0
- Vacancy / Maint / Mgmt
- −$253
- Net cashflow
- $-153
Break-even live
Sensitivity live
| Price | -10% $-43 | -5% $-98 | +0% $-153 | +5% $-209 | +10% $-264 |
|---|---|---|---|---|---|
| Rent | -10% $-249 | -5% $-201 | +0% $-153 | +5% $-106 | +10% $-58 |
| Rate | -1.0pp $-73 | -0.5pp $-113 | base $-153 | +0.5pp $-195 | +1.0pp $-237 |
UW: 25.0% down · 7.5% · 30yr · 1.5% tax · 5.0% vac · 8.0% maint · 8.0% mgmt
Financing live
Cash to close
- Down payment
- $39,975
- Closing costs
- $4,797
- Reserves months
- —
- Total cash needed
- —
Loan-product check · same deal, 3 products live
Conventional
25% down · 7.5% · 30yr
- Down + closing
- —
- Monthly P&I
- —
- Monthly cashflow
- —
- DSCR
- —
- Eligible?
- —
Personal DTI + credit; lowest rate.
DSCR
20% down · 8.5% · 30yr
- Down + closing
- —
- Monthly P&I
- —
- Monthly cashflow
- —
- DSCR
- —
- Eligible?
- —
No personal income docs; deal must DSCR.
Hard money
10% down · 12.0% · 12mo
- Down + closing
- —
- Monthly P&I
- —
- Monthly cashflow
- —
- DSCR
- —
- Eligible?
- —
Short-term bridge; refi at stabilization.
Listing history 15 events
-
2026-06-15days on market $159,900 Active 42 DOM
-
2026-06-14days on market $159,900 Active 40 DOM
-
2026-06-10days on market $159,900 Active 37 DOM
-
2026-06-09days on market $159,900 Active 36 DOM
-
2026-06-08days on market $159,900 Active 35 DOM
-
2026-06-07days on market $159,900 Active 34 DOM
-
2026-06-05days on market $159,900 Active 31 DOM
-
2026-06-03days on market $159,900 Active 30 DOM
-
2026-06-02days on market $159,900 Active 29 DOM
-
2026-06-01days on market $159,900 Active 28 DOM
-
2026-05-31days on market $159,900 Active 27 DOM
-
2026-05-31days on market $159,900 Active 26 DOM
-
2026-05-04$159,900 New Listing 755-char remark
-
2025-07-02historical $1,300
-
2025-06-19$1,300
ⓘ Source: listings_history table (triggers on properties + properties_extension) + one-shot
backfill from property_details.listing_events for pre-trigger history.
Climate risk First Street
- Flood 1/10 Low FEMA zone X (unshaded) · 0% chance over 30 yrs
- Wildfire 6/10 Major
- Heat 6/10 Major 7 d/yr ≥110°F today · 20 d/yr by 30 yrs out
- Wind 4/10 Moderate 17% chance of damaging wind over 30 yrs
- Air quality 1/10 Low 0 unhealthy d/yr today · 0 by 30 yrs out
Nearby sold comps map
Loading sold comps map…
Walkable amenities ~0.75 mi
Loading nearby amenities…
Taxation est. · year 1
- Rental income
- $14,454
- − Mortgage interest
- −$8,957
- − Property taxes
- −$2,398
- − Insurance
- −$800
- − Repairs & maintenance
- −$1,156
- − Management
- −$1,156
- − Depreciation
- −$4,652
- Taxable loss
- −$4,665
- Est. tax savings @ 24.0%
- +$1,120
- After-tax cash flow
- $-722/yr
For passive investors: Depreciation is non-cash, so a rental often shows a tax loss while cash-flowing — sheltering income. Rental losses are passive: they offset passive income freely, and up to $25,000/yr can offset ordinary (W-2) income if you actively participate and your MAGI is under $100k (phasing out to $0 by $150k); unused losses carry forward. On sale, claimed depreciation is recaptured at up to 25%, and gains may owe capital-gains tax (a 1031 exchange can defer both). Figures are a year-1 estimate at your 24.0% rate — not tax advice; consult a CPA.
Schools (NCES district)
- District
- Sheridan School District
- NCES district ID
- 0500015
- Math proficiency
- 36% ▼ -16.00%
- Reading proficiency
- 38% ▼ -9.00%
- Median HH income
- $49,974
- Composite
- 32.0/100
- National rank
- #5831
- State rank
- #89 of 238 in AR
Livability — East End
- Score
- 62/100
- State rank
- #210
- US rank
- #16307
Category grades
Schools grade is shown separately in the Schools card above.
Census & demographics
- Population (ZIP)
- 12,476
Population outlook (Grant County) Hauer SSP2
- Today (2025)
- 18,477 people
- By 2030
- 18,551 · +0.4%
- By 2040
- 18,442 · -0.2%
- By 2050
- 17,901 · -3.1%
- By 2075
- 16,240 · -12.1%
- By 2100
- 13,761 · -25.5%
Race, ethnicity, and origin ACS 2023
- Neighborhood character
- Predominantly White (91%)
- Race & ethnicity
- White 91% Two or more races 5% Hispanic / Latino 3% Black 2%
- Common ancestry
- Lithuanian 1% Iranian 1% Serbian 1%
- Foreign-born
- 1% · Canada, China
- Languages at home
- 99% English-only · Spanish 1%
Political lean MEDSL · Grant
- 2024 margin
- Solid R (+68.9) · D 14.8% · R 83.6% · Other 1.6%
- 2008→2024 swing
- -17.9pp toward R · 2008: -51.0pp · 2024: -68.9pp
- All cycles
- 2024: R+68.9 2020: R+67.4 2016: R+54.7 2012: R+51.9 2008: R+51.0
Not yet ingested
- Civics
- —
Market trends
- HPI YoY
- ▼ -37.06%
- Current HPI
- 167.1638
- Rent YoY
- —
- Metro
- —
- State GDP YoY
- ▲ 3.80%
- F500 in state
- 10
Industry mix (Fortune 500 HQ in AR)
| Industry | F500 HQs | Revenue |
|---|---|---|
| Retail | 1 | $681B |
|
||
| Food / Agriculture | 1 | $53B |
|
||
| Retail / Energy | 1 | $22B |
|
||
| Transportation / Logistics | 1 | $12B |
|
||
| Energy | 1 | $4B |
|
||
Price history
+0.0% since first listed5 events — show timeline
- 2026-06-16 Listed for Rent $1,300 Avail
- 2026-06-15 Listing Removed — CARMLS
- 2026-05-04 Listed $159,900 CARMLS
- 2025-07-02 Rental Removed $1,300 Avail
- 2025-06-19 Listed for Rent $1,300 Avail
Cash-flow waterfall
monthlySold comps — $/sqft
last 12 mo · ≤1 miLoading sold comps…