4110 Rahn Rd #221 · Eagan, MN
Flood risk 1/10 · Minimal
- FEMA flood zone
- X (unshaded)
- Chance of flooding over 30 yrs
- 0.0%
- Est. flood insurance / yr
- $507 – $1,088
Fire risk 3/10 · Minor
- Est. fire insurance / yr
- $888 – $1,650
Heat risk 2/10 · Minimal
- Hot days now (above 99°F)
- 7 days/yr
- Hot days in 30 yrs
- 14 days/yr
Wind risk 2/10 · Minimal
- Chance of severe wind over 30 yrs
- —
Air-quality risk 2/10 · Minimal
- Unhealthy air days now
- 1 days/yr
- Unhealthy air days in 30 yrs
- 1 days/yr
Risk factors via First Street. Map © Google.
Why this score? — see what drove the C- grade
The composite is a weighted blend of 9 inputs, each scored 0–100. Each bar is that input's sub-score; the figure is the points it added to the 100-point composite (weight × sub-score).
- Cash flow +15.6/30.0
- 1% rule +10.0/10.0
- ARV discount +7.5/15.0
- Schools +4.9/10.0
- DSCR +4.8/10.0
- Livability +4.3/5.0
- Rent growth +2.7/5.0
- Condition / age +2.5/5.0
- Appreciation +0.0/10.0
$107,500
🖨 Deal sheet 📄 Offer letter ✓ Due diligence
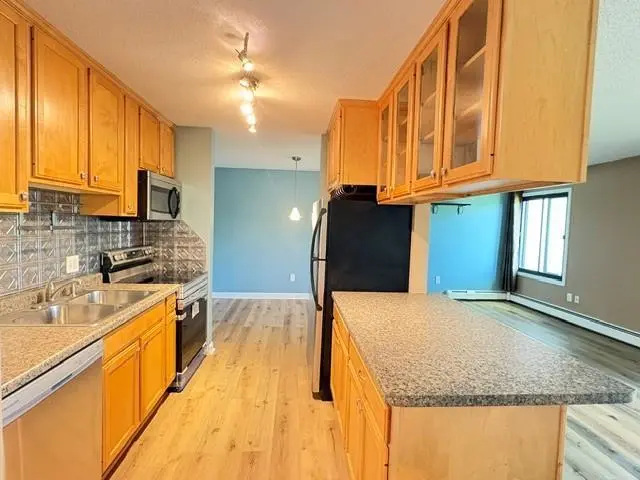
Listing remarks
Spacious 2 bedroom 1 bath condo in the established Eagan on the Green development. This unit comes with new flooring, stainless appliances, fresh paint, covered balcony, 2 parking spots, ample storage and more. HOA includes, heat, trash, water/sewer and hazard insurance. Rentals are allowed. ? Amenities include: Coin-op laundry, tennis court, kids playground, basketball court, BBQ grills, picnic tables, private off-leash dog park, and exercise room. Single garage plus one parking ramp stall included.
Key facts
- Tennis court
- Covered balcony
- New flooring
Tags
Property features AI
Finance
- Other: Living area reported as 1,481 square feet (total); Foundation area listed as 900
- Financial info: Rental license: Standard (rental license on file)
- HOA & community: HOA: Cities Management; Monthly association fee ($519/month) covering hazard insurance, lawn care, grounds maintenance, professional management, snow removal, and water; Community deck amenity
Exterior
- Parking: Attached garage (1 car)
- Utilities: City water connected; City sewer connected; Natural gas
- Home design: Residential attached property; Two levels; Main entry level is the main floor; Has additional parcels
- Construction: Frame construction; Slab foundation; Built with approximately 900 sq ft main level finished area
- Exterior features: Vinyl exterior; No fencing; Patio
Interior
- Kitchen: Range; Microwave; Dishwasher; Refrigerator
- Bedrooms: Two bedrooms on the main level (13x11 and 10x10)
- Bathrooms: One full bathroom on the main level
- Heating & cooling: Forced air heating; Wall unit air conditioning
- Interior features: Fireplace (1); Main floor full bathroom; Kitchen/dining room layout; Walk-in closet; Patio
- Laundry & utility: Washer; Dryer; Gas water heater
Neighborhood map
What this means for you Summary
Snapshot
- This is a 2-bed/1.0-bath townhouse listed at $108k.
Deal economics
- At list price, monthly cash flow is $45 ($545/yr) — positive.
- The deal already cash-flows at list — no discount required.
- Meets the 1% rule at list price ($2k rent vs $108k).
- Recommended offer: $106k (1.5% below list) — sets the bar for market timing.
- Cap rate 6.8% vs local median 3.3% in Eagan — top-decile yield for the area; either an underpriced asset or a hidden risk that comps aren't pricing in. Stress-test before assuming the spread holds.
Location & tenants
- Location reads 86/100 on livability (#13 in MN, #418 nationally) — a professional / high-income tenant draw. Strengths: commute A+, employment A+, housing A+; Watch: cost of living D+, amenities F.
- Rosemount-Apple Valley-Eagan (suburban): math 50% / reading 58% proficiency, ranked #58 of 301 in MN (top 19%) — acceptable for families but not a draw, mixed tenant base, ~2y average lease; only 18% free/reduced lunch — higher-income household profile.
- Market conditions: Rents flat; 90 active listings in the ZIP; 16 comparable units currently listed for rent nearby; rentals leasing fast (median 5d on market — plan ~1-2 weeks tenant-placement turnaround); solid renter incomes; 2,134 units permitted in Dakota County in 2024 (898 in 5+ unit buildings).
Forward outlook
- Local home prices are declining (-3.0%/yr); year-one equity from $743 of loan paydown is wiped out by about $3k of value loss. Plan a longer hold.
- Dakota County population projected at +11% by 2050 — modest demand growth; plan on rents tracking national, not racing it.
Negotiation context
- It's been on market 30 days — a 2% lower offer ($106k) is reasonable based on typical stale-listing flexibility.
- 3 sale attempts since 21y ago with the ask held roughly flat each time — persistent listings suggest the price (not the market) is what's stuck; bring a comps-based counter.
- Current owner paid $85k; 26% above their basis — modest negotiation headroom, anchor on the comps not their cost.
Risks & watch-outs
- Watch-outs: HOA is 32% of rent.
Questions for the listing agent
- Built in 1972 — when were the roof, HVAC, electrical panel, plumbing, and water heater last replaced?
- What does the HOA fee cover, when was the last increase, and are there any pending special assessments or reserve-fund shortfalls?
- Is there a deadline driving the sale (1031 exchange, divorce, estate, relocation)? That informs how much negotiation room exists.
- Schools are A-rated — typically a magnet for longer-tenancy family renters. What's the average tenant stay here, and is there a school-zone premium baked into asking?
- What's the average days-on-market for RENTAL listings here right now (not sales)? A rising rental-DOM trend means longer vacancies and softer asking-rent achievability than the comps imply.
- What's the recent tenant-quality profile in this submarket — average credit score on applications, eviction rate, late-payment / NSF rate, and stable-employment percentage? A property-management company in the area should have these aggregated.
- How much new for-sale + rental construction is in the pipeline within 1–3 miles? Heavy new supply typically softens prices + rents 12–24 months out; constrained supply supports both.
Investment metrics
- 1% rule
- 1.50% ✓
- Cap rate
- 6.80%
- Cash-on-cash
- 1.81%
- DSCR
- 1.08
- GRM
- 5.6
CMA / ARV
No comps found within radius.
Projected returns pro-forma
-3.0% appreciation · 0.84% rent growth · sell at horizon
- IRR
- -17.1%
- Equity multiple
- 0.41×
- Total profit
- $-17,637
- Equity at exit
- $16,029
- IRR
- -16.8%
- Equity multiple
- 0.21×
- Total profit
- $-23,811
- Equity at exit
- $9,295
Cash invested: $30,100 (down + closing). Projections, not guarantees.
Landlord ↔ Tenant lean methodology
- Overall (STATE)
- 46 Balanced
- State Minnesota
- 46 Balanced · D+2
- County
- — inherits STATE
- City
- — inherits STATE
ZIP-level market 55122
- Rents YoY
- 0.8%
- Active inventory
- 90
- Price-to-rent
- 5.6×
Monthly cashflow live
- Estimated rent
- $1,614 high interval (Pro) →
- Mortgage (P&I)
- −$564
- Tax from tax record
- −$102 /mo · $1,226/yr
- Insurance
- −$45
- HOA
- −$519
- Vacancy / Maint / Mgmt
- −$339
- Net cashflow
- $45
Break-even live
UW: 25.0% down · 7.5% · 30yr · 1.5% tax · 5.0% vac · 8.0% maint · 8.0% mgmt
Financing live
Cash to close
- Down payment
- $26,875
- Closing costs
- $3,225
- Reserves months
- —
- Total cash needed
- —
Loan-product check · same deal, 3 products live
Conventional
25% down · 7.5% · 30yr
- Down + closing
- —
- Monthly P&I
- —
- Monthly cashflow
- —
- DSCR
- —
- Eligible?
- —
Personal DTI + credit; lowest rate.
DSCR
20% down · 8.5% · 30yr
- Down + closing
- —
- Monthly P&I
- —
- Monthly cashflow
- —
- DSCR
- —
- Eligible?
- —
No personal income docs; deal must DSCR.
Hard money
10% down · 12.0% · 12mo
- Down + closing
- —
- Monthly P&I
- —
- Monthly cashflow
- —
- DSCR
- —
- Eligible?
- —
Short-term bridge; refi at stabilization.
Rent comps 16 comps
| Address | Beds | Baths | Sqft | Rent | $/sqft | DOM | Units | Dist |
|---|---|---|---|---|---|---|---|---|
| 4110 Rahn Rd #207 Saint Paul, MN | 2.0 | 1.0 | 911 | $1,695 | $1.86 | 24d | 1 | 0.01mi |
| 1950 Jade Ln Saint Paul, MN | 1.0–2.0 | 1.0 | 806 | $1,595 | $1.98 | 2d | 4 | 0.05mi |
| 4130 Rahn Rd #214 Saint Paul, MN | 2.0 | 1.0 | 911 | $1,350 | $1.48 | 24d | 1 | 0.06mi |
| 4150 Rahn Rd Eagan, MN | 1.0–2.0 | 1.0 | 762 | $1,325 | $1.74 | 2d | 6 | 0.13mi |
| 4130 Durham Ct Eagan, MN | 2.0 | 1.0 | 1076 | $1,750 | $1.63 | 24d | 1 | 0.13mi |
| 1946 Glenfield Ct Saint Paul, MN | 2.0 | 1.0 | 1080 | $1,695 | $1.57 | 24d | 1 | 0.20mi |
| 3903 Cedar Grove Pkwy Saint Paul, MN | 2.0 | 1.0–2.0 | 877 | $2,806 | $3.20 | 1d | 14 | 0.58mi |
| 1811 Trailway Dr Unit 6 St Paul, MN | 1.0 | 1.0 | 755 | $1,349 | $1.79 | 5d | 1 | 0.66mi |
| 3800 Ballantrae Rd Eagan, MN | 3.0 | 1.0–2.0 | 1093 | $2,203 | $2.02 | 1d | 1 | 0.67mi |
| 3825 Cedar Grove Pkwy Saint Paul, MN | 1.0–3.0 | 1.0–2.0 | 1117 | $2,040 | $1.83 | 1d | 26 | 0.67mi |
| 1835 Trailway Dr Unit 6 St Paul, MN | 1.0 | 1.0 | 755 | $1,349 | $1.79 | 5d | 1 | 0.68mi |
| 1813 Trailway Dr Saint Paul, MN | 1.0–2.0 | 1.0–1.5 | 857 | $1,609 | $1.88 | 5d | 6 | 0.69mi |
| 1805 Trailway Dr Apt 7 Eagan, MN | 2.0 | 1.5 | 960 | $1,609 | $1.68 | 24d | 1 | 0.74mi |
| 1803 Trailway Dr Apt 6 St Paul, MN | 1.0 | 1.0 | 755 | $1,389 | $1.84 | 17d | 1 | 0.75mi |
| 4502 Cinnamon Ridge Trl Unit B Saint Paul, MN | 2.0 | 1.0 | 1020 | $1,745 | $1.71 | 24d | 1 | 1.31mi |
| 4598 Slater Rd Eagan, MN | 2.0 | 1.5–2.0 | 1150 | $1,780 | $1.55 | 1d | 6 | 1.48mi |
HOA detail
- Monthly dues
- $519 · $6,228/yr
- Likely covers
- watersewertrashinsurance
Listing history 23 events
-
2026-06-18days on market $107,500 Active 30 DOM
-
2026-06-17days on market $107,500 Active 29 DOM
-
2026-06-16days on market $107,500 Active 28 DOM
-
2026-06-15days on market $107,500 Active 27 DOM
-
2026-06-13days on market $107,500 Active 25 DOM
-
2026-06-13days on market $107,500 Active 24 DOM
-
2026-06-09days on market $107,500 Active 21 DOM
-
2026-06-08pricedays on market $107,500 Active 20 DOM
-
2026-06-07days on market $111,999 Active 19 DOM
-
2026-06-04days on market $111,999 Active 16 DOM
-
2026-06-03days on market $111,999 Active 15 DOM
-
2026-06-02days on market $111,999 Active 14 DOM
-
2026-06-01days on market $111,999 Active 13 DOM
-
2026-05-31days on market $111,999 Active 12 DOM
-
2026-05-19$111,999 Active
-
2024-04-06historical $1,200
-
2024-03-03price $1,200
-
2023-12-22$1,300
-
2017-05-16soldstatus $85,000
-
2015-03-16soldstatus $74,900
-
2011-04-05soldstatus $33,000
-
2005-06-22$122,350
-
2005-06-22historical
ⓘ Source: listings_history table (triggers on properties + properties_extension) + one-shot
backfill from property_details.listing_events for pre-trigger history.
Tax reassessment forecast MN · Partial reset (capped growth)
- Current annual tax
- $1,226 · $102/mo
- Projected year-2 tax
- $1,226 · $102/mo
- Expected delta
- $0/yr ($0/mo · 0.0%)
ⓘ Screening estimate from a state-policy table — verify with the county assessor before closing.
Climate risk First Street
- Flood 1/10 Low FEMA zone X (unshaded) · 0% chance over 30 yrs
- Wildfire 3/10 Moderate
- Heat 2/10 Low 7 d/yr ≥99°F today · 14 d/yr by 30 yrs out
- Wind 2/10 Low
- Air quality 2/10 Low 1 unhealthy d/yr today · 1 by 30 yrs out
Nearby sold comps map
Loading sold comps map…
Walkable amenities ~0.75 mi
Loading nearby amenities…
Taxation est. · year 1
- Rental income
- $19,369
- − Mortgage interest
- −$6,022
- − Property taxes
- −$1,226
- − Insurance
- −$538
- − Repairs & maintenance
- −$1,550
- − Management
- −$1,550
- − HOA
- −$6,228
- − Depreciation
- −$3,127
- Taxable loss
- −$870
- Est. tax savings @ 24.0%
- +$209
- After-tax cash flow
- $754/yr
For passive investors: Depreciation is non-cash, so a rental often shows a tax loss while cash-flowing — sheltering income. Rental losses are passive: they offset passive income freely, and up to $25,000/yr can offset ordinary (W-2) income if you actively participate and your MAGI is under $100k (phasing out to $0 by $150k); unused losses carry forward. On sale, claimed depreciation is recaptured at up to 25%, and gains may owe capital-gains tax (a 1031 exchange can defer both). Figures are a year-1 estimate at your 24.0% rate — not tax advice; consult a CPA.
Schools (NCES district)
- District
- Rosemount-Apple Valley-Eagan
- NCES district ID
- 2732390
- Math proficiency
- 50% ▼ -14.00%
- Reading proficiency
- 58% ▼ -7.00%
- Median HH income
- $85,559
- Composite
- 49.48/100
- National rank
- #2000
- State rank
- #58 of 301 in MN
Livability — Eagan
- Score
- 86/100
- State rank
- #13
- US rank
- #418
Category grades
Schools grade is shown separately in the Schools card above.
Census & demographics
- Census place
- Eagan, MN
- County
- Dakota County · 417,704 people
- City population
- 67,960
- Metro
- Minneapolis-St. Paul-Bloomington, MN-WI
- Population (ZIP)
- 32,261
- Household income
- $96,823
- Rent vs Own
- Severe rent burden
- 1005.0
Population outlook (Dakota County) Hauer SSP2
- Today (2025)
- 450,671 people
- By 2030
- 465,068 · +3.2%
- By 2040
- 486,770 · +8.0%
- By 2050
- 498,743 · +10.7%
- By 2075
- 533,865 · +18.5%
- By 2100
- 550,133 · +22.1%
Race, ethnicity, and origin ACS 2023
- Neighborhood character
- Predominantly White (68%)
- Race & ethnicity
- White 68% Black 15% Asian 9% Hispanic / Latino 5% Two or more races 5%
- Hispanic origin (detail)
- Mexican 4%
- Common ancestry
- Portuguese 10% Romanian 3% Iranian 3%
- Foreign-born
- 15% · Canada, Philippines, China
- Languages at home
- 84% English-only · Other Asian/Pacific 4% Spanish 2% Chinese 1%
Political lean MEDSL · Dakota
- 2024 margin
- D (+12.9) · D 55.4% · R 42.5% · Other 2.1%
- 2008→2024 swing
- +7.4pp toward D · 2008: 5.5pp · 2024: 12.9pp
- All cycles
- 2024: D+12.9 2020: D+13.9 2016: D+4.7 2012: D+2.9 2008: D+5.5
Not yet ingested
- Civics
- —
Market trends
- HPI YoY
- ▼ -230.39%
- Current HPI
- 226.6631
- Rent YoY
- ▲ 0.84%
- Metro
- Minneapolis-St. Paul-Bloomington, MN-WI
- State GDP YoY
- ▲ 2.41%
- F500 in state
- 34
Industry mix (Fortune 500 HQ in MN)
| Industry | F500 HQs | Revenue |
|---|---|---|
| Healthcare | 2 | $407B |
|
||
| Retail | 2 | $150B |
|
||
| Consumer Goods | 2 | $32B |
|
||
| Industrial Machinery | 2 | $6B |
|
||
| Agriculture | 1 | $40B |
|
||
| Healthcare / Medical Devices | 1 | $32B |
|
||
Price history
-8.5% since first listed9 events — show timeline
- 2026-05-19 Listed $111,999 NORTHSTARMLS as Distributed by MLS Grid
- 2024-04-06 Rental Removed $1,200 RENTFEEDER
- 2024-03-03 Price Changed $1,200 RENTFEEDER
- 2023-12-22 Listed for Rent $1,300 RENTFEEDER
- 2017-05-16 Sold (Public Records) $85,000 Public Records
- 2015-03-16 Sold (Public Records) $74,900 Public Records
- 2011-04-05 Sold (Public Records) $33,000 Public Records
- 2005-06-22 Listing Removed — NORTHSTARMLS as Distributed by MLS Grid
- 2005-06-22 Listed $122,350 NORTHSTARMLS as Distributed by MLS Grid
Property tax history
+10.5%/yrLatest (2025): $1,226 · -5.3% YoY. Source: county tax records.
Cash-flow waterfall
monthlySold comps — $/sqft
last 12 mo · ≤1 miLoading sold comps…