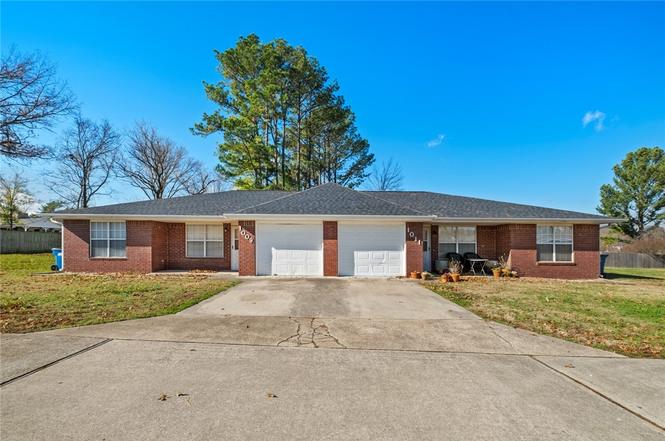
1009/1011 NW 12th St · Bentonville, AR
Flood risk 1/10 · Minimal
- FEMA flood zone
- X (unshaded)
- Chance of flooding over 30 yrs
- 0.0%
- Est. flood insurance / yr
- $507 – $1,088
Fire risk 3/10 · Minor
- Est. fire insurance / yr
- $1,499 – $2,785
Heat risk 5/10 · Moderate
- Hot days now (above 104°F)
- 7 days/yr
- Hot days in 30 yrs
- 21 days/yr
Wind risk 2/10 · Minimal
- Chance of severe wind over 30 yrs
- 2.0%
Air-quality risk 2/10 · Minimal
- Unhealthy air days now
- 1 days/yr
- Unhealthy air days in 30 yrs
- 1 days/yr
Risk factors via First Street. Map © Google.
Why this score? — see what drove the D grade
The composite is a weighted blend of 9 inputs, each scored 0–100. Each bar is that input's sub-score; the figure is the points it added to the 100-point composite (weight × sub-score).
- Cash flow +11.8/30.0
- ARV discount +7.5/15.0
- Schools +5.2/10.0
- Livability +4.2/5.0
- Rent growth +3.6/5.0
- DSCR +3.5/10.0
- Condition / age +2.5/5.0
- 1% rule +2.4/10.0
- Appreciation +0.0/10.0
$560,000
🖨 Deal sheet 📄 Offer letter ✓ Due diligence
Listing remarks
Fantastic location on an oversized . 45 acre lot. Duplex near downtown Bentonville featuring 2bed/2bath/1 car garage units. Great investment in superior Bentonville location. Additional duplex also available at same price next to this listing. Unit 1011 is tenant occupied. Please do not disturb tenants. Unit 1009 is vacant and may be shown. There are no other duplex offerings in this Bentonville core location at this price point.
Key facts
- Tenant occupied
- Oversized lot
- Vacant unit
Tags
Property features AI
Finance
- Financial info: Multi-family property with 2 units; Gross income reported as $30,000; One unit listed with actual rent of $1,250
- HOA & community: HOA/association fee paid monthly; Community features include biking and trails/paths
Exterior
- Parking: Attached garage with garage door opener; 2 covered parking spaces
- Utilities: Central heating and cooling; Gas water heater
- Home design: Single-story building; Brick construction; Slab foundation
- Construction: Brick construction; Architectural shingle roof; Built on slab foundation
- Exterior features: Concrete driveway; Located on a cul-de-sac; Central Business District location; Access via private and public roads
Interior
- Kitchen: Gas water heater (appliance listed)
- Bedrooms: Two 2-bedroom units
- Flooring: Carpet; Vinyl
- Bathrooms: Each unit has 2 full bathrooms
- Heating & cooling: Central heating; Central air conditioning
- Interior features: Carpet and vinyl flooring
Neighborhood map
What this means for you Summary
Snapshot
- This is a 4-bed/3.0-bath other listed at $560k.
Deal economics
- At list price, monthly cash flow is $-158 ($-2k/yr) — negative.
- To cash-flow at today's rent, offer at most $532k (5.0% below list).
- To meet the 1% rule (rent ≥ 1% of price), the offer needs to be $413k (26.3% below list).
- Recommended offer: $413k (26.3% below list) — sets the bar for 1% rule.
- Cap rate 6.0% vs local median 2.6% in Bentonville — top-decile yield for the area; either an underpriced asset or a hidden risk that comps aren't pricing in. Stress-test before assuming the spread holds.
Location & tenants
- Location reads 83/100 on livability (#2 in AR, #864 nationally) — a professional / high-income tenant draw. Strengths: employment A+, housing A+, health & safety A+; Watch: amenities F.
- Bentonville School District (urban): math 59% / reading 59% proficiency, ranked #3 of 238 in AR (top 1%) — acceptable for families but not a draw, mixed tenant base, ~2y average lease.
- Market conditions: Rents rising fast (+4.4%/yr); 736 active listings in the ZIP; 25 comparable units currently listed for rent nearby; rentals at typical pace (median 21d on market — plan ~3-4 weeks tenant-placement turnaround); high-income renter base; 4,359 units permitted in Benton County in 2024 (402 in 5+ unit buildings).
- This rent runs 45% of the median local income ($111k/yr) — at the standard rent-burdened threshold; future hikes will face affordability resistance.
Forward outlook
- Local home prices are declining (-3.0%/yr); year-one equity from $4k of loan paydown is wiped out by about $17k of value loss. Plan a longer hold.
- Benton County population projected at +56% by 2050 — long-run rental-demand tailwind backs the buy-and-hold thesis.
Negotiation context
- It's been on market 163 days — a 12% lower offer ($493k) is reasonable based on typical stale-listing flexibility.
Risks & watch-outs
- Climate carrying-cost: extreme-heat days projected 7→21/yr by 2055 (HVAC capex compounding) — expect insurance premiums to compound above CPI over the hold.
Questions for the listing agent
- What do current leases actually rent for vs. the listed asking? Can we see a recent rent roll and the last 12 months of T-12 income?
- It's been on market 163 days. Have you received any prior offers? Is the seller open to a 26% concession, seller financing, or rate buy-down credit?
- Why hasn't it sold? Are there any deal-killer items the seller is aware of (foundation, flood, title, zoning, code violations)?
- Is there a deadline driving the sale (1031 exchange, divorce, estate, relocation)? That informs how much negotiation room exists.
- Schools are A-rated — typically a magnet for longer-tenancy family renters. What's the average tenant stay here, and is there a school-zone premium baked into asking?
- The area grade is low — what's the realistic commute time and amenity access for the typical tenant pool here? Any planned neighborhood developments (good or bad) we should know about?
- What's the average days-on-market for RENTAL listings here right now (not sales)? A rising rental-DOM trend means longer vacancies and softer asking-rent achievability than the comps imply.
- What's the recent tenant-quality profile in this submarket — average credit score on applications, eviction rate, late-payment / NSF rate, and stable-employment percentage? A property-management company in the area should have these aggregated.
- How much new for-sale + rental construction is in the pipeline within 1–3 miles? Heavy new supply typically softens prices + rents 12–24 months out; constrained supply supports both.
Investment metrics
- 1% rule
- 0.74% ✗
- Cap rate
- 5.96%
- Cash-on-cash
- -1.21%
- DSCR
- 0.95
- GRM
- 11.3
CMA / ARV
No comps found within radius.
Projected returns pro-forma
-3.0% appreciation · 4.39% rent growth · sell at horizon
- IRR
- -17.0%
- Equity multiple
- 0.39×
- Total profit
- $-95,147
- Equity at exit
- $83,498
- IRR
- -6.8%
- Equity multiple
- 0.54×
- Total profit
- $-71,962
- Equity at exit
- $48,419
Cash invested: $156,800 (down + closing). Projections, not guarantees.
Landlord ↔ Tenant lean methodology
- Overall (STATE)
- 92 Strongly Landlord-Friendly
- State Arkansas
- 92 Strongly Landlord-Friendly · R+14
- County
- — inherits STATE
- City
- — inherits STATE
ZIP-level market 72712
- Home prices YoY
- -15.5%
- Rents YoY
- 4.4%
- Active inventory
- 736
- Price-to-rent
- 11.3×
Monthly cashflow live
- Estimated rent
- $4,125 high interval (Pro) →
- Mortgage (P&I)
- −$2,937
- Tax from tax record
- −$247 /mo · $2,959/yr
- Insurance
- −$233
- HOA
- −$0
- Vacancy / Maint / Mgmt
- −$866
- Net cashflow
- $-158
Break-even live
UW: 25.0% down · 7.5% · 30yr · 1.5% tax · 5.0% vac · 8.0% maint · 8.0% mgmt
Financing live
Cash to close
- Down payment
- $140,000
- Closing costs
- $16,800
- Reserves months
- —
- Total cash needed
- —
Loan-product check · same deal, 3 products live
Conventional
25% down · 7.5% · 30yr
- Down + closing
- —
- Monthly P&I
- —
- Monthly cashflow
- —
- DSCR
- —
- Eligible?
- —
Personal DTI + credit; lowest rate.
DSCR
20% down · 8.5% · 30yr
- Down + closing
- —
- Monthly P&I
- —
- Monthly cashflow
- —
- DSCR
- —
- Eligible?
- —
No personal income docs; deal must DSCR.
Hard money
10% down · 12.0% · 12mo
- Down + closing
- —
- Monthly P&I
- —
- Monthly cashflow
- —
- DSCR
- —
- Eligible?
- —
Short-term bridge; refi at stabilization.
Rent comps 25 comps
| Address | Beds | Baths | Sqft | Rent | $/sqft | DOM | Units | Dist |
|---|---|---|---|---|---|---|---|---|
| 705 NW J St Unit 1221874P Bentonville, AR | 4.0 | 3.0 | 2346 | $6,824 | $2.91 | 13d | 1 | 0.36mi |
| 1515 NW Bell Royal Ct Unit 1314699P Bentonville, AR | 4.0 | 2.5 | 2303 | $4,422 | $1.92 | 21d | 1 | 0.44mi |
| 1517 NW Bell Royal Ct Unit 1297037P Bentonville, AR | 4.0 | 2.5 | 2303 | $4,313 | $1.87 | 21d | 1 | 0.45mi |
| 4 Jonquilla Way Unit B Bentonville, AR | 4.0 | 2.5 | 1716 | $1,900 | $1.11 | 23d | 1 | 0.51mi |
| 304 Coachlight Dr Unit 1221882P Bentonville, AR | 4.0 | 2.0 | 1926 | $5,773 | $3.00 | 14d | 1 | 0.73mi |
| 414 NW Retreat Ln Unit 1221809P Bentonville, AR | 3.0 | 2.5 | 1743 | $6,267 | $3.60 | 14d | 1 | 0.78mi |
| 406 NW Retreat Ln Bentonville, AR | 3.0 | 2.5 | 1750 | $4,400 | $2.51 | 23d | 1 | 0.79mi |
| 210 NW 9th St Unit 1 Bentonville, AR | 3.0 | 3.5 | 2146 | $4,150 | $1.93 | 23d | 1 | 0.79mi |
| 208 NW 9th St Unit 1 Bentonville, AR | 3.0 | 3.5 | 2147 | $4,150 | $1.93 | 21d | 1 | 0.80mi |
| 604 NW B St Unit 1221860P Bentonville, AR | 3.0 | 2.0 | 2271 | $8,542 | $3.76 | 21d | 1 | 0.87mi |
| 109 NW Ozark Way Unit 1221875P Bentonville, AR | 4.0 | 3.0 | 2055 | $9,114 | $4.44 | 21d | 1 | 0.87mi |
| 1802 NW Mustang Ave Unit 1241310P Bentonville, AR | 4.0 | 3.0 | 1991 | $3,625 | $1.82 | 21d | 1 | 0.90mi |
| 2505 NW 6th St Unit 1221892P Bentonville, AR | 4.0 | 2.0 | 2938 | $4,627 | $1.57 | 14d | 1 | 1.05mi |
| 107 NW Winfield Ln Bentonville, AR | 3.0 | 2.0 | 2044 | $2,695 | $1.32 | 23d | 1 | 1.06mi |
| 649 SW 2nd St Bentonville, AR | 4.0 | 3.0 | 2176 | $4,700 | $2.16 | 23d | 1 | 1.09mi |
| 103 SW E St Unit 1221849P Bentonville, AR | 4.0 | 3.0 | 2454 | $10,431 | $4.25 | 23d | 1 | 1.11mi |
| 342 SW D St Bentonville, AR | 3.0 | 2.5 | 1660 | $1,995 | $1.20 | 23d | 1 | 1.33mi |
| 442 SW Glover St Bentonville, AR | 3.0 | 2.5 | 1893 | $5,000 | $2.64 | 23d | 1 | 1.34mi |
| 1403 NE Benjamin Grn Bentonville, AR | 4.0 | 3.0 | 2386 | $2,500 | $1.05 | 21d | 1 | 1.42mi |
| 812 NE Heights Ln Bentonville, AR | 3.0 | 2.0 | 1670 | $2,600 | $1.56 | 23d | 1 | 1.43mi |
| 444 SW B St Bentonville, AR | 3.0 | 2.5 | 1608 | $2,550 | $1.59 | 23d | 1 | 1.44mi |
| 1410 NE Benjamin Grn Bentonville, AR | 4.0 | 3.0 | 2089 | $2,600 | $1.24 | 21d | 1 | 1.46mi |
| 2318 SW Clover Ct Unit 1221889P Bentonville, AR | 4.0 | 2.5 | 2551 | $8,354 | $3.27 | 21d | 1 | 1.49mi |
| 11 Valley View Cir Bentonville, AR | 3.0 | 2.0 | 1455 | $2,500 | $1.72 | 23d | 1 | 1.50mi |
| 837 NE Heights Ln Bentonville, AR | 3.0 | 2.0 | 1670 | $2,600 | $1.56 | 23d | 1 | 1.50mi |
Listing history 21 events
-
2026-06-18days on market $560,000 Active 163 DOM
-
2026-06-17days on market $560,000 Active 162 DOM
-
2026-06-15days on market $560,000 Active 160 DOM
-
2026-06-14days on market $560,000 Active 158 DOM
-
2026-06-10days on market $560,000 Active 155 DOM
-
2026-06-09days on market $560,000 Active 154 DOM
-
2026-06-08days on market $560,000 Active 153 DOM
-
2026-06-07pricedays on market $560,000 Active 152 DOM
-
2026-06-05days on market $575,000 Active 149 DOM
-
2026-06-03days on market $575,000 Active 148 DOM
-
2026-06-02days on market $575,000 Active 147 DOM
-
2026-06-01days on market $575,000 Active 146 DOM
-
2026-05-31days on market $575,000 Active 145 DOM
-
2026-05-31days on market $575,000 Active 144 DOM
-
2026-05-19price $575,000
-
2026-04-15price $590,000
-
2026-04-02price $595,000
-
2026-03-16price $600,000
-
2026-03-06price $630,000
-
2026-01-06$650,000 Active
-
2025-11-20soldstatus $2,800,000
ⓘ Source: listings_history table (triggers on properties + properties_extension) + one-shot
backfill from property_details.listing_events for pre-trigger history.
Tax reassessment forecast AR · Resets to sale price
- Current annual tax
- $2,959 · $247/mo
- Projected year-2 tax
- $3,584 · $299/mo
- Expected delta
- +$625/yr (+$52/mo · 21.1%)
ⓘ Screening estimate from a state-policy table — verify with the county assessor before closing.
Climate risk First Street
- Flood 1/10 Low FEMA zone X (unshaded) · 0% chance over 30 yrs
- Wildfire 3/10 Moderate
- Heat 5/10 Major 7 d/yr ≥104°F today · 21 d/yr by 30 yrs out
- Wind 2/10 Low 2% chance of damaging wind over 30 yrs
- Air quality 2/10 Low 1 unhealthy d/yr today · 1 by 30 yrs out
Nearby sold comps map
Loading sold comps map…
Walkable amenities ~0.75 mi
Loading nearby amenities…
Taxation est. · year 1
- Rental income
- $49,504
- − Mortgage interest
- −$31,369
- − Property taxes
- −$2,959
- − Insurance
- −$2,800
- − Repairs & maintenance
- −$3,960
- − Management
- −$3,960
- − Depreciation
- −$16,291
- Taxable loss
- −$11,835
- Est. tax savings @ 24.0%
- +$2,840
- After-tax cash flow
- $950/yr
For passive investors: Depreciation is non-cash, so a rental often shows a tax loss while cash-flowing — sheltering income. Rental losses are passive: they offset passive income freely, and up to $25,000/yr can offset ordinary (W-2) income if you actively participate and your MAGI is under $100k (phasing out to $0 by $150k); unused losses carry forward. On sale, claimed depreciation is recaptured at up to 25%, and gains may owe capital-gains tax (a 1031 exchange can defer both). Figures are a year-1 estimate at your 24.0% rate — not tax advice; consult a CPA.
Schools (NCES district)
- District
- Bentonville School District
- NCES district ID
- 0503060
- Math proficiency
- 59% ▼ -8.00%
- Reading proficiency
- 59% ▼ -6.00%
- Median HH income
- $66,721
- Composite
- 51.85/100
- National rank
- #1661
- State rank
- #3 of 238 in AR
Livability — Bentonville
- Score
- 83/100
- State rank
- #2
- US rank
- #864
Category grades
Schools grade is shown separately in the Schools card above.
Census & demographics
- Census place
- Bentonville, AR
- County
- Benton County · 259,241 people
- City population
- 67,689
- Metro
- Fayetteville-Springdale-Rogers, AR
- Population (ZIP)
- 38,690
- Household income
- $110,514
- Rent vs Own
- Severe rent burden
- 932.0
Population outlook (Benton County) Hauer SSP2
- Today (2025)
- 318,683 people
- By 2030
- 353,481 · +10.9%
- By 2040
- 425,280 · +33.4%
- By 2050
- 497,239 · +56.0%
- By 2075
- 662,114 · +107.8%
- By 2100
- 776,431 · +143.6%
Race, ethnicity, and origin ACS 2023
- Neighborhood character
- Diverse neighborhood (Simpson 0.55)
- Race & ethnicity
- White 66% Two or more races 17% Hispanic / Latino 10% Asian 6% Black 4%
- Hispanic origin (detail)
- Mexican 7%
- Common ancestry
- Slovak 3% Italian 2% Lithuanian 2%
- Foreign-born
- 11% · Canada, Vietnam, China
- Languages at home
- 89% English-only · Spanish 6% Other Asian/Pacific 2% Other Indo-European 2%
Political lean MEDSL · Benton
- 2024 margin
- Strong R (+27.0) · D 35.2% · R 62.1% · Other 2.7%
- 2008→2024 swing
- +9.6pp toward D · 2008: -36.5pp · 2024: -27.0pp
- All cycles
- 2024: R+27.0 2020: R+26.4 2016: R+34.9 2012: R+40.4 2008: R+36.5
Not yet ingested
- Civics
- —
Market trends
- HPI YoY
- ▼ -66.76%
- Current HPI
- 365.1641
- Rent YoY
- ▲ 4.39%
- Metro
- Fayetteville-Springdale-Rogers, AR
- State GDP YoY
- ▲ 3.80%
- F500 in state
- 10
Industry mix (Fortune 500 HQ in AR)
| Industry | F500 HQs | Revenue |
|---|---|---|
| Retail | 1 | $681B |
|
||
| Food / Agriculture | 1 | $53B |
|
||
| Retail / Energy | 1 | $22B |
|
||
| Transportation / Logistics | 1 | $12B |
|
||
| Energy | 1 | $4B |
|
||
Price history
-79.5% since first listed7 events — show timeline
- 2026-05-19 Price Changed $575,000 NWARMLS
- 2026-04-15 Price Changed $590,000 NWARMLS
- 2026-04-02 Price Changed $595,000 NWARMLS
- 2026-03-16 Price Changed $600,000 NWARMLS
- 2026-03-06 Price Changed $630,000 NWARMLS
- 2026-01-06 Listed $650,000 NWARMLS
- 2025-11-20 Sold (Public Records) $2,800,000 Public Records
Property tax history
+7.4%/yrLatest (2025): $2,959 · +10.0% YoY. Source: county tax records.
Cash-flow waterfall
monthlySold comps — $/sqft
last 12 mo · ≤1 miLoading sold comps…